4984
Kidney stone discrimination using ultrashort TE MRI1Department of Radiology, Medical Physics, Medical Center University of Freiburg, Faculty of Medicine, University of Freiburg, Freiburg, Germany, 2Department of Urology, University Medical Center Freiburg, Faculty of Medicine, University of Freiburg, Freiburg, Germany
Synopsis
Kidney stone disease (urolithiasis) is not only very painful, but can also pose serious health risks, when the fragmentation of infected kidney stones releases bacteria, that may cause post-operative sepsis. In this work we show the ability of Magnetic Resonance Imaging (MRI) to discriminate between common types of kidney stones using relative signal intensity and T2* relaxation times.
Introduction
In the US, the number of reported cases of kidney stone disease is increasing, and a prevalence of as high as 8.8% has been reported1. Stone formation is linked with obesity, low fluid intake and diabetes2. The role of bacteria in stone formation is subject of current research3. While small stones can pass the ureter spontaneously, larger stones require fragmentation (lithotripsy) by focused ultrasound or laser light. During fragmentation bacteria trapped in the kidney stones can be released, which might cause severe post-operative sepsis4. Prior knowledge of the kidney stone composition may help to identify stones prone to infection, so that the clinical treatment can be adapted. Previous work has shown that different types of kidney stones can be discriminated by Computed Tomography (CT)5,6, whereas MRI has shown no significant differences between stone types7. In this work we use UTE MRI and T1 and T2* relaxometry to discriminate between ex-vivo carbonapatite and uric acid kidney stones, the first of which has been shown to be prone to bacterial infection8.Materials and Methods
For relaxometric measurements, both kidney stones (Fig. 1) were placed in saline solution and imaged on a clinical 3T MR system (Prisma Fit, Siemens Healthineers; Erlangen, Germany) using a 3D UTE sequence. To measure T2*, in total 8 images were acquired at increasing echo times (TE=50,80,150,300,600,1000,2000,4000 $$$\mu$$$s at $$$\alpha$$$=16°, TR=7.6 ms), and for T1 quantification 8 data sets with different excitation angles ($$$\alpha$$$=5,10,15,20,25,30,40,50 ° at TE=50 $$$\mu$$$s, TR=2.94 ms) were measured. For each image, 60.000 radial spokes were acquired and reconstructed in a 160x160x160 matrix resulting in a spatial resolution of 0.75 mm, bandwidth was 2000 Hz/pixel for all 16 measurements. For the T1 measurements 3 averages were acquired to increase SNR. The samples were placed on the axis of a custom build Tx/Rx solenoid coil (Fig. 2). Transmitter adjustments were performed using the saline water in the sample.
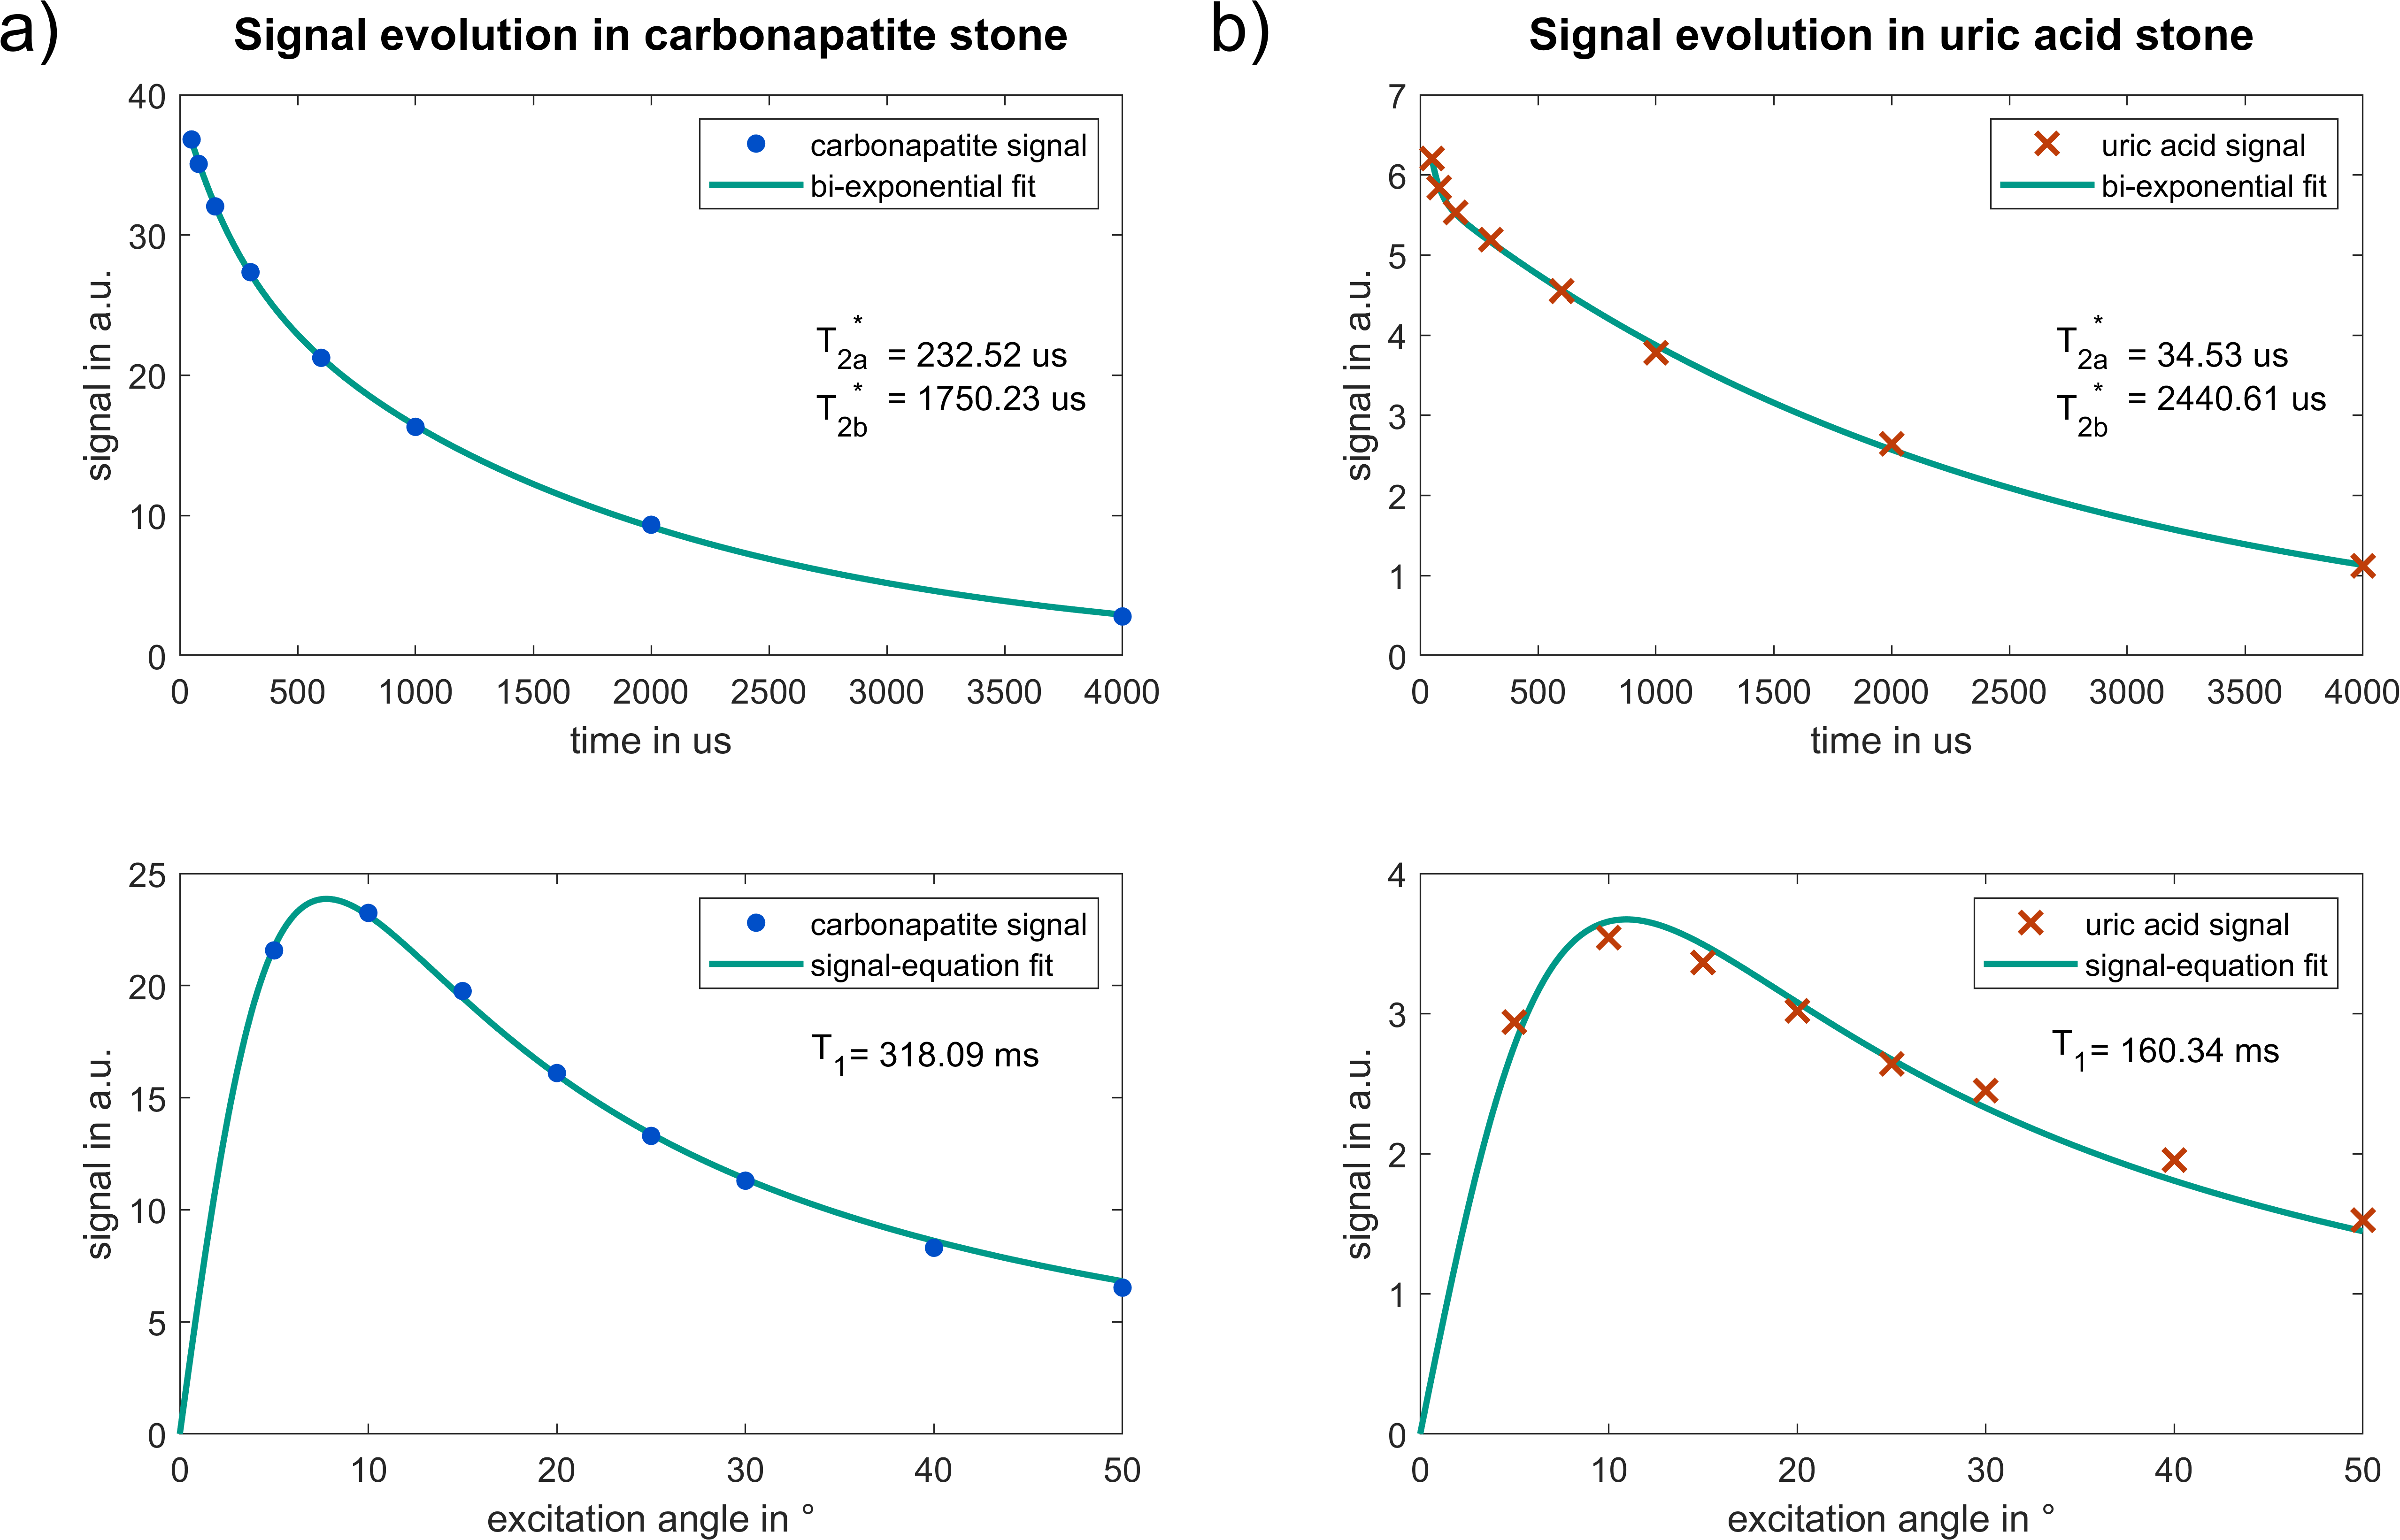
A voxel-wise fit of relaxation parameters T1 and T2* was performed for all voxel containing kidney stone material. For the analysis of T2*, a mono-exponential fit was first performed on the image data $$$S$$$. For a coefficient of determination $$$R^2$$$ below 0.99, a second, bi-exponential model was used. For T1 values, the FLASH-equation9 was fit to the data:
$$S(\mathrm{TE})=a\mathrm e^{-\frac{\mathrm{TE}}{{T^*_2}_a}}$$
$$\text{or, if }R^2< 0.99\quad S(\mathrm{TE})=a\mathrm e^{-\frac{\mathrm{TE}}{{T^*_2}_a}}+b\mathrm e^{-\frac{\mathrm{TE}}{{T^*_2}_b}}$$
$$S(\alpha)=M_0\mathrm{sin}\alpha\frac{1-\mathrm e^{-\frac{\mathrm{TR}}{T_1}}}{1-\mathrm{cos}\alpha\,\mathrm e^{-\frac{\mathrm{TR}}{T_1}}}$$
Here, $$$a$$$ and $$$b$$$ describe the relative amplitudes of the short and long transverse relaxation components $$${T^*_2}_a$$$ and $$${T^*_2}_b$$$. $$$M_0$$$ is the fully relaxed longitudinal magnetization and TR the repetition time of the UTE sequence.
Results
The MR images in figure 3 show a hyperintense signal compared to the surrounding saline solution in the carbonapatite sample whereas the uric acid stone appears hypointense compared to the saline solution. Results from the fit of the relaxation parameters to the signal in a single voxel are exemplified in figure 4 and show a strong difference in the short T2* relaxation time. Further analysis of the short T2* fit parameter shows a strong difference between both samples, as can be seen from the scatterplot in figure 5. Only voxels with a significant signal relaxation of both relaxation times - where the amplitude $$$a$$$ of the short T2* component is higher than $$$b/5$$$ - are considered in order to suppress erratic fit results due to noise in images acquired with short TE.Conclusion
The difference in image intensity alone allows for a separation of carbonapatite and uric acid stone with MR imaging, which encourages further investigation of other kidney stone materials, such as calcium oxalate. Additionally, both samples also differ in their short T2* component, whereas the long T2* component in both is largely similar.Acknowledgements
Grant support from the Deutsche Forschungsgemeinschaft (DFG) under grant numbers BO 3025/8-1 and UL 1187/6-1 is gratefully acknowledged.References
[1] C. D. Scales, A. C. Smith, J. M. Hanley, und C. S. Saigal, „Prevalence of Kidney Stones in the United States“, Eur. Urol., Bd. 62, Nr. 1, S. 160–165, Juli 2012.
[2] S. R. Khan u. a., „Kidney stones“, Nat. Rev. Dis. Primer, Bd. 2, S. 16008, Feb. 2016.
[3] A. L. Schwaderer und A. J. Wolfe, „The association between bacteria and urinary stones“, Ann. Transl. Med., Bd. 5, Nr. 2, Jan. 2017.
[4] O. Shoshany u. a., „Percutaneous nephrolithotomy for infection stones: what is the risk for postoperative sepsis? A retrospective cohort study“, Urolithiasis, Bd. 43, Nr. 3, S. 237–242, Juni 2015.
[5] D. E. Zilberman, M. N. Ferrandino, G. M. Preminger, E. K. Paulson, M. E. Lipkin, und D. T. Boll, „In Vivo Determination of Urinary Stone Composition Using Dual Energy Computerized Tomography With Advanced Post-Acquisition Processing“, J. Urol., Bd. 184, Nr. 6, S. 2354–2359, Dez. 2010.
[6] K. Wilhelm u. a., „Focused Dual-energy CT Maintains Diagnostic and Compositional Accuracy for Urolithiasis Using Ultralow-dose Noncontrast CT“, Urology, Bd. 86, Nr. 6, S. 1097–1103, Dez. 2015.
[7] E.-S. H. Ibrahim u. a., „Detection of different kidney stone types: an ex vivo comparison of ultrashort echo time MRI to reference standard CT“, Clin. Imaging, Bd. 40, Nr. 1, S. 90–95, Jan. 2016.
[8] H. Ansari, A. A. Sepahi, und M. A. Sepahi, „Different Approaches to Detect “Nanobacteria” in Patients with Kidney Stones: an Infectious Cause or a Subset of Life?“, Urol. J., Bd. 14, Nr. 5, S. 5001–5007, Aug. 2017.
[9] A. Haase, J. Frahm, D. Matthaei, W. Hanicke, und K.-D. Merboldt, „FLASH imaging. Rapid NMR imaging using low flip-angle pulses“, J. Magn. Reson. 1969, Bd. 67, Nr. 2, S. 258–266, Apr. 1986.
Figures