4983
Calculation of molar relaxivity and concentration map of Gd-DTPA map using quantitative parameter map before and after injection for brain metastasis1Tokushima University, Tokushima, Japan, 2Research & Development Group, Hitachi, Ltd., Tokyo, Japan, 3Healthcare Business Unit, Hitachi, Ltd., Tokyo, Japan
Synopsis
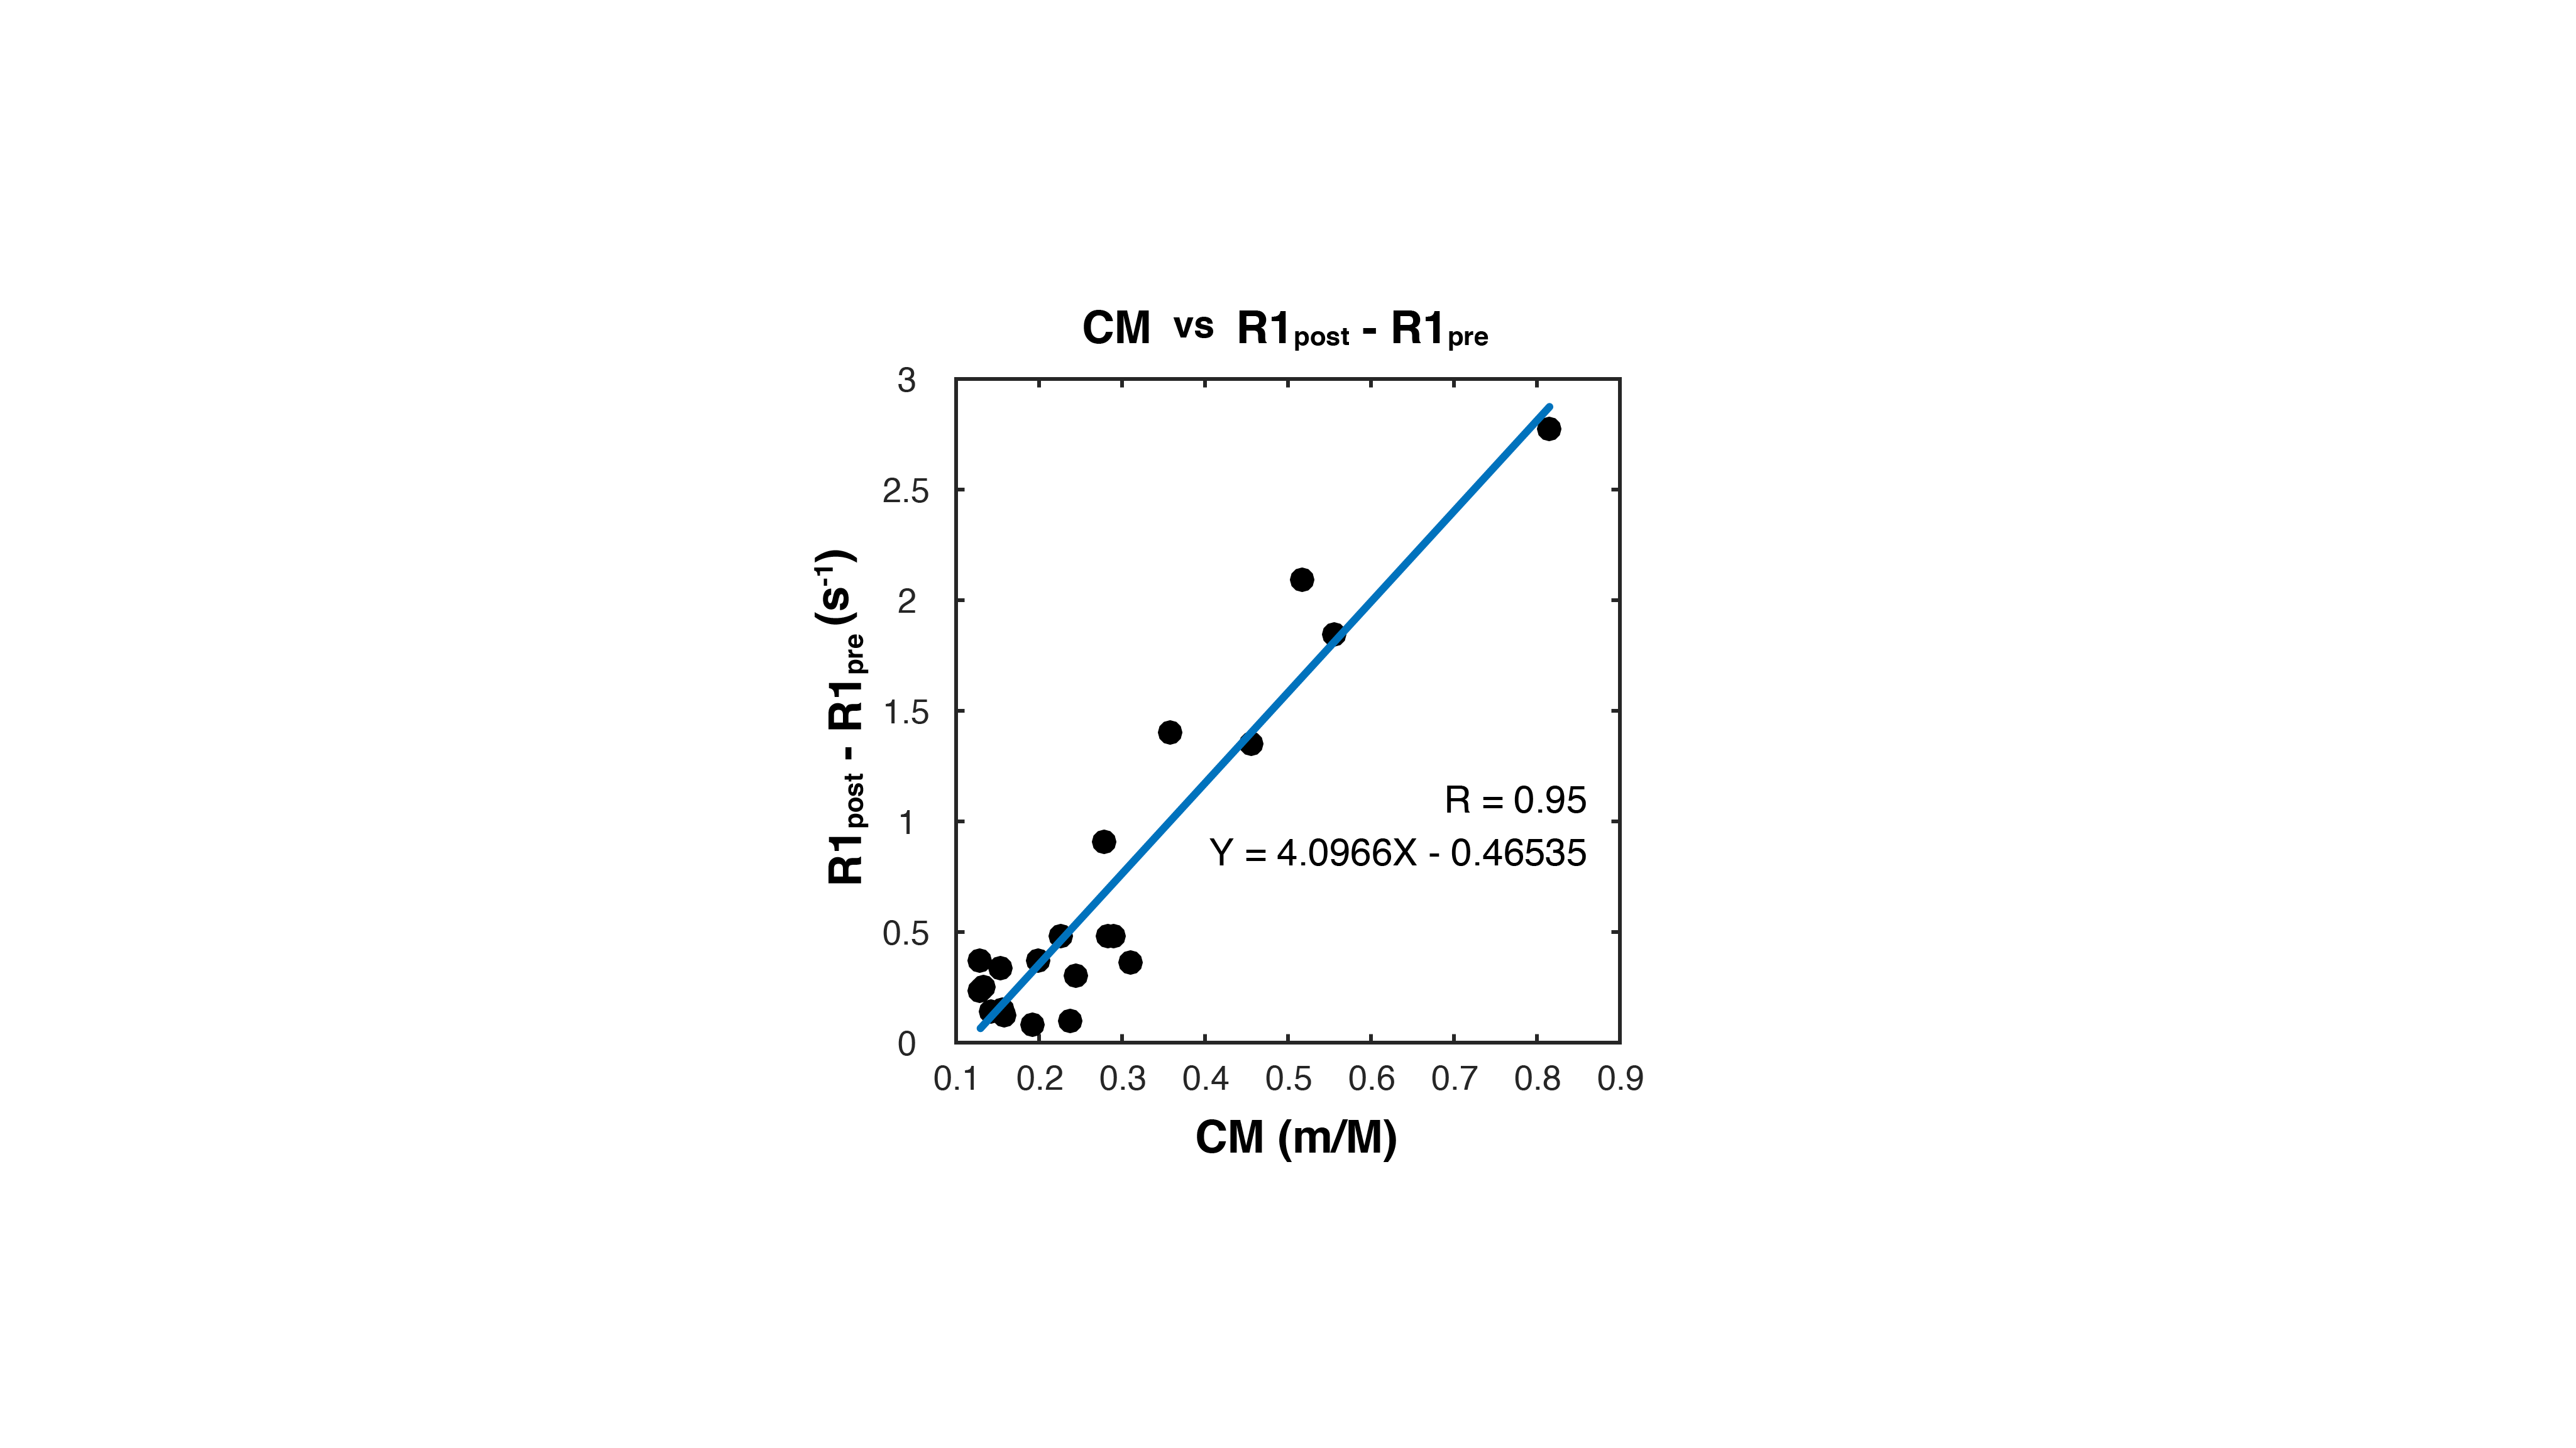
R1 map and susceptibility maps before and after injection of Gd-DTPA were calculated using quantitative parameter map technique. Then, concentration map (CM) of the Gd-DTPA was calculated using the susceptibility maps. A linear regression between CM and R1post -
Introduction & Purpose
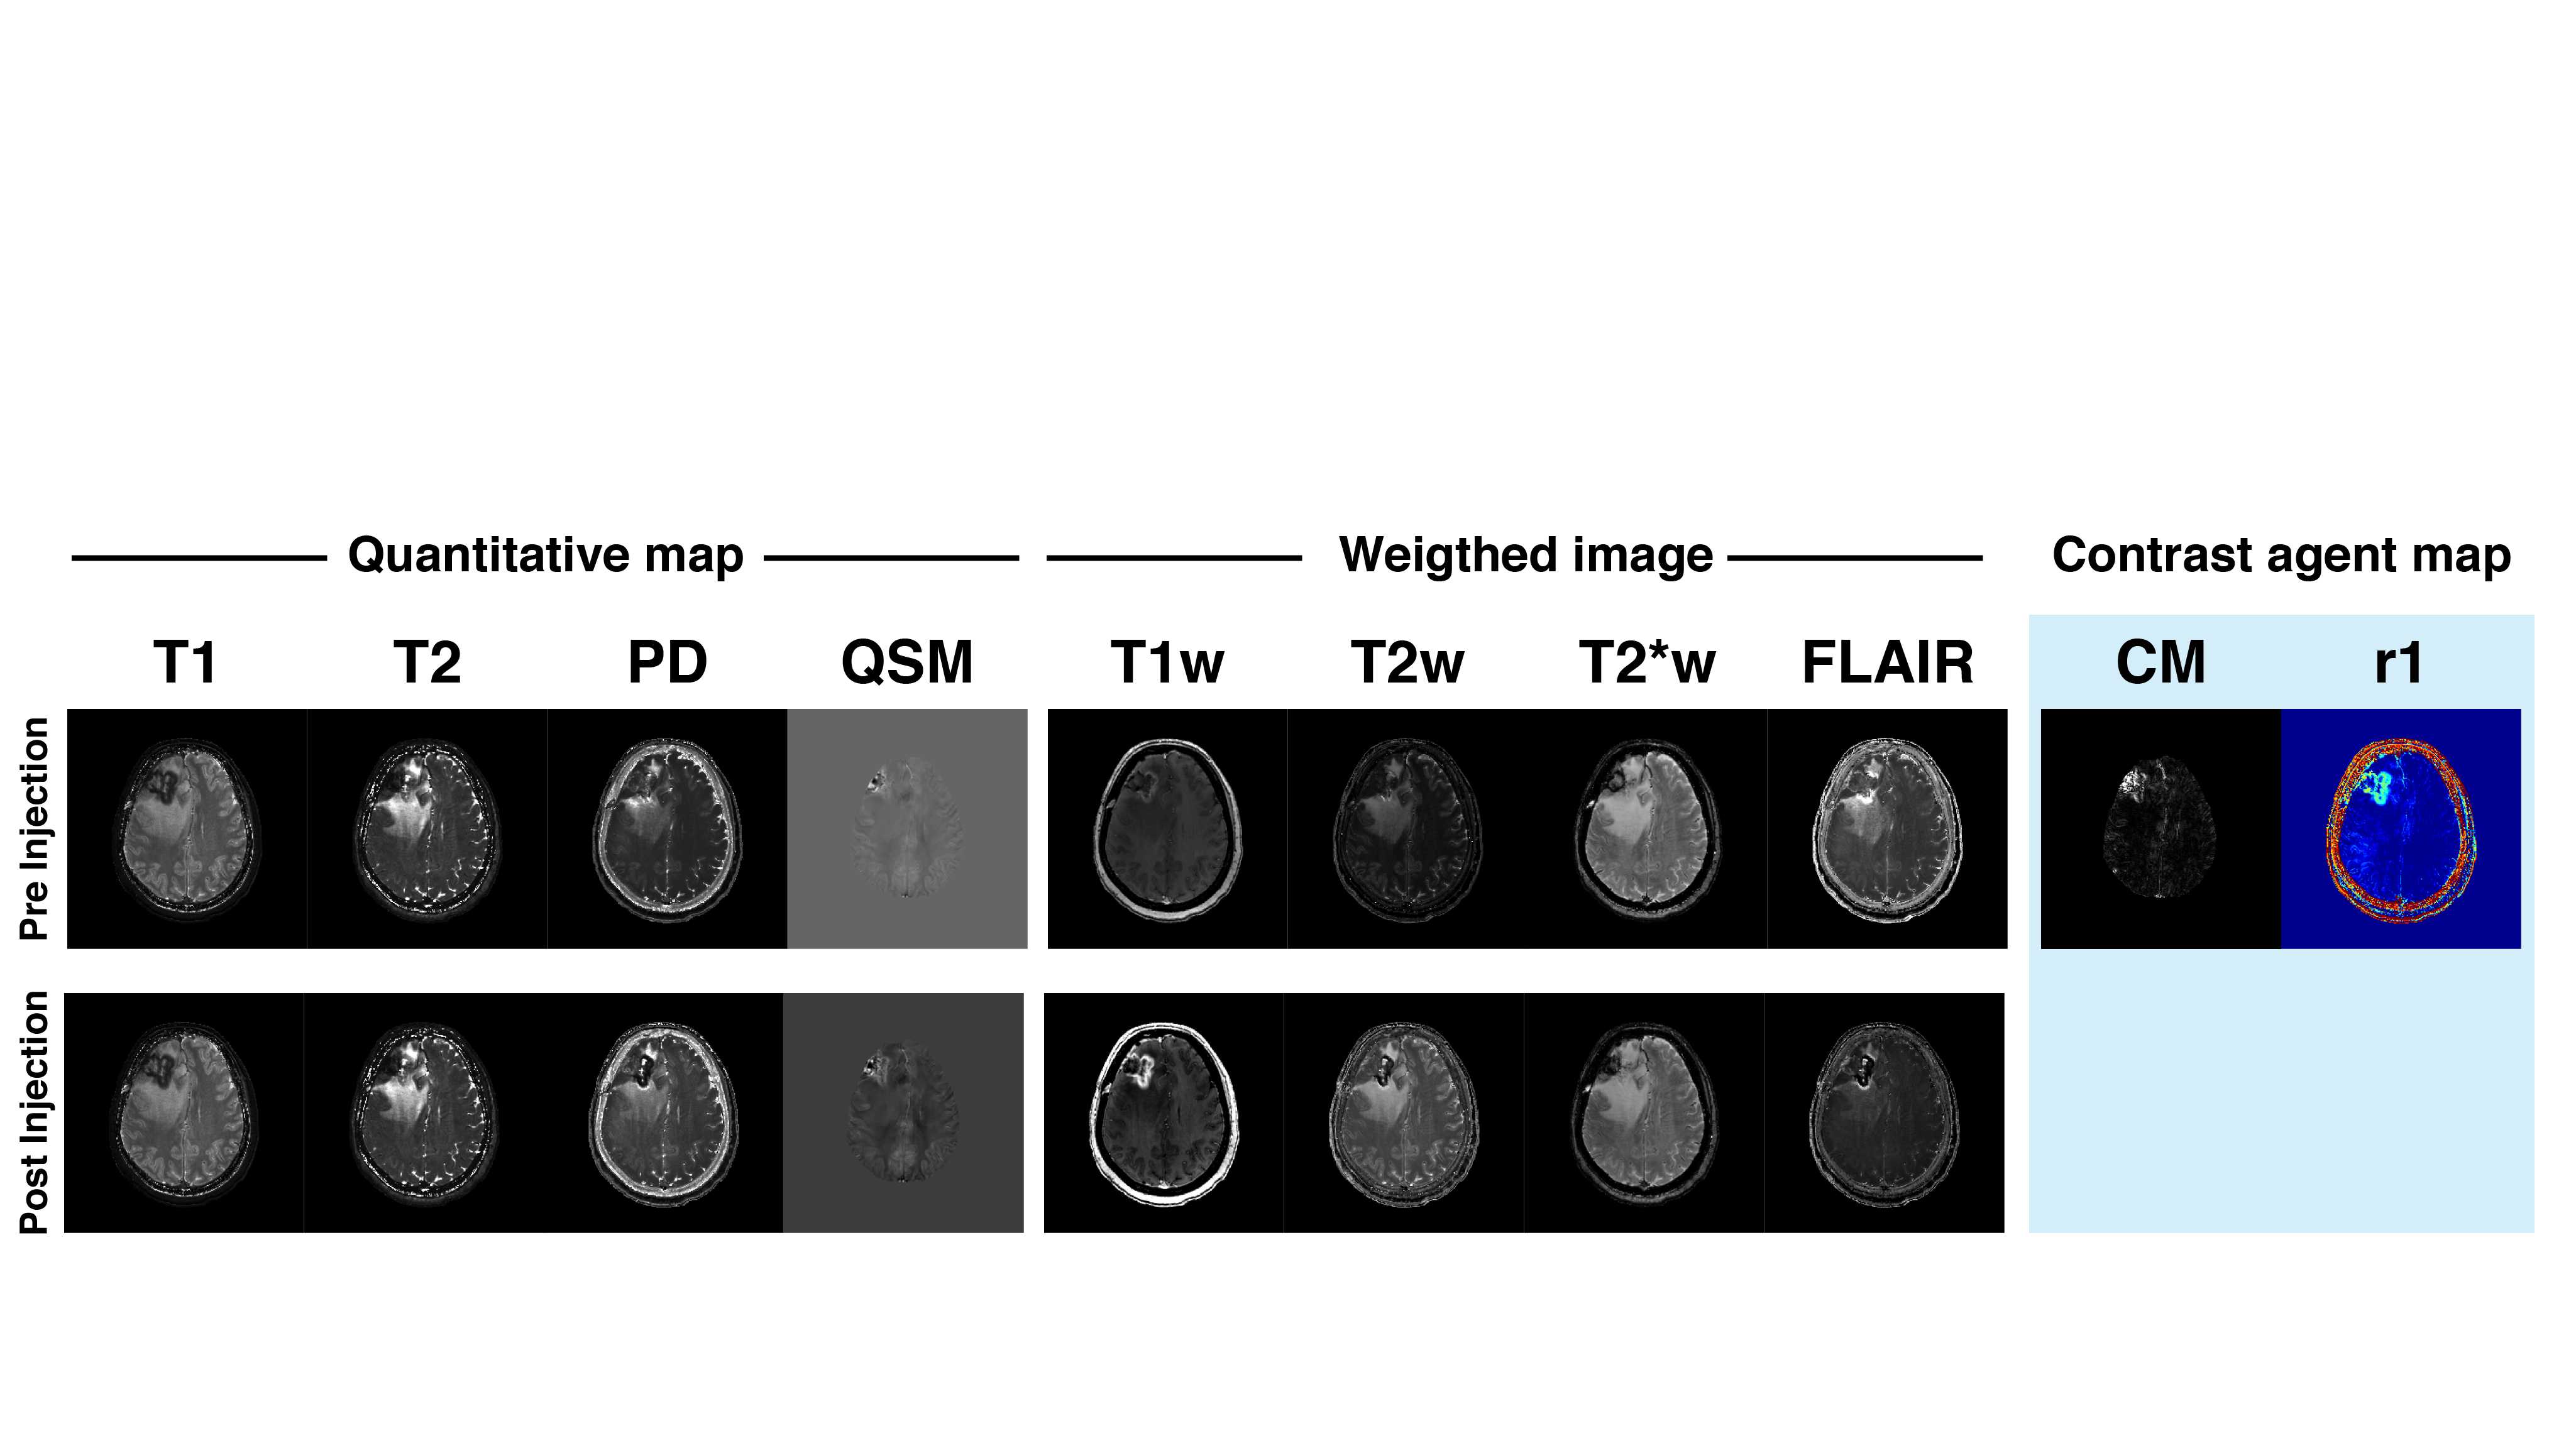
Quantitative multi-parameter mapping (MPM) is a quantitative calculation technique to simultaneously obtain MR images [1]. Additionally, Taniguchi Y, et al. have developed a quantitative parameter mapping (QPM) technique, which can yield quantitative maps of T1, T2*, and proton density (PD) [2]. This technique can be used to calculate weighted images of T1, T2, T2*, PD, and FLAIR. Moreover, QPM has the advantage that it can provide a quantitative susceptibility mapping (QSM). We focus on this technique and calculation of concentration map (CM) and molar relaxivity of Gd-DTPA (r1) was attempted by obtaining the parameter maps before and after injection for brain metastasis.Materials & Methods
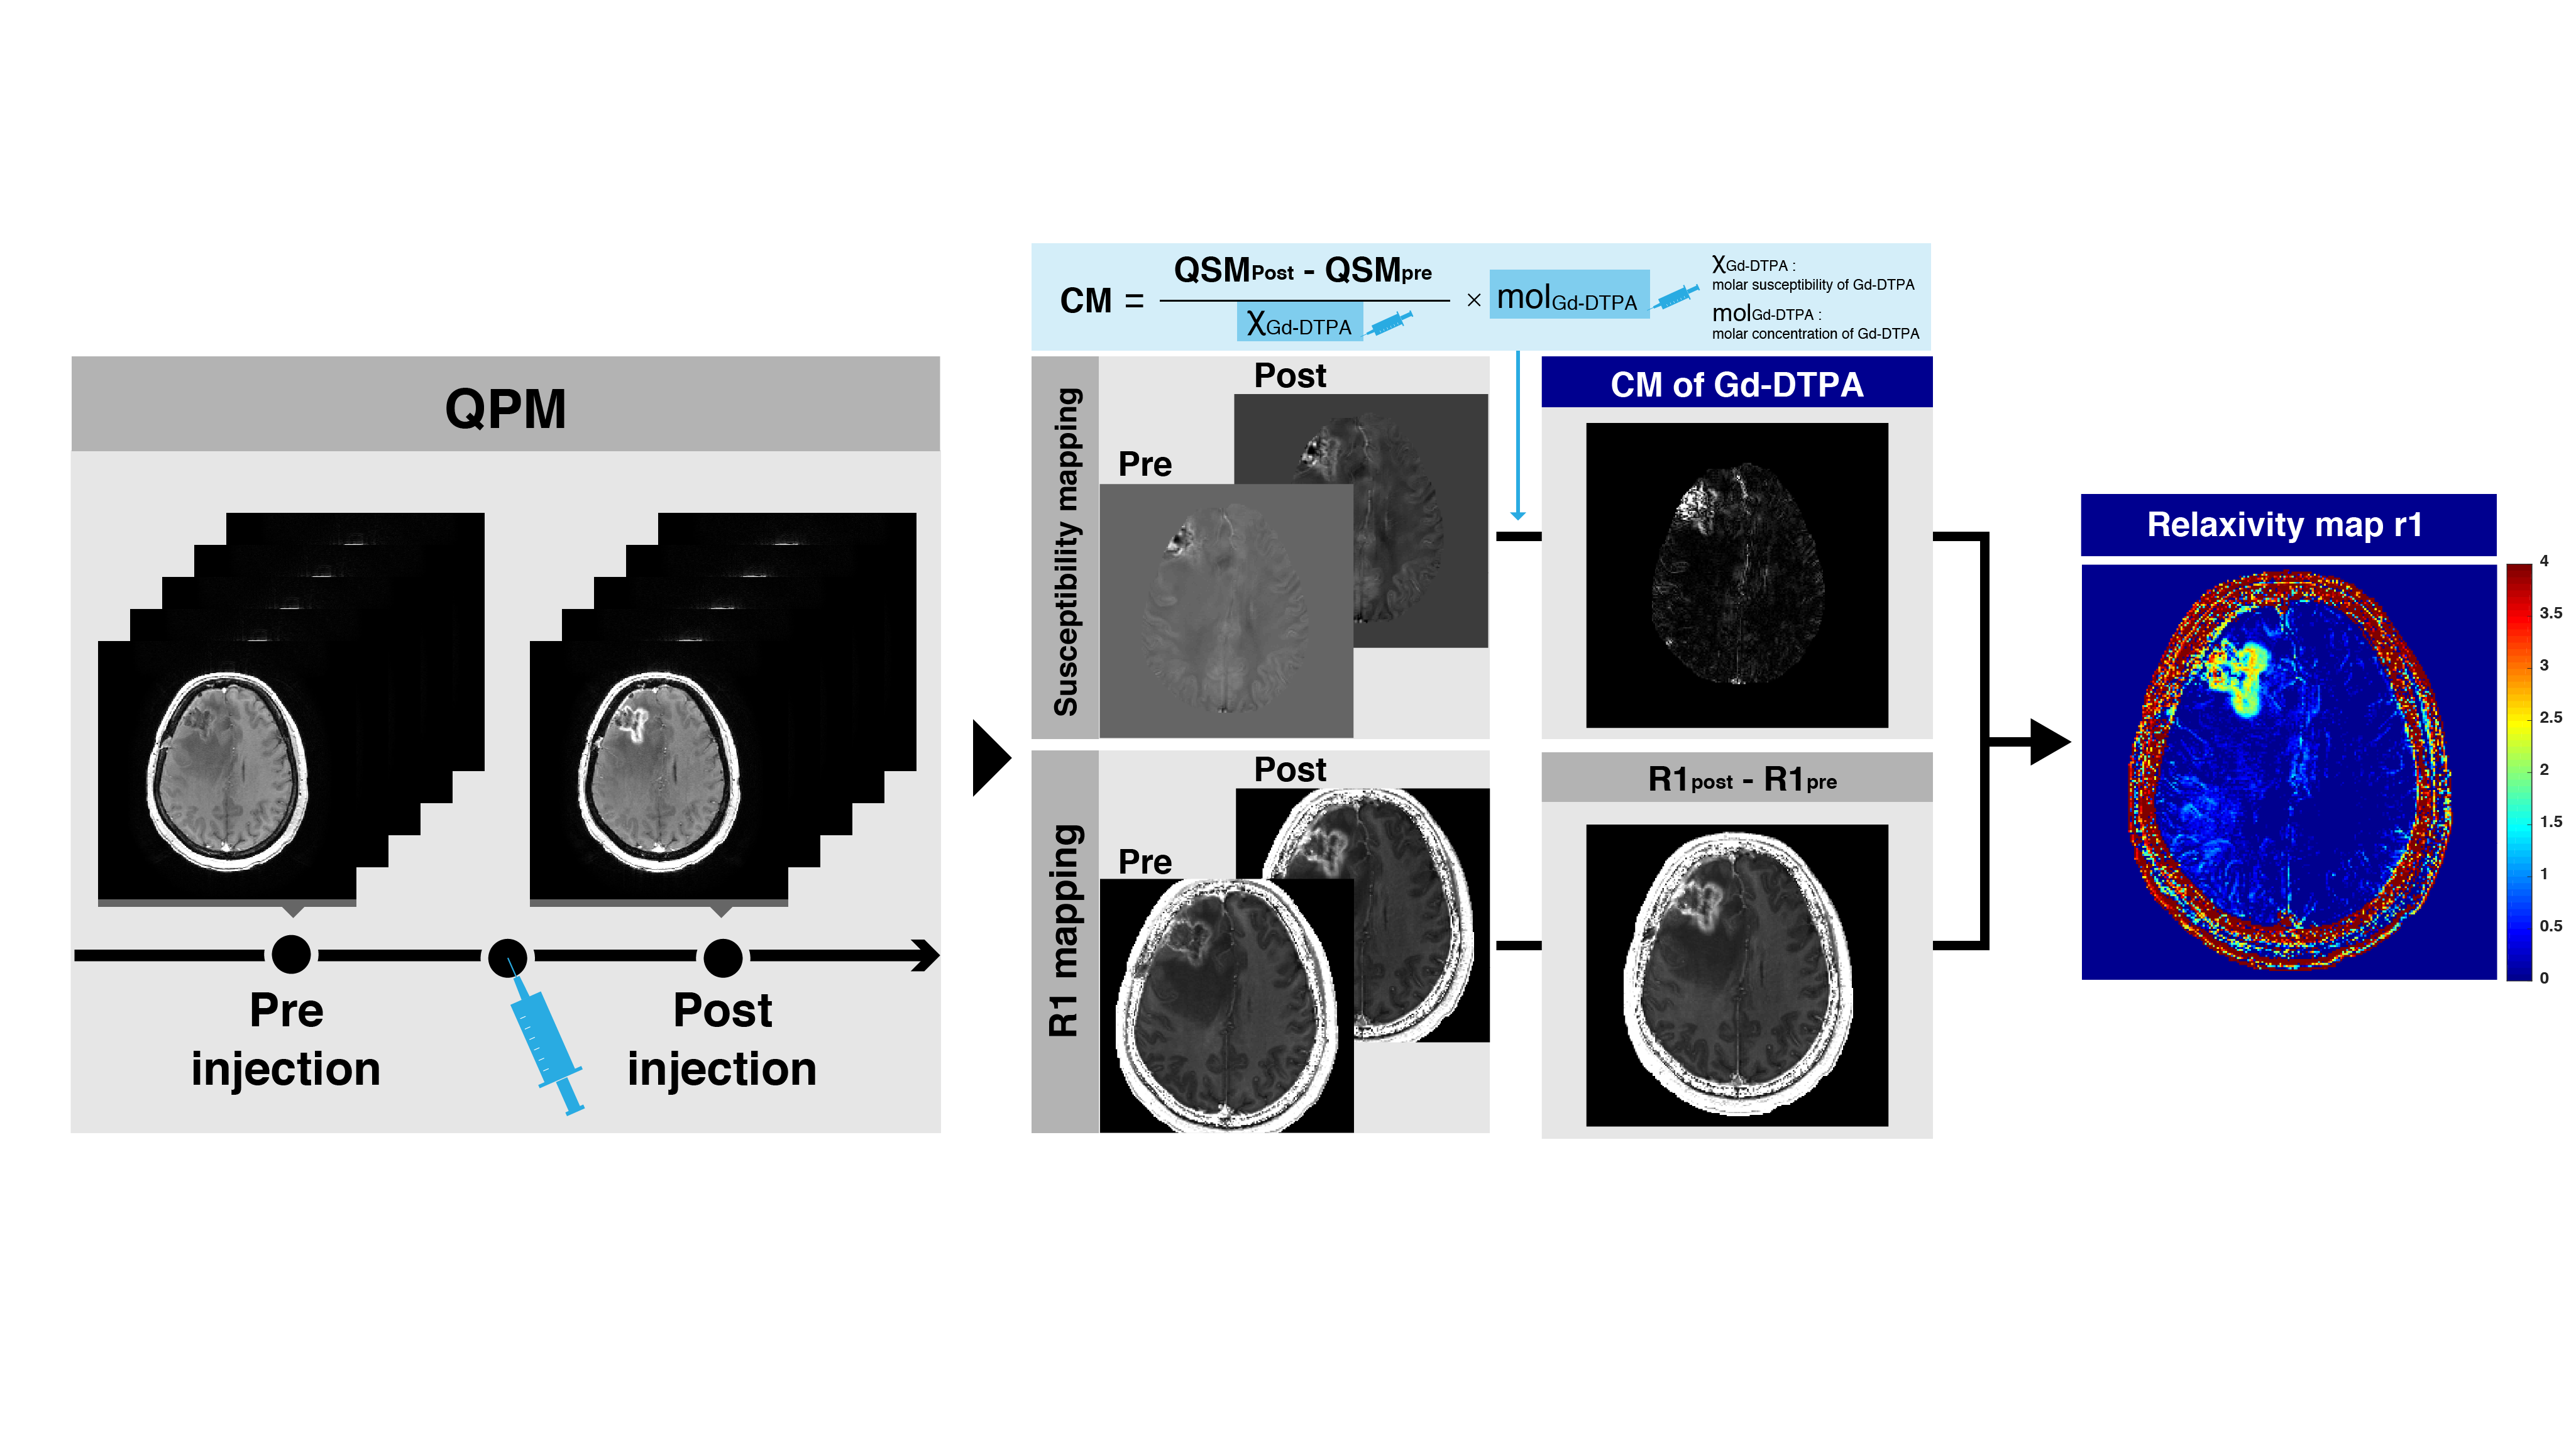
This study was approved by the local institutional review board. QPM was performed on five patients with brain metastasis. We obtained the parameter maps before and after injection of gadolinium-based contrast agents (ProHance®); all imaging data were acquired on a 3 T MR system (Hitachi, Ltd.). The imaging parameters for QPM were: echo time, 4.6–32.3 ms (5 echoes); inversion recovery time, 10–40 ms; field of view, 24 cm; matrix size, 256×256; slice thickness, 1 mm. After acquiring the imaging data, the R1 map and susceptibility maps before and after injection were calculated from T1 and QSM before and after injection. Then, the CM and r1 map were calculated using the following three steps (see Fig. 1).
1. Calculation of the CM of Gd-DTPA by using QSM.
At first, the subtraction map after injection and before injection of susceptibility maps was calculated and the CM of the Gd-DTPA was estimated according to Eq
$$CM\quad =\quad \frac { { QSM }_{ post }-{ QSM }_{ pre } }{ { \chi }_{ Gd } } \quad \times { \quad mol }_{ Gd }$$
where QSMpre and QSMpost are the susceptibility maps derived from the before and after injection, respectively. χGd is the molar susceptibility of the Gd-DTPA, and molGd is the molar concentration of the Gd-DTPA.
2. Comparison between CM and R1post - R1pre.
After calculation of the CM, the mean CM and R1post - R1pre values were obtained by drawing a region of interest (ROI), which was adapted to each metastasis area. A linear regression between CM and R1post - R1pre map was then performed.
3. Calculation of the molar relaxivity of Gd-DTPA from step1 and step2.
Finally, the r1 map was estimated from the results of the linear regression performed in step 2.
Results & Discussions
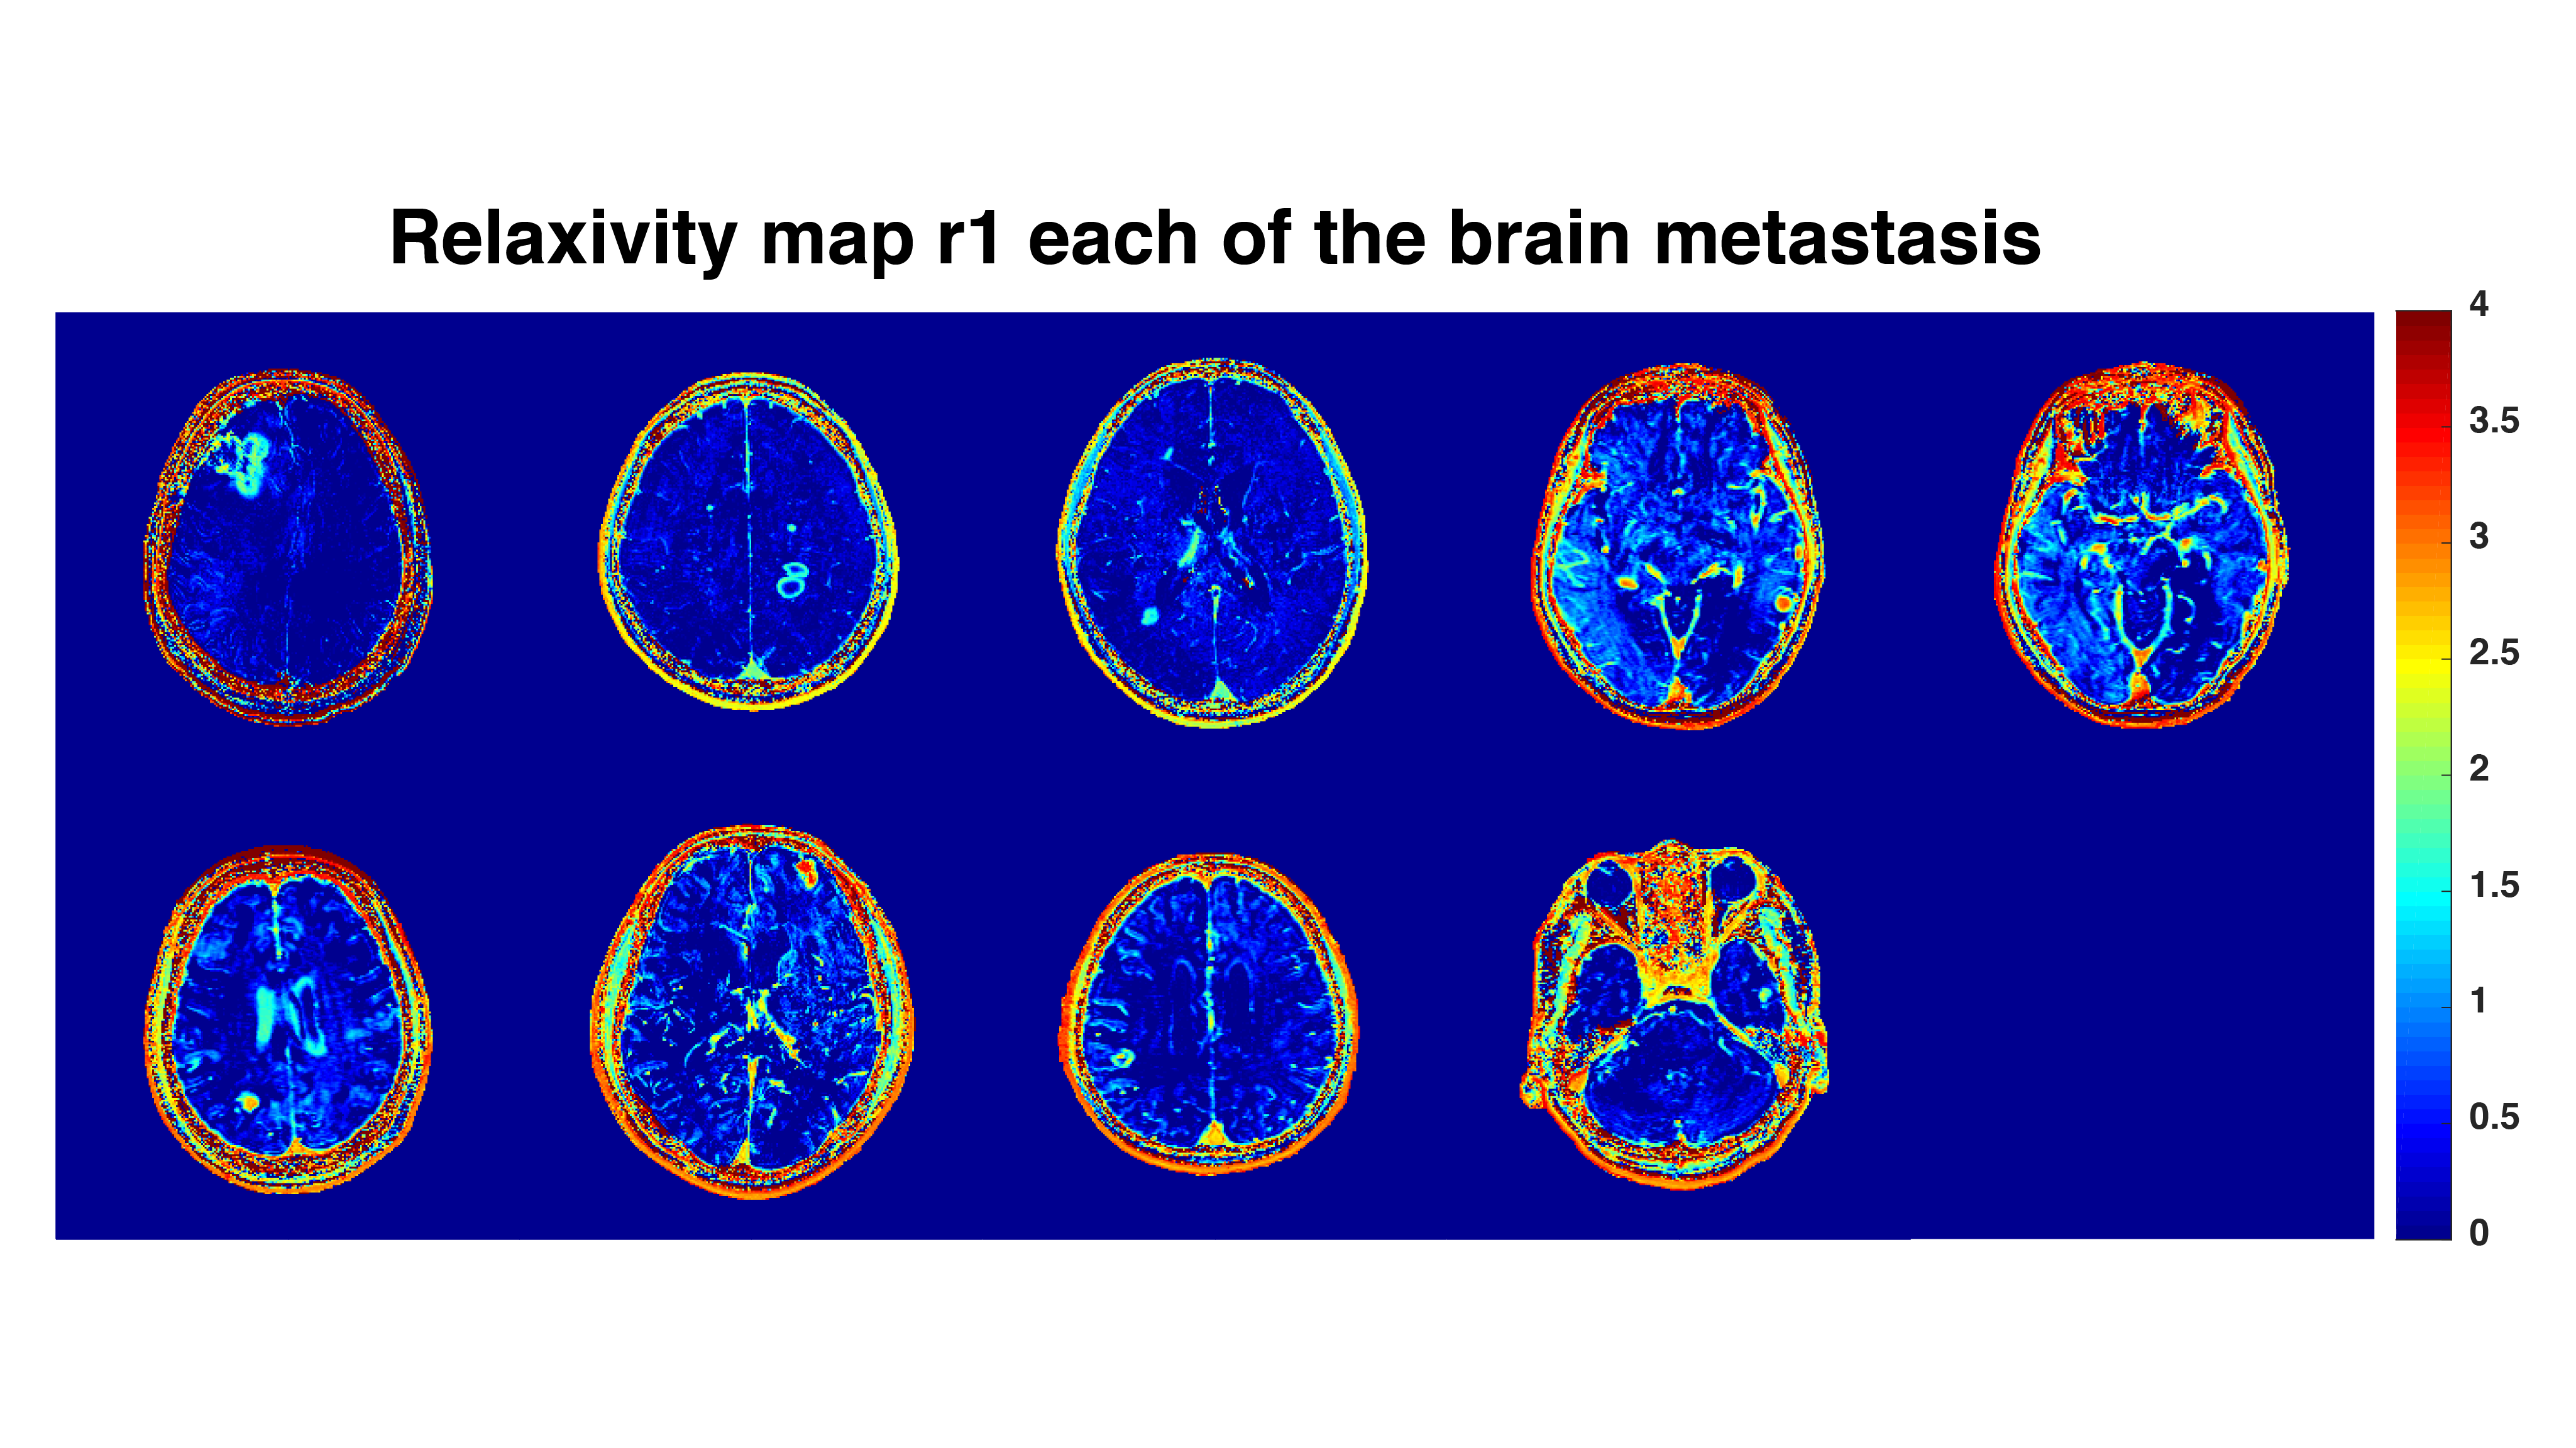
The comparison between the CM and R1pre-R1post map for each metastasis is shown in Fig. 2, demonstrating a strong correlation (y = 4.0966x - 0.46535, R = 0.95). A slope derived from the linear regression indicates relaxivity in the metastasis and it approximately matched the relaxivity of the ProHance in plasma at 3 T [3]. Moreover, Fig. 3 shows the molar relaxivity of the Gd-DTPA map derived from the result of the linear regression. The mean r1 value was increased in the brain metastasis area and brain vessel area, compared with other tissues. This means that our method can reflect the concentration and relaxivity of Gd-DTPA in the vessel. Our results demonstrated the capability of the r1 map derived from QPM before and after injection. While there are several methods for calculating the properties of the contrast media, methods using QPM have not yet been reported [4]. The QPM technique can simultaneously estimate several physical properties including the susceptibility map with short examination time, and thus a simple method for calculating contrast agent mapping is achieved (Fig. 4). The QPM protocol can be employed before and after injection to estimate biological properties reflecting the contrast media and therefore, this protocol might have an impact on the evaluation of a brain tumor.Conclusion
The molar relaxivity map derived from QPM before and after injection might render the ability to obtain unique information concerning brain tumors in the future.Acknowledgements
No acknowledgement found.References
[1] Weiskopf N, Suckling J, Williams G, Correia MM, Inkster B, Tait R, Ooi C, Bullmore ET, Lutti A. Quantitative multi-parameter mapping of R1, PD(*), MT, and R2(*) at 3T: a multi-center validation. Front Neurosci. 2013 Jun 10;7:95.
[2] Taniguchi Y, et al. Proceedings of ISMRM. 2018; 5630.
[3] Rohrer M, Bauer H, Mintorovitch J, Requardt M, Weinmann HJ. Comparison of magnetic properties of MRI contrast media solutions at different magnetic field strengths. Invest Radiol. 2005 Nov;40(11):715-24.
[4] Martinez GV, Zhang X, García-Martín ML, Morse DL, Woods M, Sherry AD, Gillies RJ. Imaging the extracellular pH of tumors by MRI after injection of a single cocktail of T1 and T2 contrast agents. NMR Biomed. 2011 Dec;24(10):1380-91.
Figures