4982
On the influence of two coexisting species of susceptibility-producing structures on the R2’ relaxation rate: the static dephasing regime and diffusion effects1Medical Physics in Radiology, German Cancer Research Center (DKFZ), Heidelberg, Germany, 2Faculty of Physics and Astronomy, Heidelberg University, Heidelberg, Germany
Synopsis
In this work, we examine the effect of two different species of susceptibility producing-structures within one voxel to deduce whether the relaxation rate is proportional to the sum of the absolute product between volume fraction and susceptibility value. Furthermore, the effect of diffusion on the R2’ relaxation rate beyond the static dephasing regime is analyzed.
Introduction
Recently, R2’ was proposed as an additional source of information in the processing pipeline of quantitative susceptibility mapping (QSM) to achieve a separation of positive and negative susceptibility sources within one voxel1. To put this theory on a solid foundation, numerical simulations were performed to validate and extend the relaxation theory of inhomogeneous tissue proposed by Yablonskiy and Haacke2,3 including diffusion effects for the case of two coexisting species of random susceptibility-producing structures within the same voxel.
Theory
In a gradient echo experiment, signal loss can be described through $$$S(TE)\propto e^{-R_2^*\cdot TE}$$$ , where TE represents the echo time and R2*=1/T2 + R2’. Here R2’ is the contribution to signal loss caused by local field inhomogeneities3. Putting a spherical object into a homogenous magnetic field will produce local field distortions given by a unit dipole response $$$b(r)=\Delta B=\frac{3\cdot\mu\cdot\cos^2\Theta-1}{r^3 }$$$ with μ=Δχ/4π·V·B0 where r is the position vector, θ is the angle between the B0 direction and r, Δχ is the susceptibility difference between the sphere and the background and V is the volume of the sphere. As derived by Yablonskiy and Haacke, the relaxation rate R2’ can be described as $$$R_2'=\frac{2\pi}{9\cdot\sqrt{3}}\cdot\eta\cdot\gamma\cdot\Delta\chi\cdot B_0$$$ , where η is the volume fraction of susceptibility-producing spheres. This formula was derived under the assumption of negligible diffusion effects and small volume fractions η (static dephasing regime, SDR).
Methods
We considered a simulation volume (1000×1000×1000 pixel) with embedded spherical susceptibility sources possessing susceptibilities χ+ and χ-. Numbers and radii of these perturbers were labeled with N+, N-, R+ and R-. Positive and negative spheres were distributed randomly across the entire simulation volume and were impenetrable for diffusive particles. Field maps b were calculated by convolving the susceptibility distribution with a three-dimensional unit dipole field.
For the simulation neglecting diffusion, the signal intensity at echo time TE was calculated as the sum of complex signals over the entire simulation volume V. The signal was calculated for the echo times TE=0:5:140 ms for different settings of N, R or χ. R2’ was determined by a mono exponential fit to the simulation data.
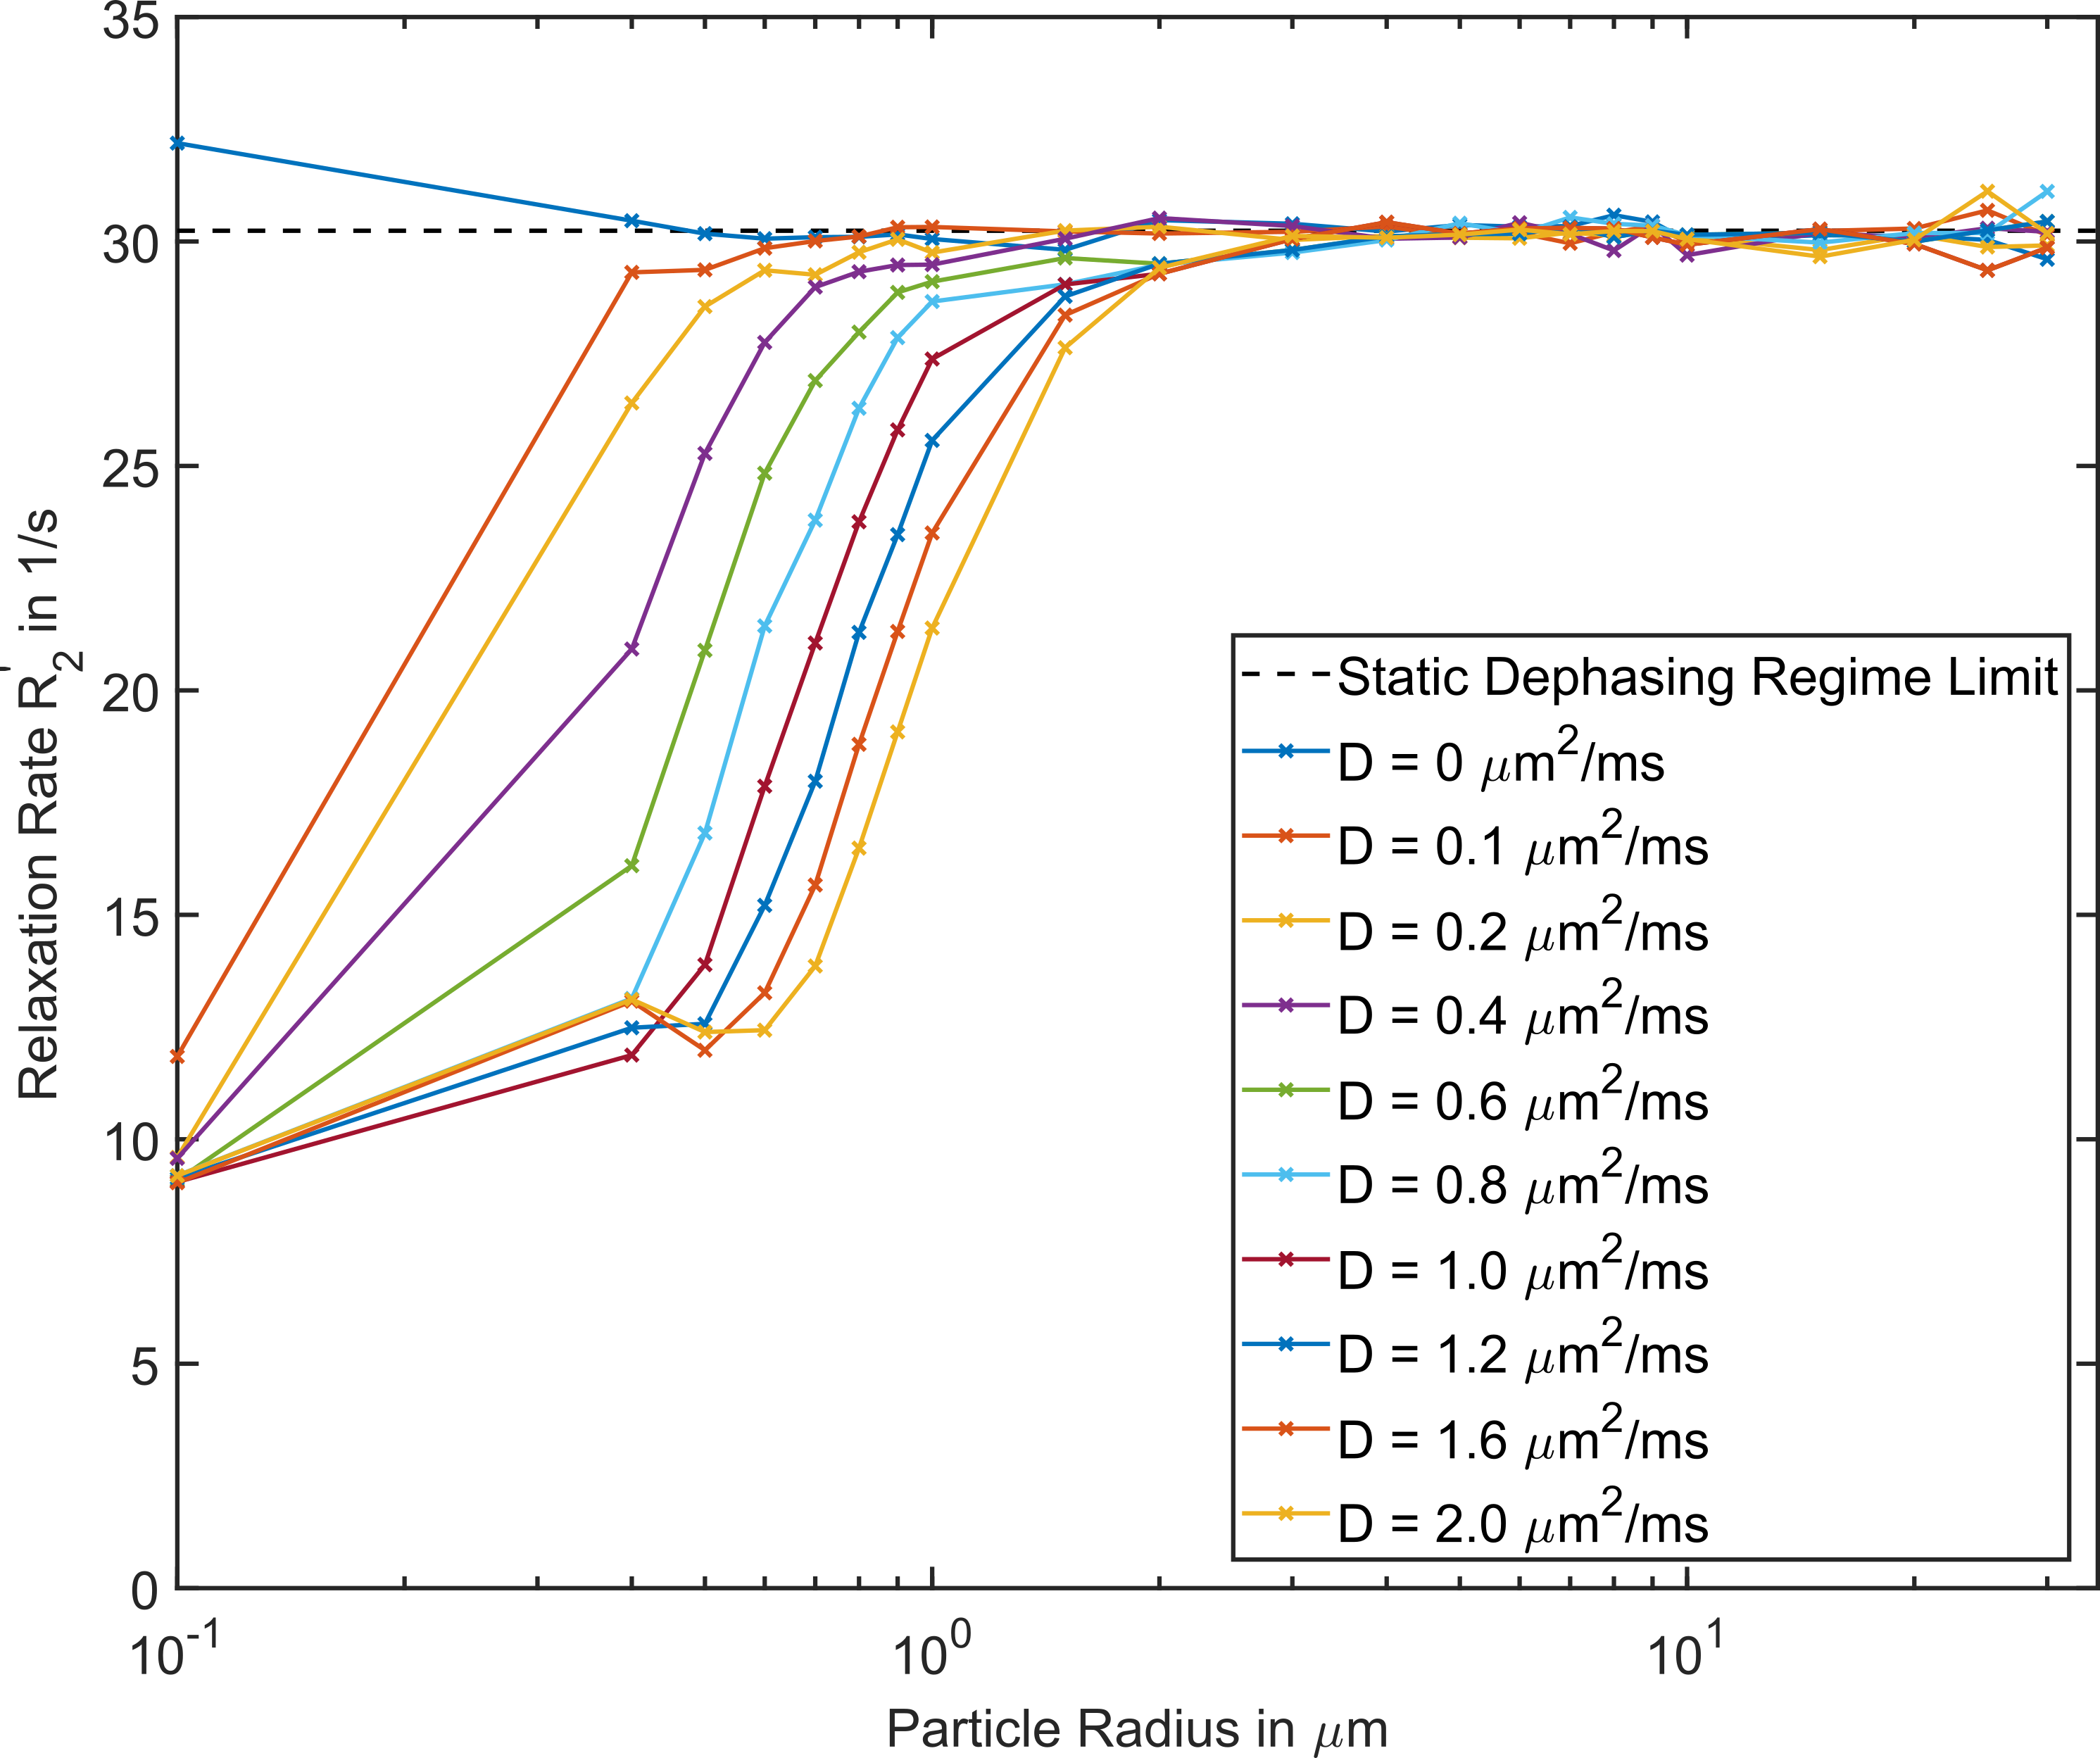
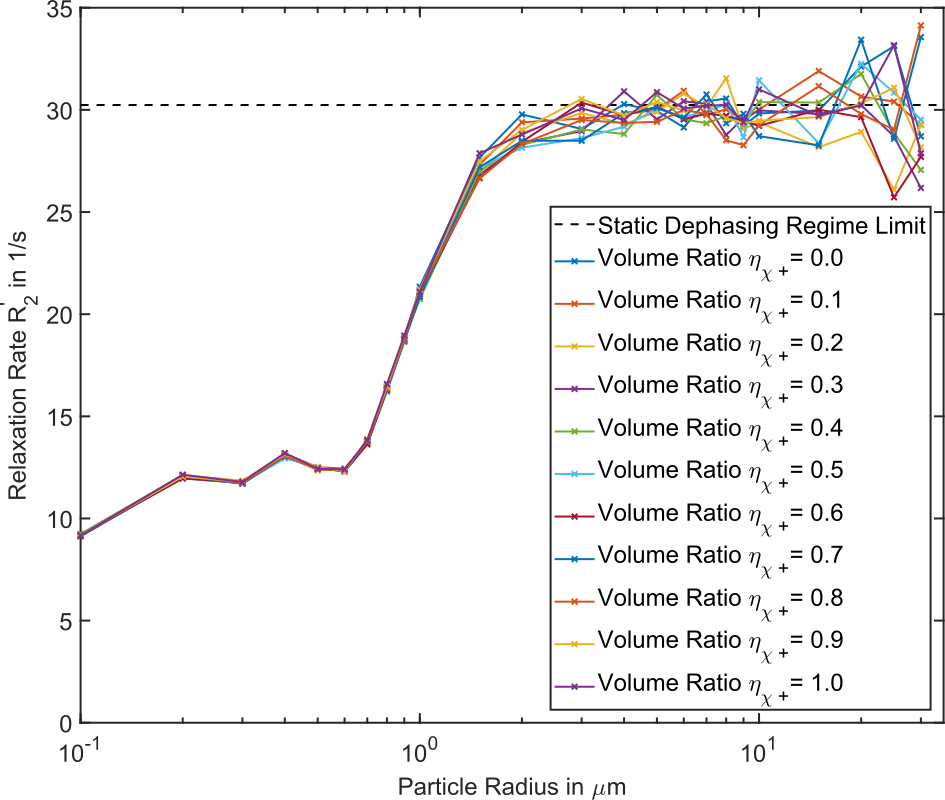
For the simulations including diffusion, the signal was calculated for TE=0:0.25:100 ms for N=150000 particles as the complex sum along their diffusion paths. In a first simulation, the diffusion constant D was varied in the range of D=0,...,2.0 μm²/ms for particle radii ranging from 0.1 μm to 30 μm (fixed volume fraction η=0.01 and Δχ± = ±4 ppm). In the second simulation, D was fixed and the ratio of positive and negative susceptibility sources was varied.
Results
Figure 1 exemplarily shows the susceptibility distribution of positive and negative spheres and the corresponding field distribution. Results for the simulation with varying susceptibility are shown in Figure 2 (solid lines). In the figure, the proportion of positive/negative susceptibility spheres increase/decrease linearly from left to right. Simulated relaxation rates incease linearly with the absolute susceptibility value of the spheres and they are independent from the proportion of positive and negative susceptibility within the simulated volume. In Figure 3 the radii of the spheres incease linearly, causing a cubic increase in volume fraction while background susceptibility and susceptibility of the spheres remained constant. The relaxation rate shows a cubic dependence on the radius of the spheres and therefore a linear dependence on the volume fraction.
Figure 4 shows the results for the simulation including diffusion effects. In the simulations, large deviations from the SDR limit for small particle sizes can be observed. The relaxation rate in the presence of diffusion converges towards the SDR limit for particle radii larger than r=0.5 μm for D=0.1 μm²/ms and r=3 μm for D=1.6 μm²/ms. In Figure 5, results for a constant absolute volume fraction (sum of positive and negative susceptibility sphere volume) are shown. There is no change in relaxation rate behavior when changing the ratio of positive and negative spheres within the simulation volume. In the limit of large particle radii (r>3 μm), the simulated relaxation rate again converges towards the SDR limit.
Discussion & Conclusion
It was shown that in the SDR as well as under the presence of diffusion effects the relaxation rate R2’ of a volume containing spherical susceptibility-producing structures of opposite sign depends solely on the overall absolute susceptibility content of the measurement volume. The diffusional motion can be seen as an averaging process when particles move through the inhomogenous field prodiced by the spheres. This effect will be promoted by either small spheres or large diffusion constants.
Pending the quantitative experimental validation of these findings, R2’ can become a valuable information source in the challenge of separating positive and negative susceptibility sources in QSM reconstruction.
Acknowledgements
No acknowledgement found.References
1. Lee, J., et al., Separating positive and negative susceptibility sources in QSM. Proc. Intl. Soc. Mag. Reson. Med. , 2017. 25: p. 0751.
2. Yablonskiy, D.A. and E.M. Haacke, Theory of NMR signal behavior in magnetically inhomogeneous tissues: the static dephasing regime. Magn Reson Med, 1994. 32(6): p. 749-63.
3. Brown, R.W., et al., Magnetic resonance imaging : physical principles and sequence design. Second edition ed. 2014, Hoboken, New Jersey: Wiley Blackwell.
Figures