4979
Blood oxygenation measurements in single vessels: lineshape measurements of the water signal1Radiology, German Cancer Research Center, Heidelberg, Germany, 2Neuroradiology, University Hospital Heidelberg, Heidelberg, Germany, 3Diagnostic and Interventional Radiology, University Hospital Wuerzburg, Wuerzburg, Germany, 4Neuroradiology, University Hospital Wuerzburg, Wuerzburg, Germany
Synopsis
In this work, the lineshape around a vessel inside a cubic voxel is analytically analyzed in dependence on the orientation of the voxel according to the external magnetic field. Results are validated with phantom measurements and in vivo measurements, that both agree very well with the developed theory. The analytical model therefore allows a determination of the oxygen extraction fraction from single voxel measurements around macroscopic vessels.
Introduction
The susceptibility difference between blood-filled vessels and surrounding tissue depends on the oxygenation level of the blood [1]. This so-called BOLD-effect is the basis of fMRI as well as quantitative determination of the oxygen extraction fraction. So far, the magnitude [2] or phase [3] information of gradient echo measurements were usually used to determine the oxygen extraction fraction of blood vessel networks with the statistical model of Yablonskiy and Haacke [4]. The quantitative analysis of the oxygen extraction fraction of a single macroscopic vessel, however, is more challenging, since the signal shows a more complex signal evolution than a monoexponential decay as numerically shown in [5,6]. In this work, we analyze the signal evolution around a single vessel in dependence on the voxel orientation, which was so far neglected in the literature. Time-resolved measurements of the free induction decay then allow determining the oxygen extraction fraction.Material and Methods
In MR imaging of a single cylindrical vessel with radius $$$R$$$, the susceptibility difference between the blood-filled vessel and the surrounding tissue $$$\Delta\chi=\chi_{do}\times\text{Hct}\times\text{OEF}$$$, that depends on the hematocrit $$$\text{Hct}$$$, the oxygen extraction fraction $$$\text{OEF}$$$ and the susceptibility difference between oxygenated and deoxygenated blood, $$$\chi_{do}=3.39\text{ppm}$$$, causes local magnetic dipole fields of the form:
$$\omega(r,\phi)=\delta\omega R^2\frac{\cos(2\phi)}{r^2},$$
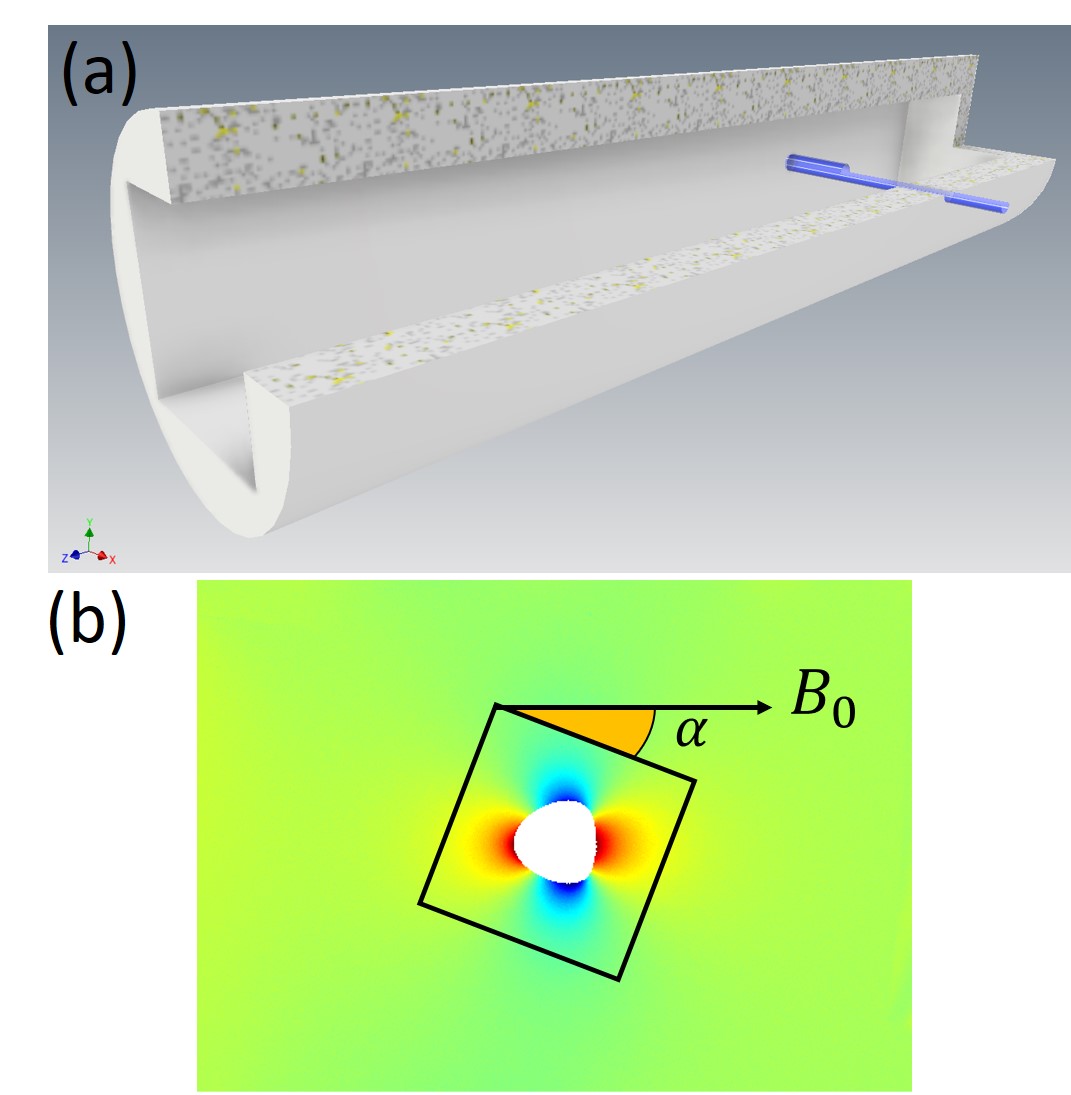
where $$$ \delta\omega =\gamma B_0\Delta\chi$$$ and $$$(r,\phi)$$$ is measured in polar coordinates. The lineshape $$$p(\omega)$$$ is given as the Fourier transform of the free induction decay $$$M(t)$$$ and can be obtained as histogram over the local magnetic field in the examined cubic voxel with sidelength $$$a$$$. A schematic image of a 3D printed phantom is shown in Fig. 1(a). The dipole field with the examined voxel is presented in Fig. 1(b). Obviously, the lineshape and the free induction decay depend on the angle $$$\alpha$$$ between voxel orientation and direction of the main magnetic field.
In this work, the lineshape was analytically analyzed in dependence on the voxel size and voxel orientation. These results were validated with phantom measurements. Experiments were conducted on a 7 T horizontal bore small animal scanner (Bruker Biospin, Ettlingen, Germany). Lineshapes were obtained as histograms of field maps (2D FLASH with TE = 5.8/6.8ms, TR = 100ms, FA = 30°, MTX = 1024 × 512, in plane resolution: 50μm× 50μm, bandwidth 150 Hz per pixel, slice thickness 3mm, NA = 64) as well as single voxel spectroscopic measurements (semiLASER [7] with TR = 2500ms, TE = 30ms, bandwidth 4 kHz, spectral resolution 2Hz, a = 6.8mm). Moreover, the results are compared with in vivo measurements of thalamostriate vein shown in [6].
Results
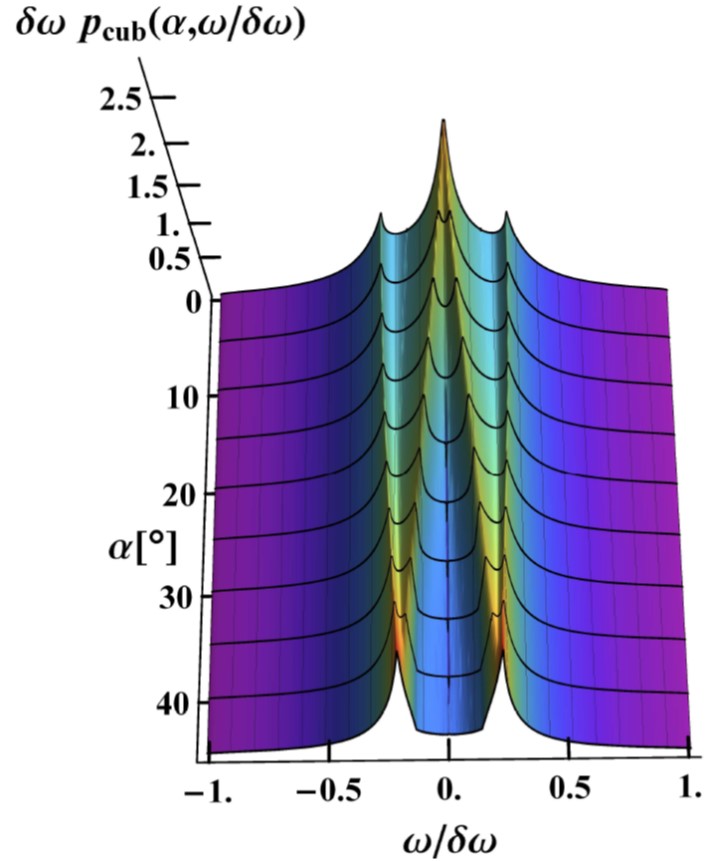
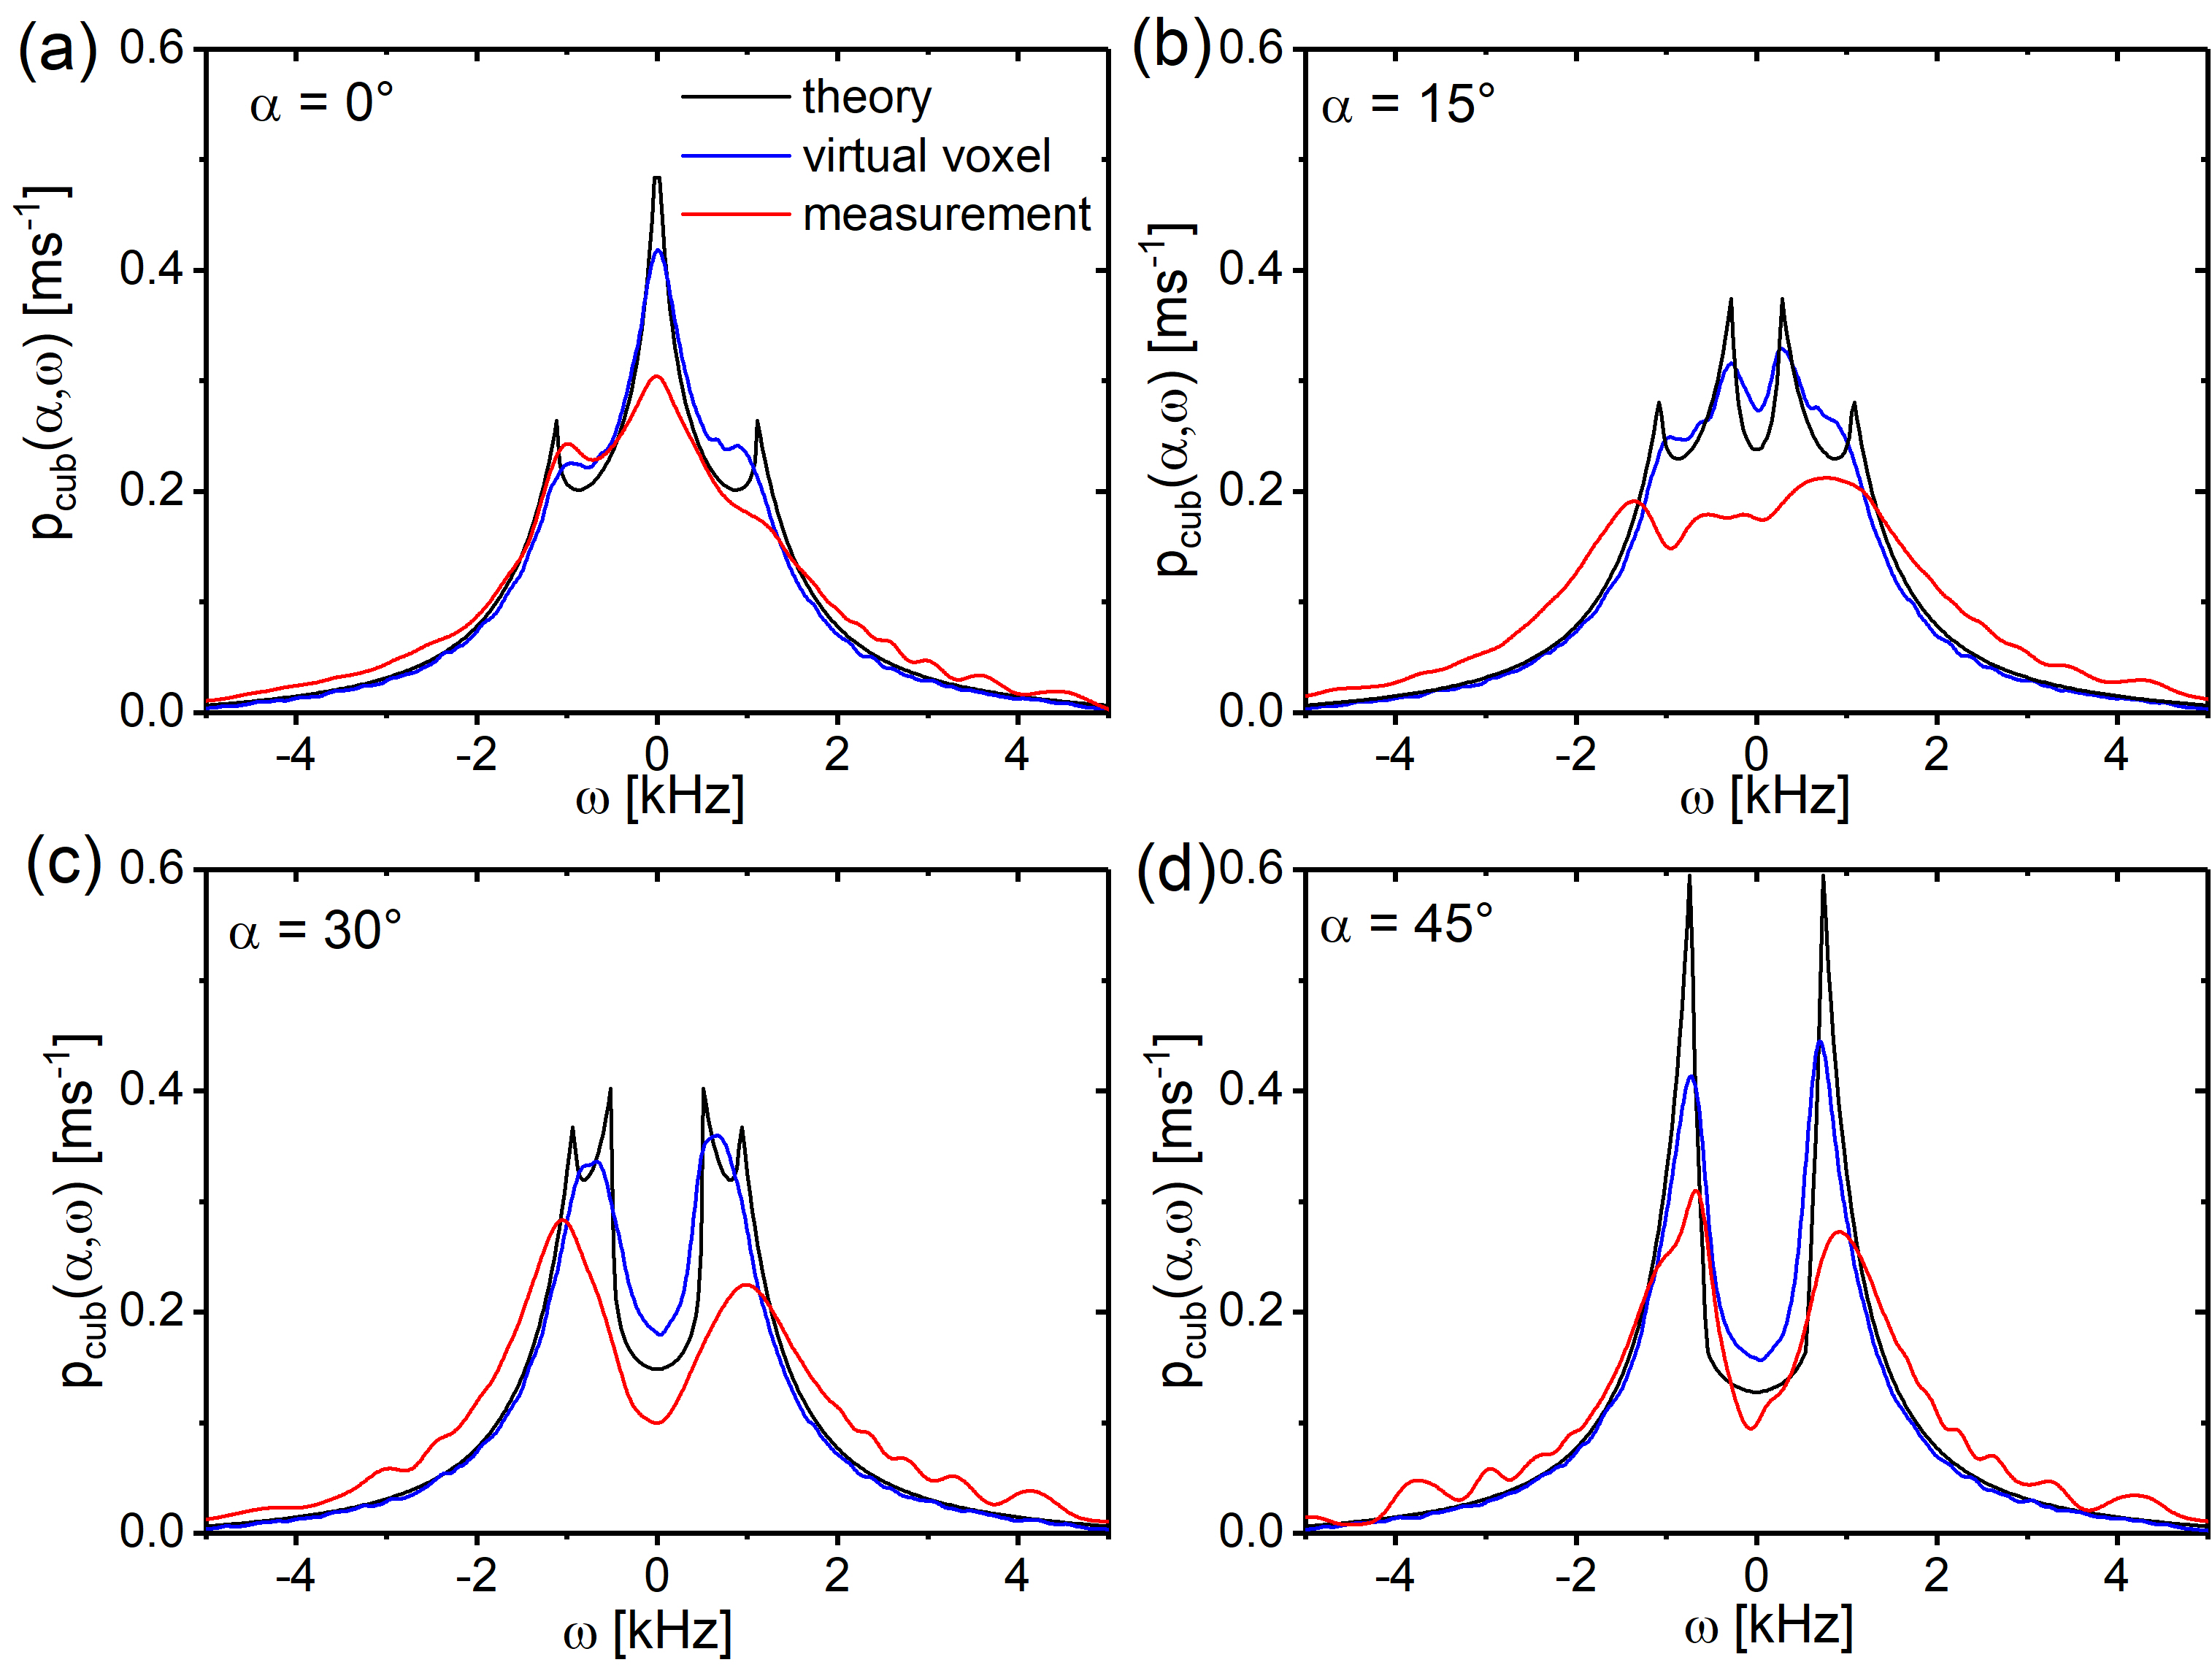
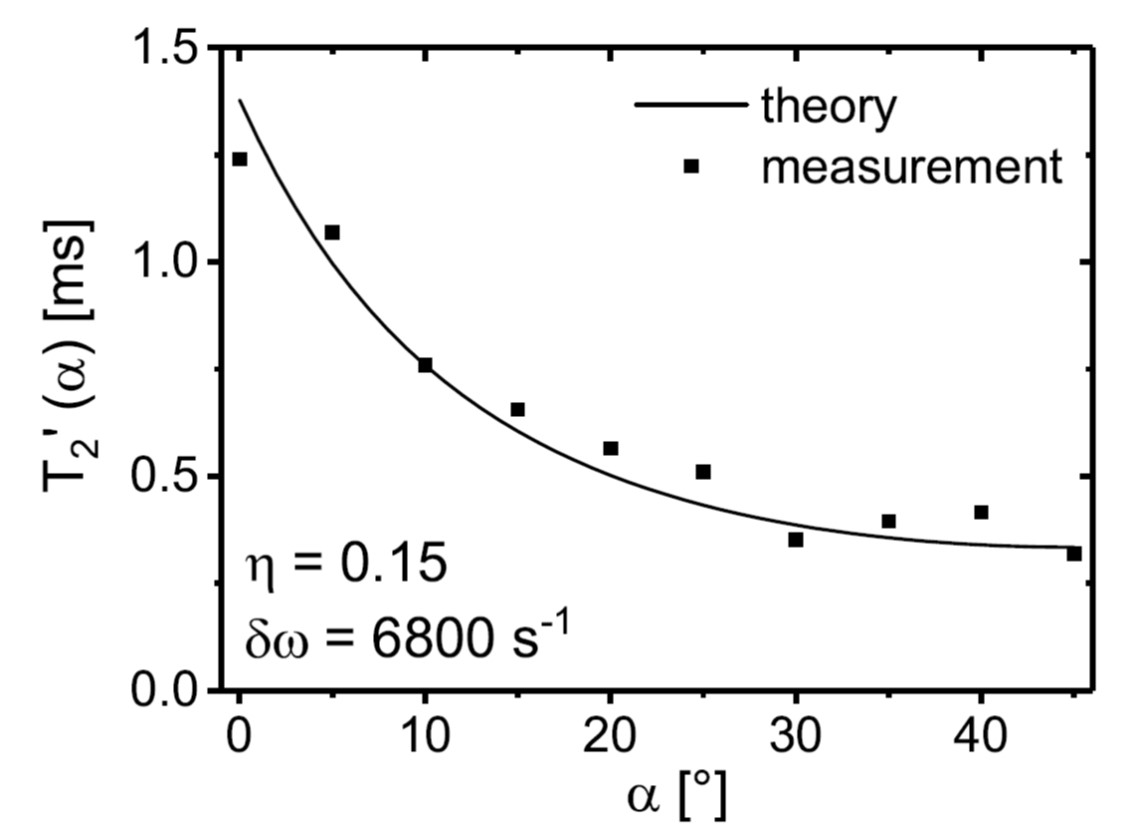
The theoretical lineshape in dependence on the voxel orientation $$$\alpha$$$ is shown in Fig. 2. In the limit $$$\alpha=0°$$$, the lineshape exhibits three peaks in agreement with numerical simulations [5,6]. However, the peak structure significantly changes with increasing angle $$$\alpha$$$. These changes are confirmed in our phantom experiment shown in Fig. 3: the comparison of the analytically derived lineshape with a lineshape based on the field map (blue lines) and with the experimentally measured lineshape using a semiLASER-sequence (red lines) validates the determined peak structure. This is associated with a change of relaxation time $$$T_2^\prime$$$ that can be obtained from a monoexponential approximation of the free induction decay, see Fig. 4.
The susceptibility difference between an air-filled glass capillary and a water-filled phantom as found in [8] suggests a dipole field strength of $$$\delta\omega=5300\text{s}^{-1}$$$, which agrees with the results of the measured field map of $$$\delta\omega=5500\text{s}^{-1}$$$. Measuring the peak positions for $$$\alpha=45°$$$, one obtains a dipole field strength of $$$\delta\omega=6000\text{s}^{-1}$$$, whereas the dipole field strength $$$\delta\omega=6800\text{s}^{-1}$$$ is overestimated for a simple fit of the relaxation times as shown in Fig. 4.
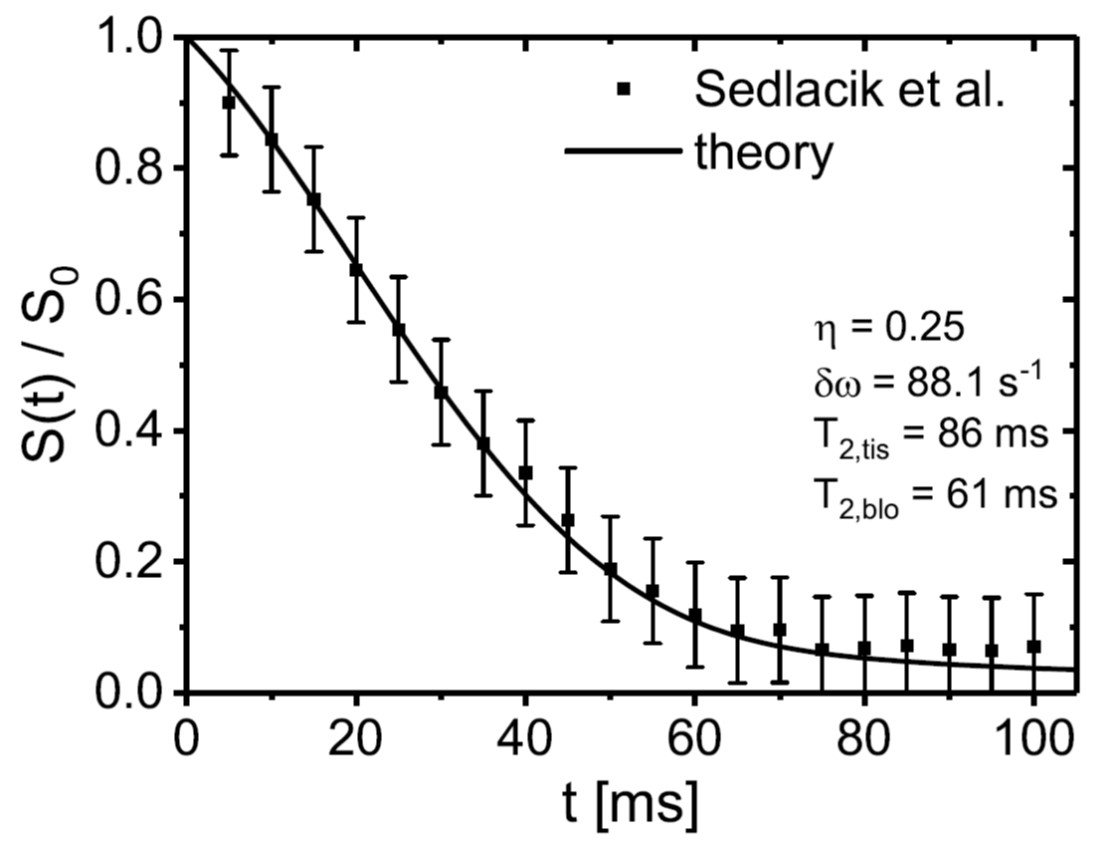
Our theoretical results are compared with in vivo measurements of Sedlacik et al. [5,6] and show a very good agreement, especially since no parameters were fitted, see Fig. 5.
Discussion and Conclusion
In this work, the lineshape of a single macroscopic vessel in a cubic voxel was analyzed. In contrast to previous literature, the dependence of the lineshape on the voxel orientation was investigated. The theoretical results were validated with phantom measurements and compared with in vivo measurements. Our work shows that the peak structure of the lineshape is most prominent for the angle $$$\alpha = 45°$$$. This goes along with the smallest relaxation time $$$T_2^\prime$$$. Moreover, phantom measurements suggest that the distance between the peaks is a robust method to determine the dipole field strength and, therefore, the oxygen extraction ratio. Finally, measurements of the peak structure of the lineshape for $$$\alpha=45°$$$ are a promising method to determine the oxygen extraction fraction around a single vessel.Acknowledgements
Helpful discussions with Jan Sedlacik and Simon Triphan are gratefully acknowledged. This work was supported by grants from the Deutsche Forschungsgemeinschaft (Contract Grant number: DFG ZI 1295/2-1 and DFG KU 3555/1-1). L. R. Buschle was supported by Studienstiftung des deutschen Volkes.References
[1] S. Ogawa, T. M. Lee, A. R. Kay, and D. W. Tank. Brain magnetic resonance imaging withcontrast dependent on blood oxygenation. Proc Natl Acad Sci USA, 87:9868–9872, 1990.
[2] S. Domsch, M. B. Mie, F. Wenz, and L. R. Schad. Non-invasive
multiparametric qBOLD approach for robust mapping of the oxygen
extraction fraction. Z Med Phys, 24(3):231–242, 2014.
[3] A. P. Fan, B. Bilgic, L. Gagnon, T. Witzel, H. Bhat, B. R. Rosen, and E. Adalsteinsson. Quantitative oxygenation venography from MRI phase. Magn Reson Med, 72(1):149–159, 2014.
[4] D.A. Yablonskiy, E.M. Haacke. Theory of NMR signal behavior in magnetically inhomogeneous tissues: the static dephasing regime, Magn Reson Med 32:749–763, 1994.
[5] J. Sedlacik, A. Rauscher, and J. R. Reichenbach. Obtaining blood oxygenation levels from MR signal behavior in the presence of single venous vessels. Magn Reson Med, 58(5):1035–1044, 2007.
[6] J. Sedlacik, A. Rauscher, and J. R. Reichenbach. Quantification of modulated blood oxygenation levels in single cerebral veins by investigating their MR signal decay. Z Med Phys,19(1):48–57, 2009.
[7] T.W.J. Scheenen, D.W.J. Klomp, J.P. Wijnen, A. Heerschap, Short echo time 1H-MRSI of the human brain at 3T with minimal chemical shift displacement errors using adiabatic refocusing pulses, Magn Reson Med 59:1–6, 2008.
[8] Schenck JF. The role of magnetic susceptibility in magnetic resonance imaging: MRI magnetic compatibility of the first and second kinds. Med Phys, 23(6):815–50, 1996.
Figures