4978
Oxygen Saturation Dependent Effects on Blood Transverse Relaxation at Low Fields1School of Chemical and Physical Sciences, Victoria University of Wellington, Wellington, New Zealand, 2School of Engineering and Computer Science, Victoria University of Wellington, Wellington, New Zealand, 3Sunnybrook Health Sciences Centre, University of Toronto, Toronto, ON, Canada, 4Centre for Translational Physiology, University of Otago, Wellington, New Zealand, 5Department of Surgery and Anaesthesia, University of Otago, Wellington, New Zealand, 6Department of Paediatrics and Child Health, University of Otago, Wellington, New Zealand, 7Robinson Research Institute, Victoria University of Wellington, Wellington, New Zealand
Synopsis
The change in T2 due to the oxygen saturation sO2 in blood has been well
Introduction
The T2 of blood is linked to its oxygen saturation, creating a very useful intrinsic contrast mechanism. This relaxation effect is caused by the conversion of oxy- to deoxy-haemoglobin inside red blood cells, which produces stronger magnetic field inhomogeneities and thus higher rates of dephasing. As they are generated by variations in susceptibility, the strength of the inhomogeneities is also dependent on B0. In the literature, this effect has been described using a variant of the Luz-Meiboom equation1–3.
$$\frac{1}{T_2} = \frac{1}{T_{2_0}} + \gamma^2 K_0 \tau_{ex} (1-\frac{2\tau_{ex}}{\tau_{180}} \tanh(\frac{\tau_{180}}{2\tau_{ex}})){\quad\quad}(1)$$
where T2o is the intrinsic blood T2, $$$\tau_{ex}$$$ is the average exchange time, $$$\tau_{180}$$$ is the refocusing interval and K0 is the variance of the magnetic field inhomogeneity due to changes in sO2 (see equation 2). This relaxation effect has been well characterised at field strengths used for clinical imaging3–6, and T2 measurements have been used to quantify changes in oxygen saturation in-vivo7,8. The development of low field portable magnetic resonance systems presents new opportunities for leveraging this MRI contrast. However, previous studies of this contrast at lower fields have been limited to extreme levels of oxygenation/ deoxygenation2,9,10.
Method
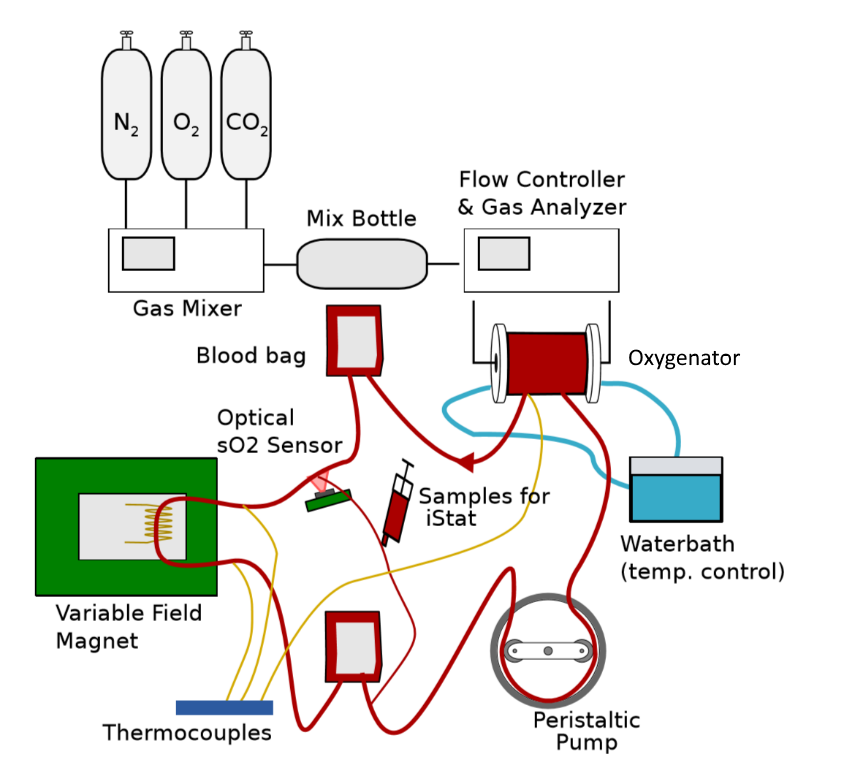
In this study, the T2 of blood is measured as it circulates around a benchtop setup of a cardiopulmonary bypass circuit, shown in Figure 1. An oxygenation membrane provides dynamic control of the oxygen saturation and other physiological parameters of the blood. By altering the gas mix fed into the membrane, the circuit can produce a slow ramp of increasing or decreasing oxygen saturation. This is continuously tracked by an optical sensor (MAX30102), so that the sensitivity of the relaxation effect to small changes in oxygen saturation can be tested.
A cryogen-free superconducting variable field magnet (Cryogenic Ltd, London UK ) with custom built RF coils was used to perform measurements at 5 fields strengths between 0.12-1 T, with T2 tracked using the CPMG experiment. Additionally, the effect of 5 different refocusing intervals (time between refocusing pulses, $$$\tau_{180}$$$) on the observed relaxation rate was tested, and compared to current literature.
Whole human blood was collected from healthy volunteers by venipuncture of the ante-cubital vein (approved by ethics committee). These were collected into standard 475ml CPD (Haemonetics, Braintree, MA) anticoagulant bags and stored at 4oC for no more than 10 days before experiments. This meant the haematocrit was around 0.34 which is slightly lower than average in-vivo.
Results
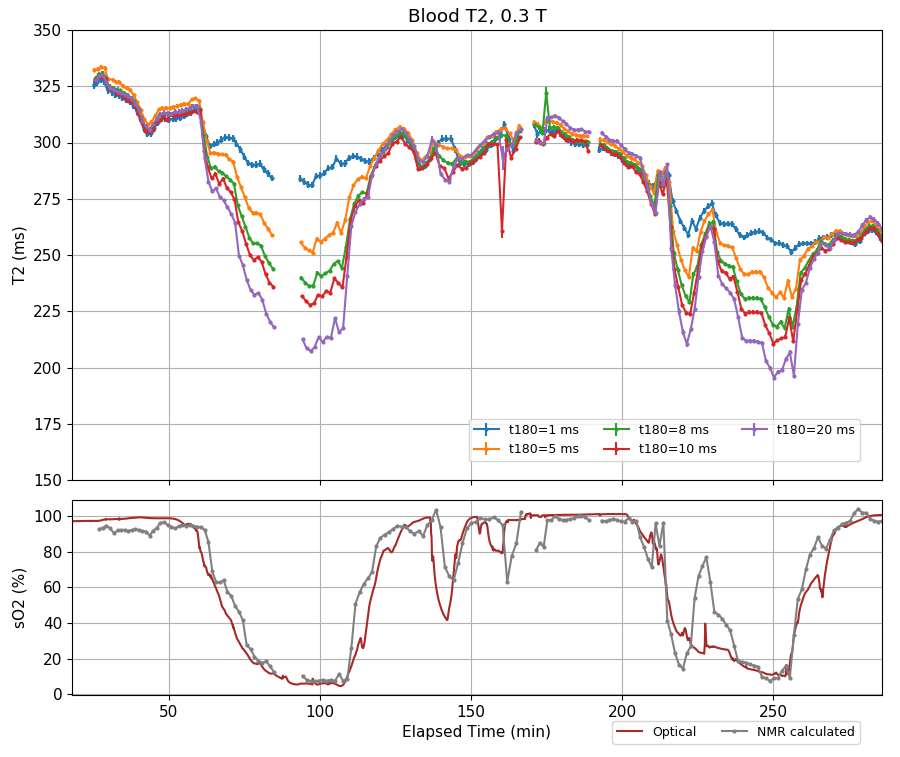
The experiments at each field strength produced a series of correlated T2/sO2 data points, with T2 values for each of the 5 refocusing intervals. Figure 2 shows the results from the 0.3 T experiment, which clearly shows the blood’s T2 decreases as it is deoxygenated, with the change increasing as $$$\tau_{180}$$$ increases. We observed similar trends at all field strengths, with the size of the T2 decrease becoming larger as B0 increased, as suggested in the literature.1,2,9 A downward trend in T2 is also visible across the experiment, which we attribute to the breakdown of blood cells as they circulate through the cardiopulmonary bypass circuit, this was later verified by UV-VIS spectroscopy of plasma samples.
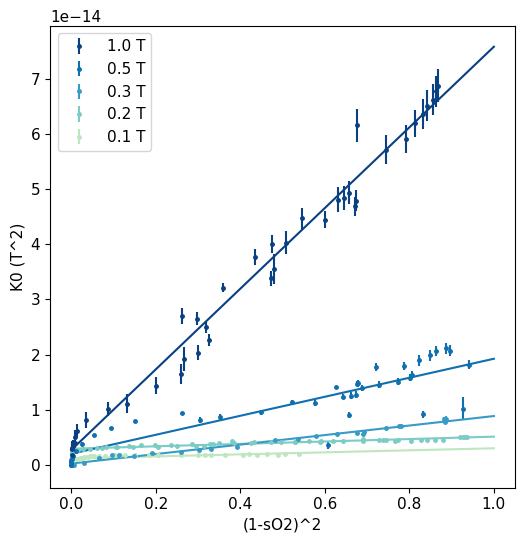
For a more quantitative analysis, data points from the deoxygenation periods in the experiment were extracted and to produce curves of T2 as a function of sO2. These T2 values were fit to Equation 1 to obtain values for the intrinsic T2o and K0. $$$\tau_{ex}$$$ was assumed to be 3.0 ms, following Stefanovic and Pike’s result at 1.5 T3. Plotting this value against (1-sO2)2 shows a linear relationship (Figure 3), which has been shown in the literature at higher fields3,5. We found the slope of these fits is proportional to B02 and the change was still detectable as low as 0.1 T.
Discussion
Our results show the K0 parameter can be described by Equation 2 for the range of field strengths we measured. This agrees with the theory which predicts the dependence on B02 and (1-sO2)2. The oxygenation contrast is still detectable at low fields using longer refocusing intervals in the CPMG pulse sequence.
$$K_0 = (7.55\pm0.2)\times10^{-14} B_0^2 (1-sO_2)^2\quad\quad(2)$$
We also found that the Luz-Meiboom equation provides a good fit to the T2 values measured at different refocusing intervals, which suggests that this model is still a good approximation for this effect at low field. Recently, a method for estimating sO2 with multiple refocusing intervals and Equation 1 was demonstrated10. A similar method based on fitting K0 was tested on the low field data and gives good agreement with the optical tracking (Figure 1, grey trace).
Acknowledgements
The project was funded by the New Zealand Ministry of Business Innovation and Employment
We thank perfusion specialist Amber Blakey (Wellington Regional Hospital, Wellington NZ) for assistance with the blood flow circuit.
References
1 Thulborn, K. R.; Waterton, J. C.; Matthews, P. M.; Radda, G. K. Oxygenation Dependence of the Transverse Relaxation Time of Water Protons in Whole Blood at High Field. Biochim. Biophys. Acta 1982, 714 (2), 265–270.
2 Brooks, R. A.; Vymazal, J.; Baumgarner, C. D.; Tran, V.; Bulte, J. W. M. Comparison of T2 Relaxation in Blood, Brain, and Ferritin. J. Magn. Reson. Imaging 1995, 5 (4), 446–450
3 Stefanovic, B.; Pike, G. B. Human Whole-Blood Relaxometry at 1.5T: Assessment of Diffusion and Exchange Models. Magn. Reson. Med. 2004, 52 (4), 716–723.
4 Silvennoinen, M. J.; Clingman, C. S.; Golay, X.; Kauppinen, R. A.; van Zijl, P. C. M. Comparison of the Dependence of Blood R2 and R 2* on Oxygen Saturation at 1.5 and 4.7 Tesla. Magn. Reson. Med. 2003, 49 (1), 47–60.
5 Chen, J. J.; Pike, G. B. Human Whole Blood T2 Relaxometry at 3 Tesla. Magn. Reson. Med. 2009, 61 (2), 249–254.
6 Grgac, K.; Li, W.; Huang, A.; Qin, Q.; van Zijl, P. C. M. Transverse Water Relaxation in Whole Blood and Erythrocytes at 3T, 7T, 9.4T, 11.7T and 16.4T; Determination of Intracellular Hemoglobin and Extracellular Albumin Relaxivities. Magn. Reson. Imaging 2017, 38, 234–249.
7 Wright, G. A.; Hu, B. S.; Macovski, A. Estimating Oxygen Saturation of Blood in Vivo with MR Imaging at 1.5 T. J. Magn. Reson. Imaging 1991, 1 (3), 275–283.
8 Varghese, J.; Potter, L. C.; LaFountain, R.; Pan, X.; Raman, S. V.; Ahmad, R.; Simonetti, O. P. CMR-Based Blood Oximetry via Multi-Parametric Estimation Using Multiple T2 Measurements. J. Cardiovasc. Magn. Reson. 2017, 19, 88.
9 Gomori, J. M.; Grossman, R. I.; Yu-Ip, C.; Asakura, T. NMR Relaxation Times of Blood: Dependence on Field Strength, Oxidation State, and Cell Integrity. J. Comput. Assist. Tomogr. 1987, 11 (4), 684.
10 Bryant, R. G.; Marill, K.; Blackmore, C.; Francis, C. Magnetic Relaxation in Blood and Blood Clots. Magn. Reson. Med. 1990, 13 (1), 133–144.
Figures