4977
Inversion-recovery MRI based biphasic analysis of porous media: simulations, phantom experiments and in vivo brain study.1Department of Radiology, Charité – Universitätsmedizin Berlin, Berlin, Germany, 2Institut of Medical Informatics, Charité – Universitätsmedizin Berlin, Berlin, Germany, 3Department of Radiology, Interdisciplinary Ultrasound Center, Charité – Universitätsmedizin Berlin, Berlin, Germany, 4Berlin Center for Advanced Neuroimaging, Charité – Universitätsmedizin Berlin, Berlin, Germany, 5Bernstein Center for Computational Neuroscience, Charité – Universitätsmedizin Berlin, Berlin, Germany
Synopsis
A novel technique that combines inversion recovery MRI (IR-MRI) and a biphasic porous tissue model is introduced to quantify in every voxel the porosity, defined as the ratio between the volume of the fluid phase and the total volume of both the fluid and the solid matrix. Simulations revealed precise results over a wide range of values.
Porosities of tofu phantoms measured by IR-MRI were in good agreement with the values obtained from reference methods, confirming the stability of our technique.
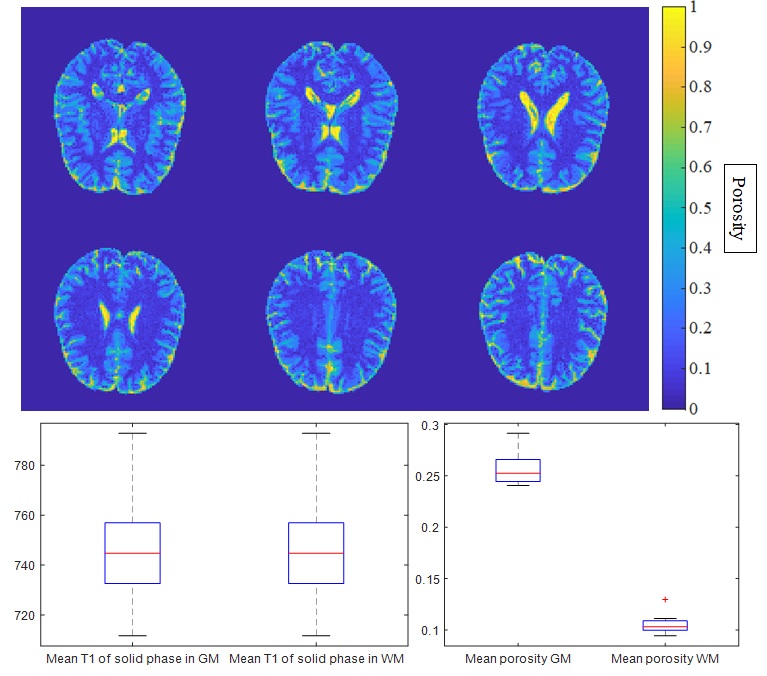
The same IR-MRI method was then applied to the brains of healthy volunteers providing quantitative maps of porosity.
Introduction
The aim of this study is to develop an MRI-based method for the voxel-wise measurement of the microscopic porosity of a porous medium composed of two phases characterized by distinct T1 relaxation times.
This is achieved using an inversion recovery EPI sequence (IR-MRI) combined with a biphasic model of the MR signal in each voxel:
$$ MeasuredIntensity(TI) = Porosity \cdot Intensity_{TI=\infty Phase1}\left(1-2e^{\frac{-TI}{T1_{phase1}}}\right )+(1-Porosity)\cdot Intensity_{TI=\infty Phase2}\left(1-2e^{\frac{-TI}{T1_{phase2}}}\right))+offset $$
$$ Porosity= \frac{VolumePhase1}{VolumePhase1+VolumePhase2}$$
while $$$Intensity_{TI=\infty Phase1}$$$ and $$$Intensity_{TI=\infty Phase2}$$$ are the intensities of the two phases without inversion recovery.
The model describes signal variation with changes in inversion time (TI). The number of variables renders the model unstable for fitting. To improve stability, one of the T1-times is independently quantified and used as a fixed parameter.
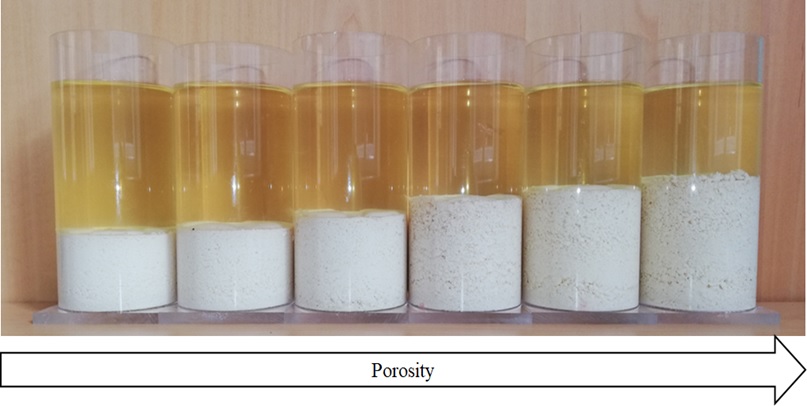
We demonstrated the feasibility of this approach by IR-MRI measurements of biphasic materials with a simulation and we used tofu as porous phantom1 material to demonstrate the validity of the obtained porosity. Finally, a preliminary in-vivo study in the brains of healthy volunteers will be presented.
Methods
The simulation consists of two pairs of bottles containing different liquids that were scanned simultaneously in a 1.5-Tesla scanner (Siemens Sonata) using an inversion recovery spin-echo single-shot EPI sequence. Measurement parameters were TE=36ms, TR=5150ms, 28 TIs between 120 and 5000ms and resolution=1.85×1.85×1.90mm3. In each pair, one bottle contained 100ml of physiological saline solution, and the other one a mix of saline solution and different amounts of a 0.5mmol/ml gadolinium solution (Dotarem®).
In the complex MR images, “supervoxels” were defined by averaging the signal over regions that contained voxels from the two liquids at different percentages, thus emulating the averaging of a biphasic microstructure into a MRI voxel. The simulated volume ratio was reconstructed by fitting the biphasic model to the complex MR signal of the supervoxels, prescribing the T1 of one of the two phases with a value determined from a monoexponential fit, and leaving the second one as a variable. This allowed for the reconstruction of the T1 of the second phase and the simulated porosity.
Ten tofu samples were produced with different porosities(Fig.1). T1fluid was estimated from the liquid extracted during tofu production. The same liquid inside the tofu represents the fluid phase in the porous model. Porosity and T1solid were estimated as in the first experiment, with TE=35ms, TR=60000ms, 16 TIs between 120 and 5000ms and resolution=2×2×2mm3 and all other parameters being identical. Two reference methods were used for porosity quantification in tofu:
- draining the liquid from six specimen using standardized weight of 340g
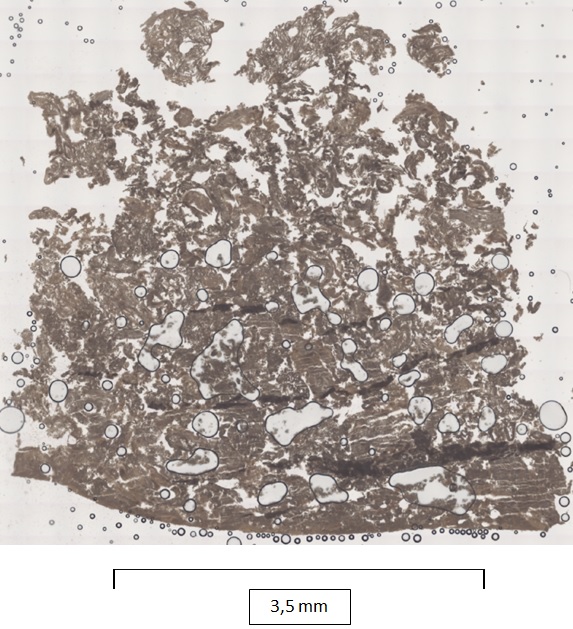
- optical microscopy and image analysis for the remaining four(Fig.2).
For porosity estimation of in-vivo brain tissue, we investigated 13 healthy volunteers with age=36±11 years in a 3-Tesla scanner(Siemens Trio) with following imaging parameters: TE=45ms, TR=40550ms, 19 TIs between 120 and 5000ms, resolution 2×2×2mm3, and GRAPPA factor 2. T1fluid was quantified from the ventricles. T1solid and porosity were quantified voxel-wise. For group analysis, porosities were averaged within grey and white matter after automated segmentation.
Results
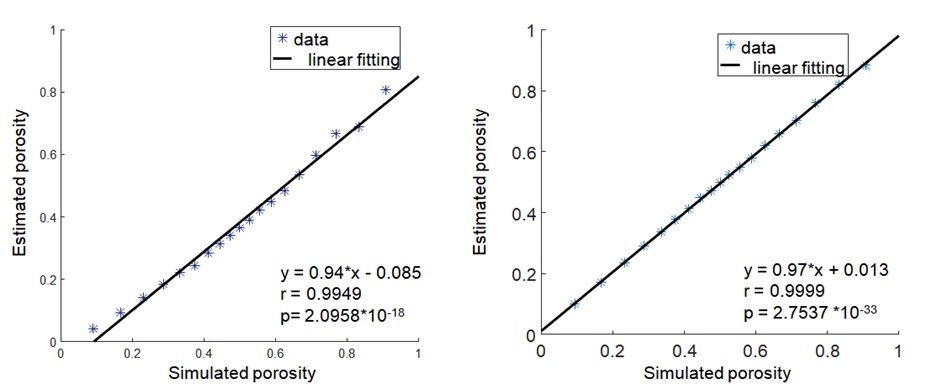
The experiment with simulated voxels demonstrated the validity of the biexponential model porosity estimation across almost the entire parameter range (0-1) using one T1 as a fixed parameter while the other one is a variable of the fitting process(Fig.3).
Linear correlation analysis of the microscopy-obtained porosities with the estimated from IR-MRI resulted in a correlation coefficient of 0.99 and p=0.006.
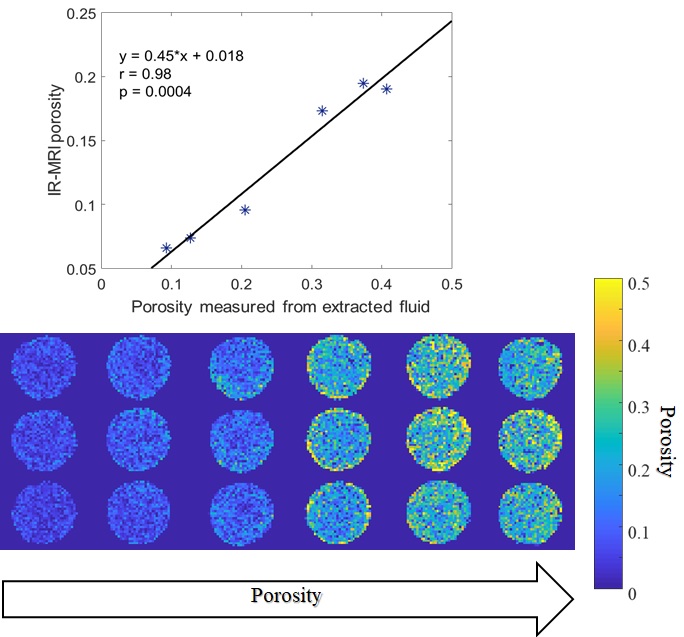
Fig.4. shows the correlation between IR-MRI porosity and reference porosity derived from the extracted liquid (R=0.98, p=0.0004).
The in-vivo study showed that, using our biphasic model, the group mean porosity in grey matter (0.26±0.01) is significantly higher than in white matter (0.105±0.008), while T1solid does not show significant differences between the regions(Fig.5).
Discussion
Our method allows T1-time based porosity measurements in soft tissues exploiting a biphasic tissue model.
The method is very precise in an idealized medium with controlled T1-times across the entire range of physical porosities (between 0 and 1).
The validity of our approach could well be demonstrated in tofu phantoms, in which the simplified assumption of two isolated peaks in the relaxation time spectrum is no longer fulfilled. However, the good agreement of IR-MRI and reference methods for porosity quantification demonstrates the feasibility of analyzing microscopic tissue porosity by macroscopic image resolution based on our biphasic tissue model.
The results of our brain study suggest that brain tissue porosity is a potentially interesting imaging marker, which reflects the ratio between CSF and tissue compartments with shorter T1-relaxation times such as solid tissue and microvessels. Biphasic brain tissue porosity is related to the microstructural constitution of neural tissue and might change with atrophy and degenerative diseases.
Acknowledgements
This research was supported by GRK2260 (BIOQIC) of the German Research Foundation.References
1. Perriñez, Phillip R., et al. "Modeling of soft poroelastic tissue in time-harmonic MR elastography." IEEE transactions on biomedical engineering 56.3 (2009): 598-608.
2. NYU Langone Medical Center, Experimental Pathology Research Laboratory, Dewan/Loomis-Protocol: Revised 12-16-2016, https://med.nyu.edu/research/scientific-cores-shared-resources/sites/default/files/frozen-tissue-preparation-with-sucrose.pdf
3.Kawamoto, Tadafumi, and Komei Kawamoto. "Preparation of thin frozen sections from nonfixed and undecalcified hard tissues using Kawamot’s film method (2012)." Skeletal development and repair. Humana Press, Totowa, NJ, 2014. 149-164.
Figures