4976
Silent T1-Mapping at 7T Using the Variable Flip Angle Method1Neuroimaging, King's College London, London, United Kingdom, 2General Electric Healthcare, London, United Kingdom, 3ASL West, General Electric Healthcare, Menlo Park, CA, United States, 4Radiology and Biomedical Imaging, University of California San Francisco, San Francisco, CA, United States, 5Medicine, University of British Columbia, Vancouver, BC, Canada, 6ASL Europe, General Electric Healthcare, Amersham, United Kingdom, 7ASL Europe, General Electric Healthcare, Munich, Germany
Synopsis
In this work we present quantitative T1-maps obtained using the silent, zero echo-time, RUFIS sequence at 7T. Four flip angles (2,4,8,11)° were acquired in 5 minutes. The obtained T1-maps showed strong contrast between white matter (T1=1.6s) and cortical grey matter (T1=2.3s), in agreement with values in the literature. Reduced contrast was observed in deep grey matter structures, attributed to large B1+-errors in the centre of the brain.
Introduction
Quantitative T1-mapping is increasingly difficult at higher field strengths, due to increased spatial variation in the B0 and B1+ fields, as well as SAR constraints. It does however inherently result in higher signal to noise ratio (SNR) due to the increased spin polarization and higher Larmor frequency at higher field strengths.
The Radial Ultra-Fast Imaging Sequence (RUFIS)1 is a silent, zero echo time (ZTE), 3D radial sequence, utilizing low flip angle, ultra-short hard RF pulses for excitation. In this work, we study the efficacy of using RUFIS for quantitative T1-mapping at 7T using the variable flip angle method (VFA), building on previous work at 3T2. T1-estimation using the VFA method can be achieved with a pair of flip angles chosen relative to the Ernst angle3. However, large variations in B1+, as expected at 7T, motivates the use of more than two flip angles to improve the T1-fitting4.
With RUFIS, the highest achievable flip angles for a given peak RF amplitude are limited, as RF excitation with hard pulses in the presence of a gradient results in an unwanted sinc-shaped excitation profile in the direction of the current readout gradient5. However, since 7T scanners commonly utilize a local head transmit coil, higher peak B1+ and thus flip angle, can typically be achieved compared to the body coil transmit typically used at lower fields.
Here we report the first results using RUFIS for silent T1-mapping using the VFA method at 7T with B1+-correction.
Methods
A single healthy volunteer was scanned on a GE MR950 7T scanner using a local head transmit and a Nova 32 channel receive head-coil. RUFIS acquisition was performed with a receive bandwidth of ±15.6kHz, TR=2.4ms, FA=[2,4,8,11]°, FOV=192x192x192mm3, voxel size=1.5x1.5x1.5mm3, RF pulse width=32μs, 512 spokes per segment, and 1.5 averages. Total acquisition time was ~5min. B1-mapping was performed using a multi-slice 2D Bloch-Siegert sequence with whole brain coverage6.
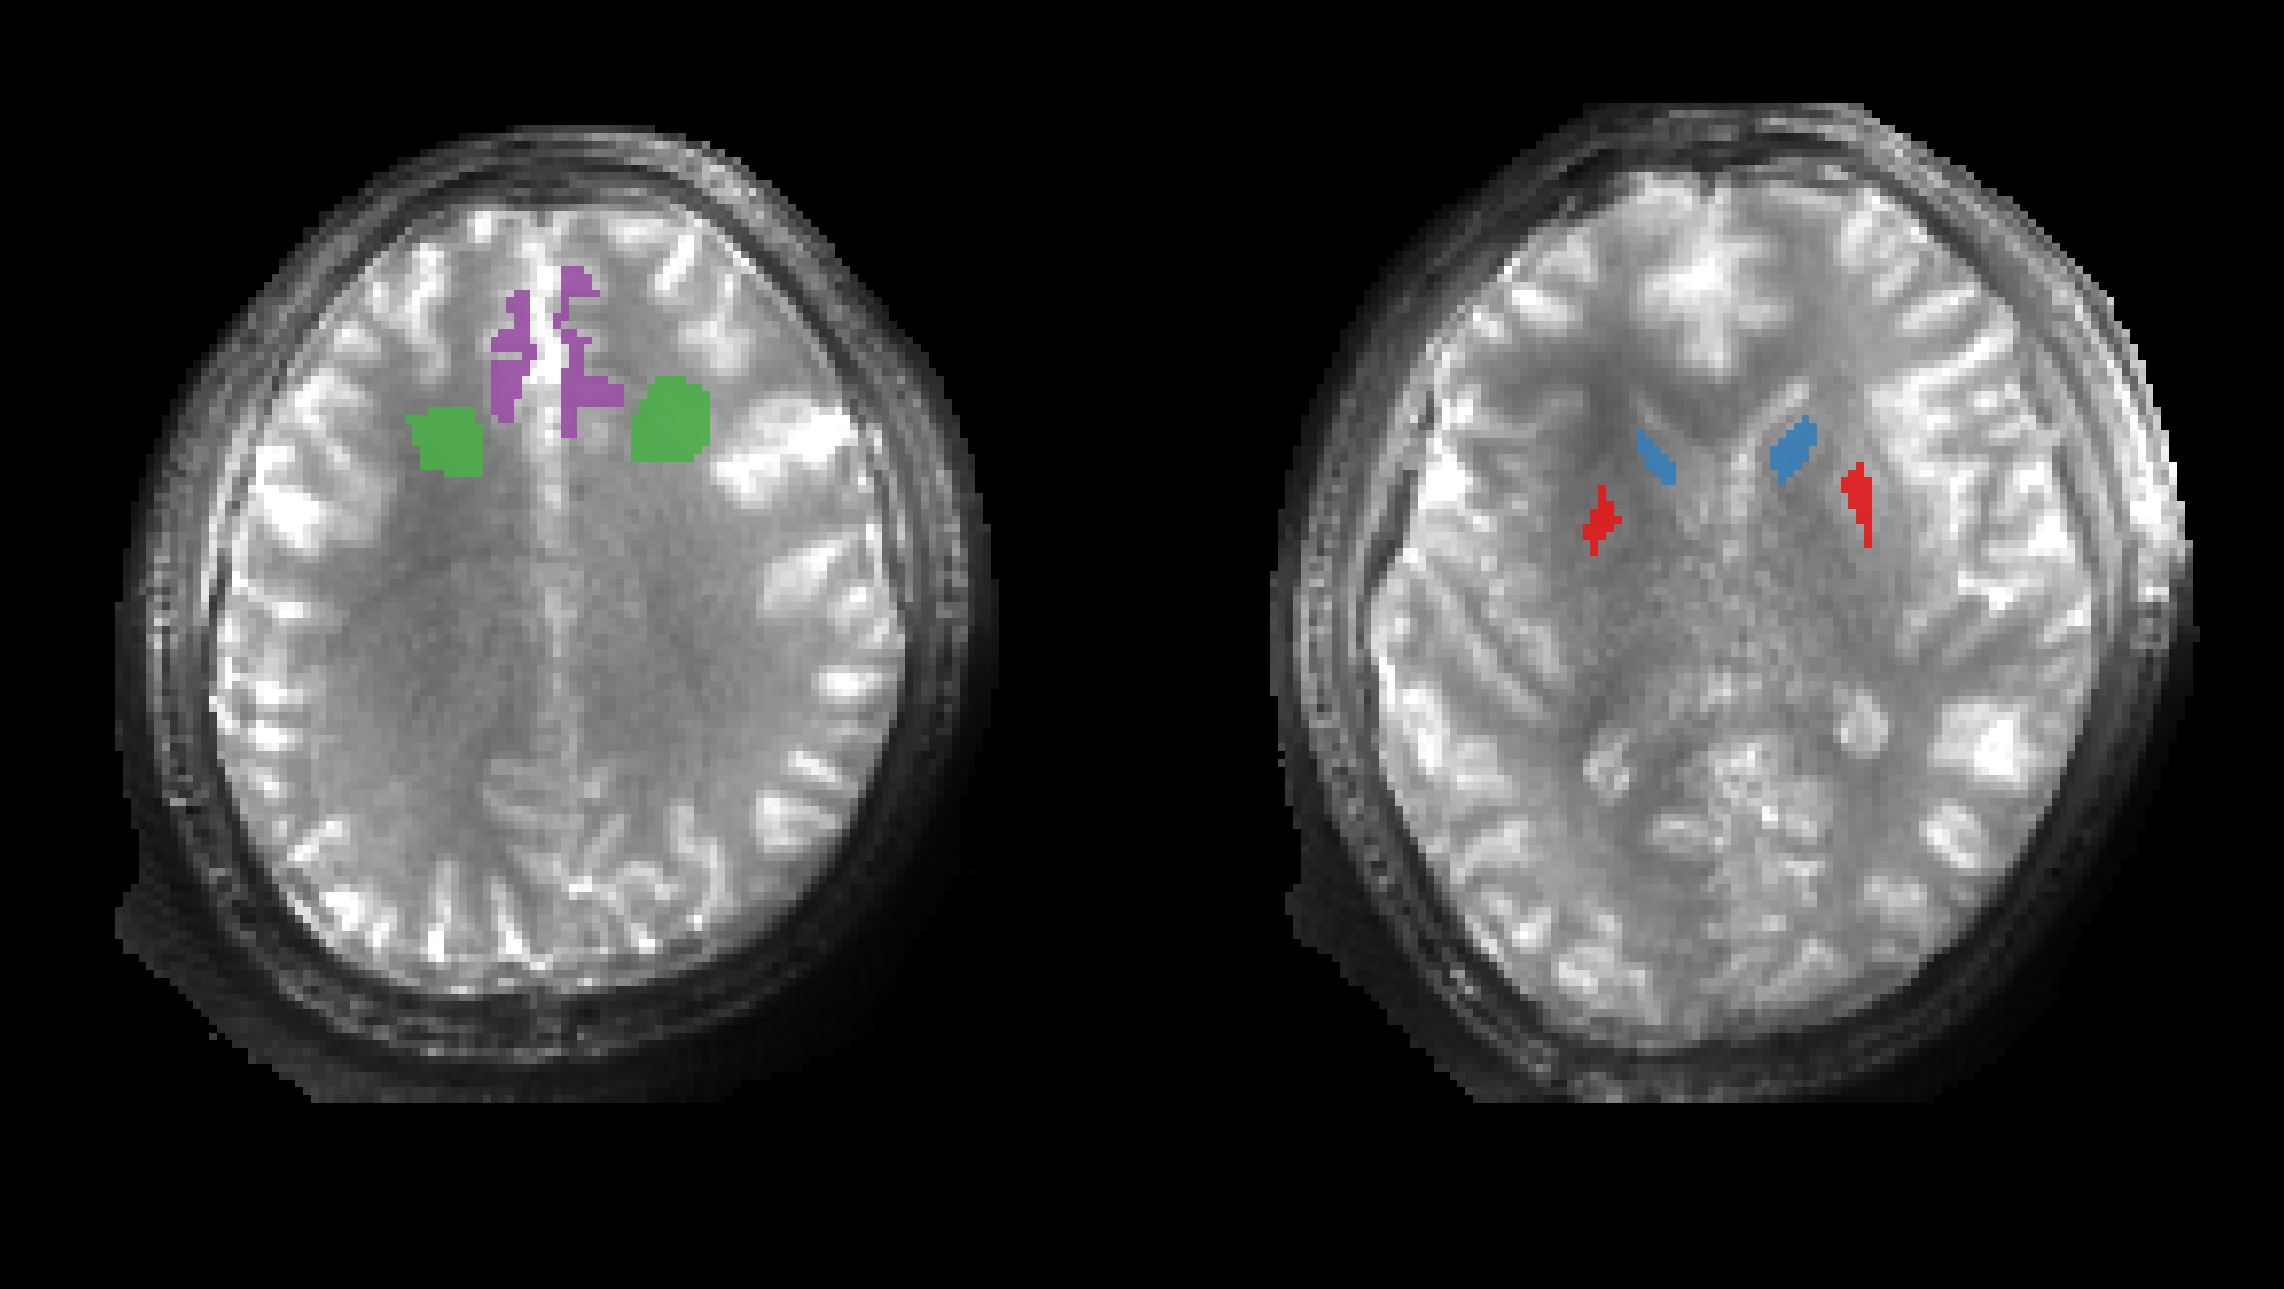
A first order excitation profile correction was performed by iteratively simulating and averaging the excitation profile from 1024 spokes. To remove acquisition artefacts in the B1-map, a 6th order 3D-polynomial was fitted to the B1-map. The slice profile correction was multiplied by the B1-map to obtain a map for complete flip angle compensation. Quantitative T1-maps were obtained using a linear fit implemented in QUIT7. T1-values were measured in individual regions of interest (ROIs): cortical grey matter (cGM), white matter (WM), putamen and head of caudate (figure 1).
Results
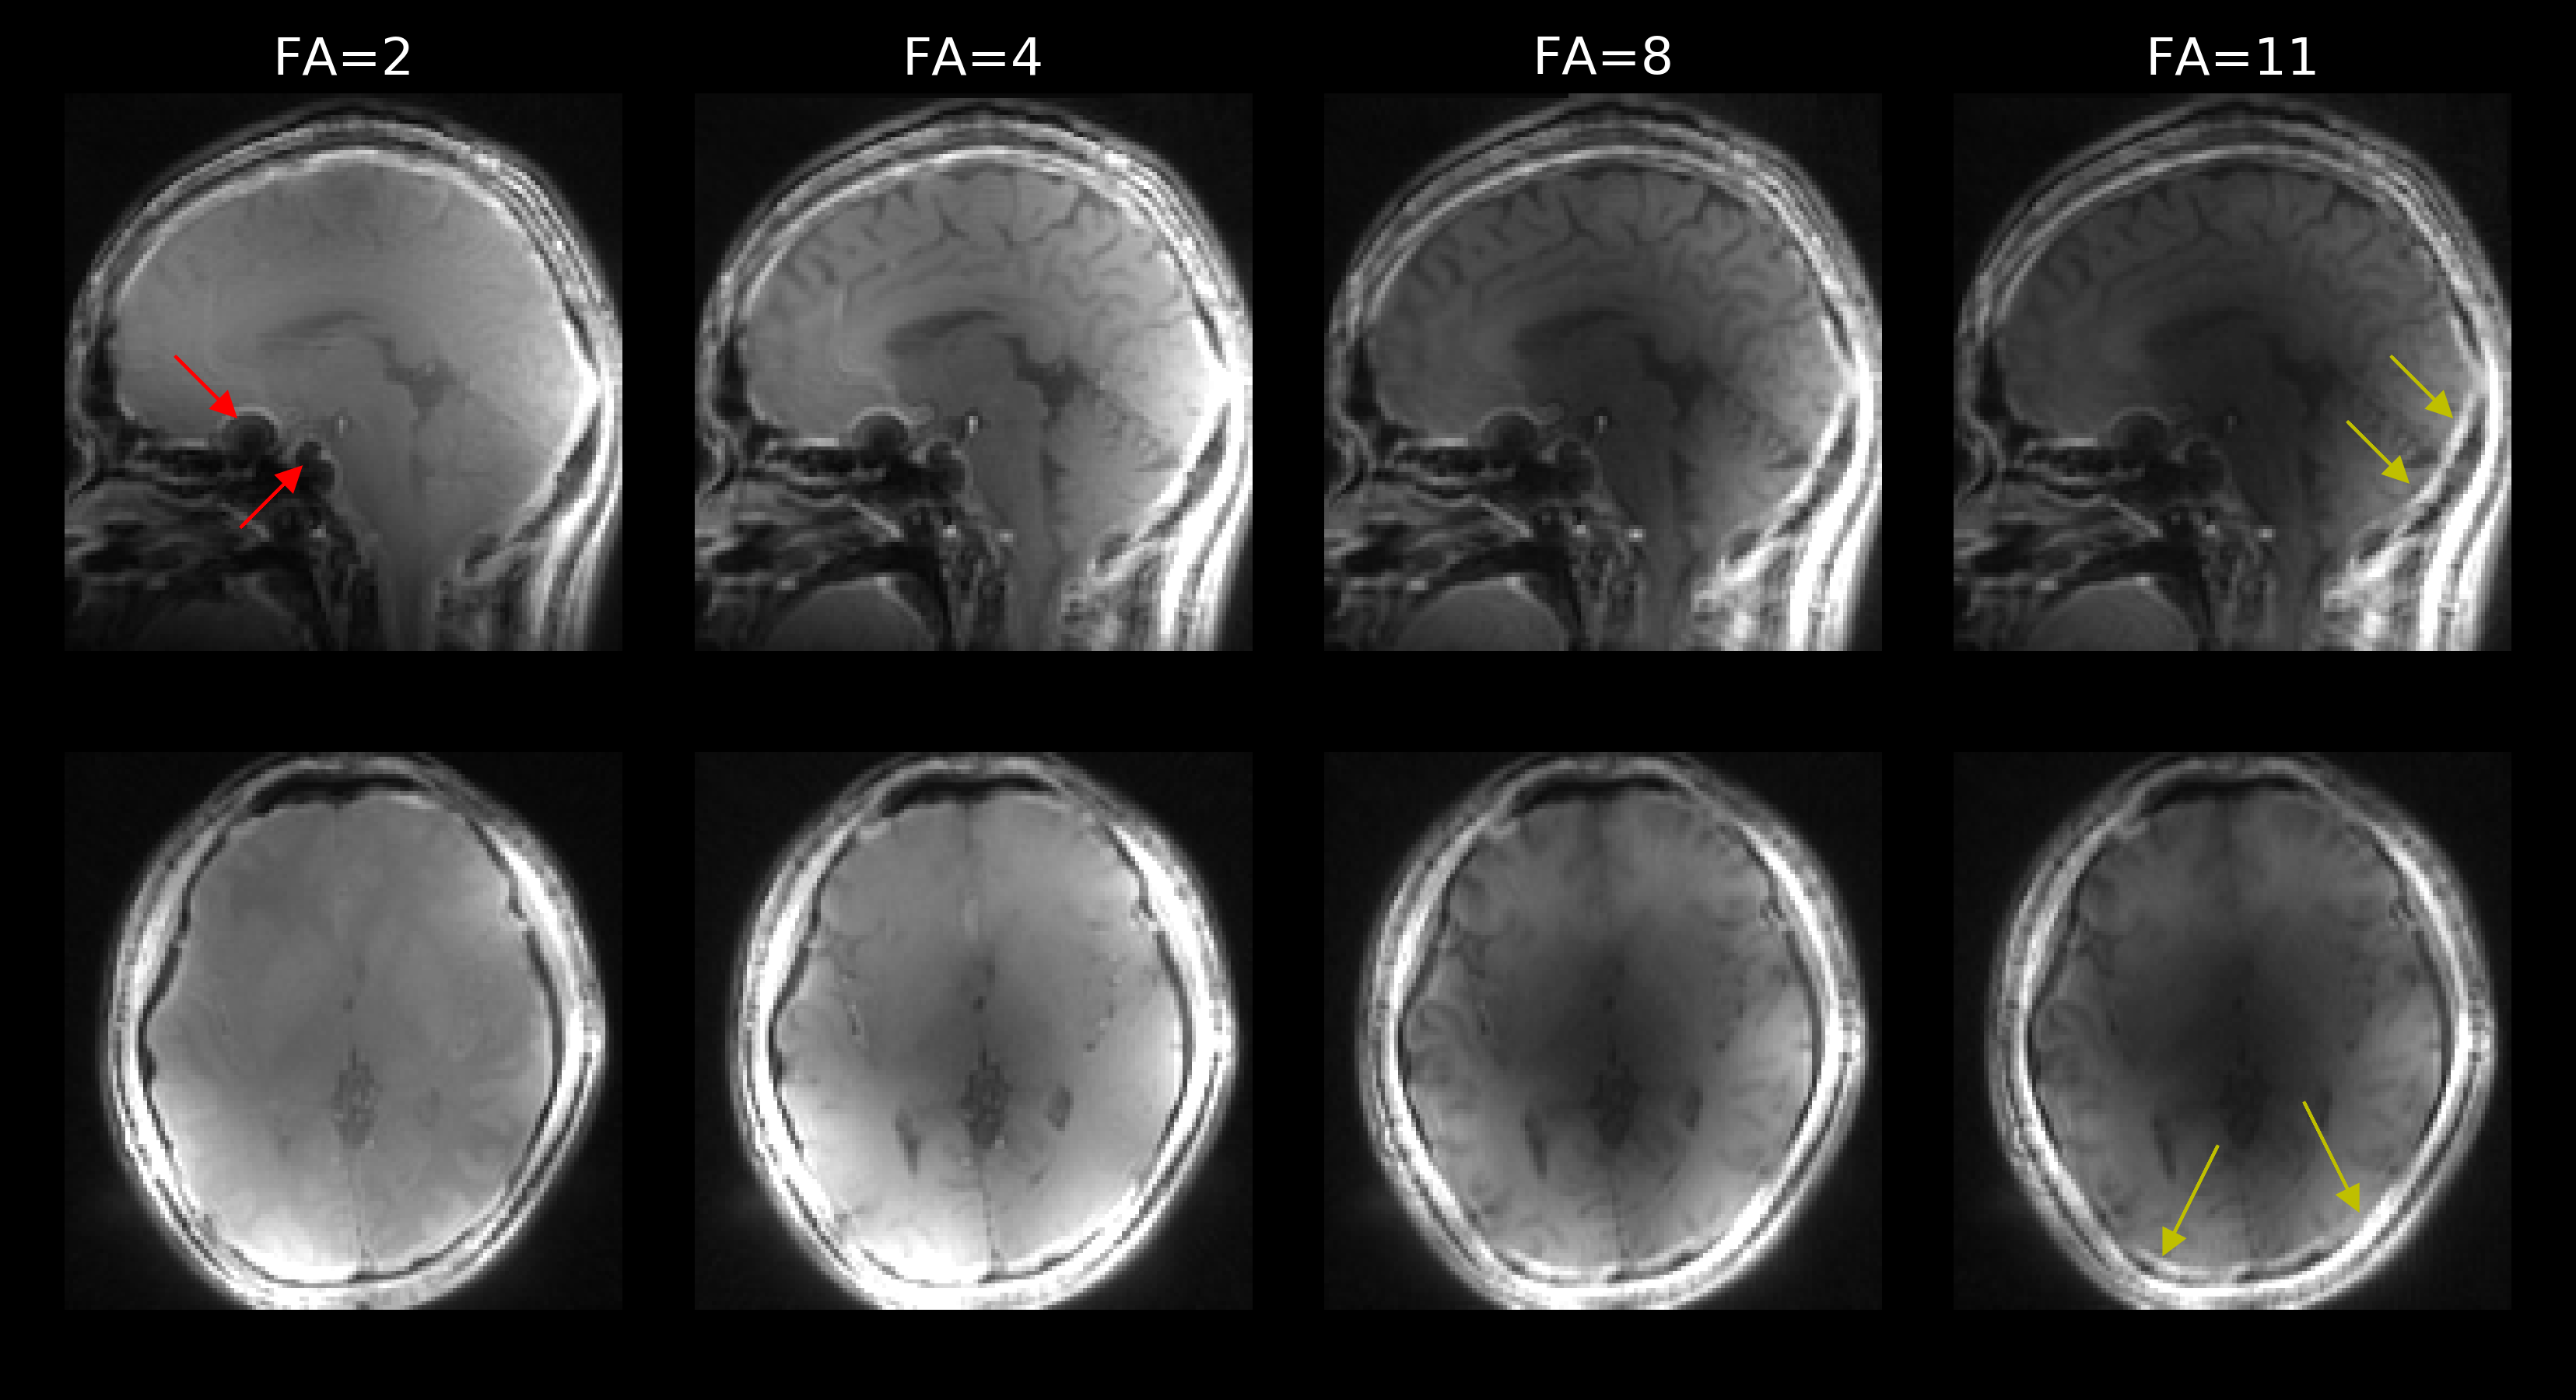
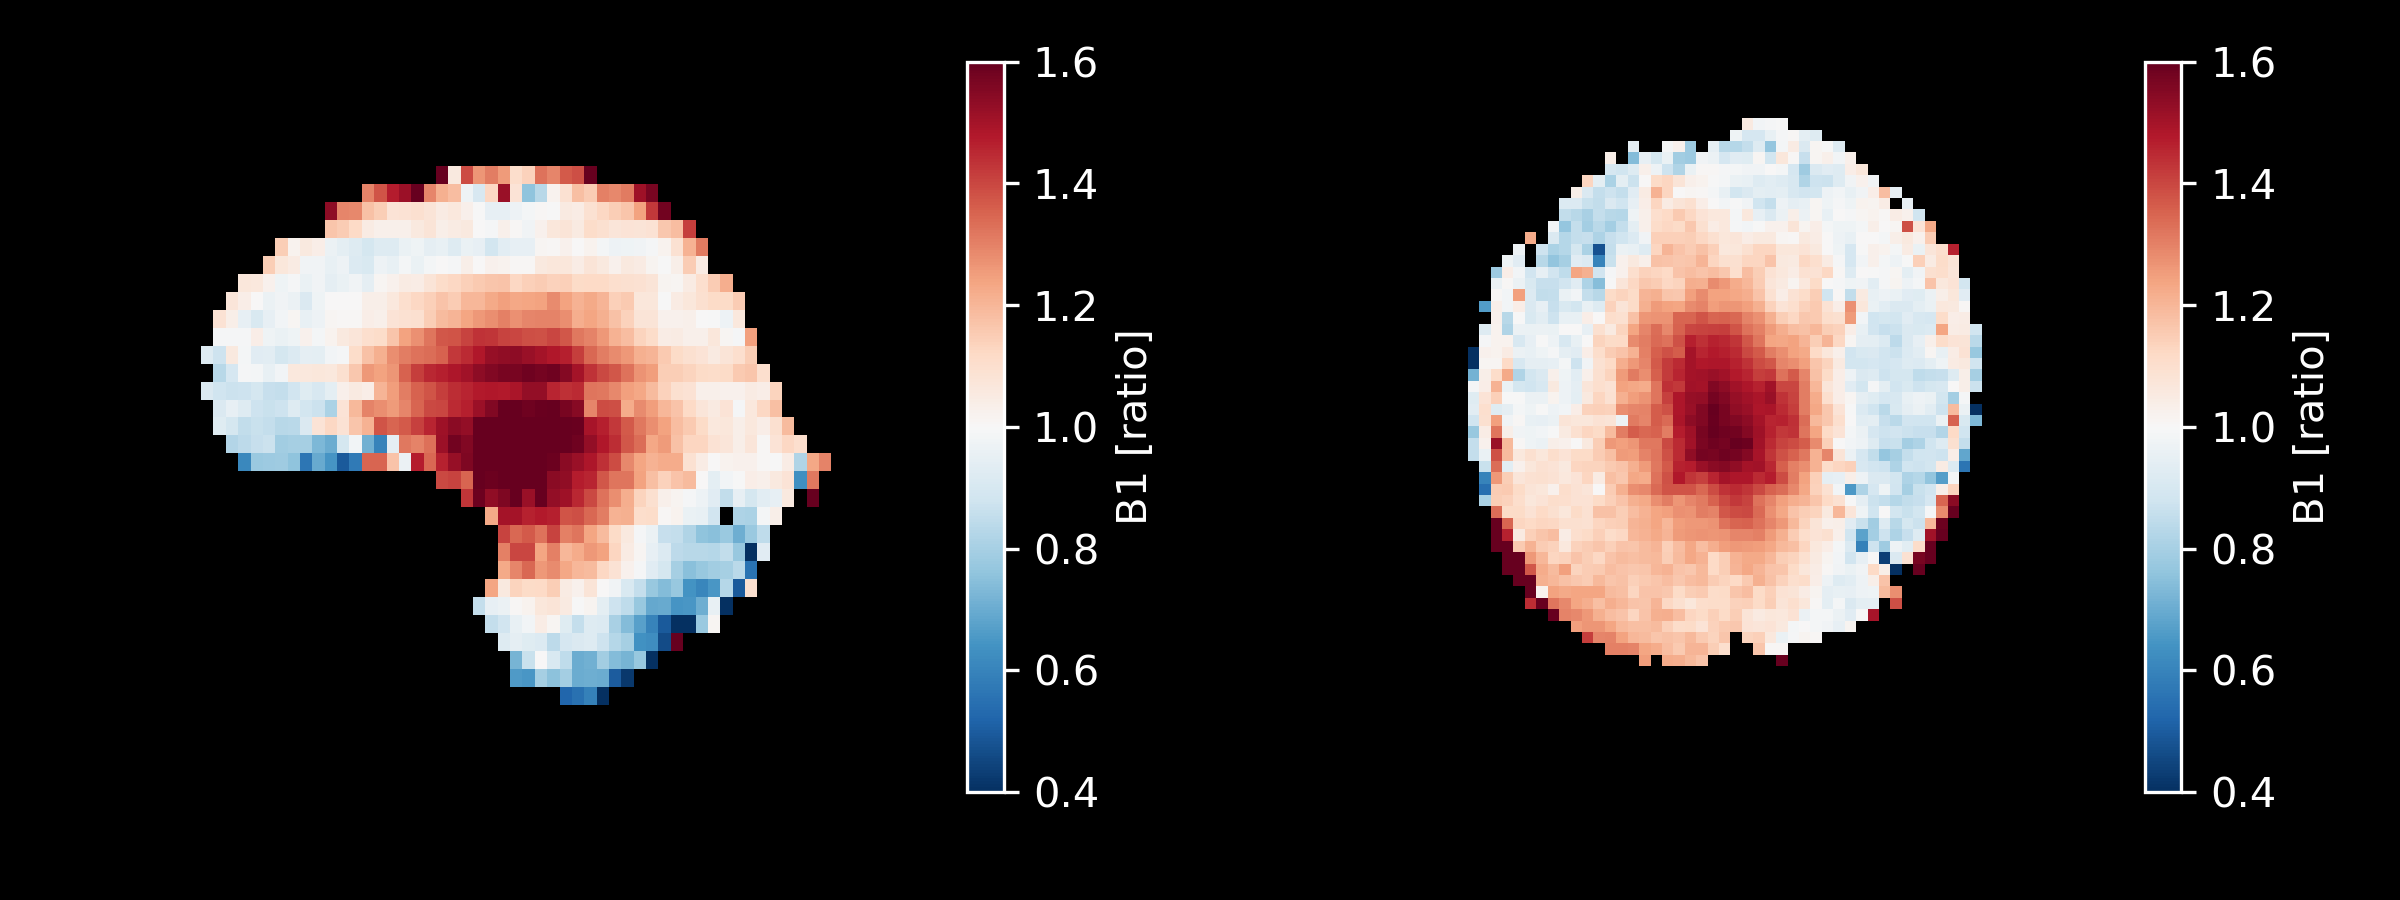
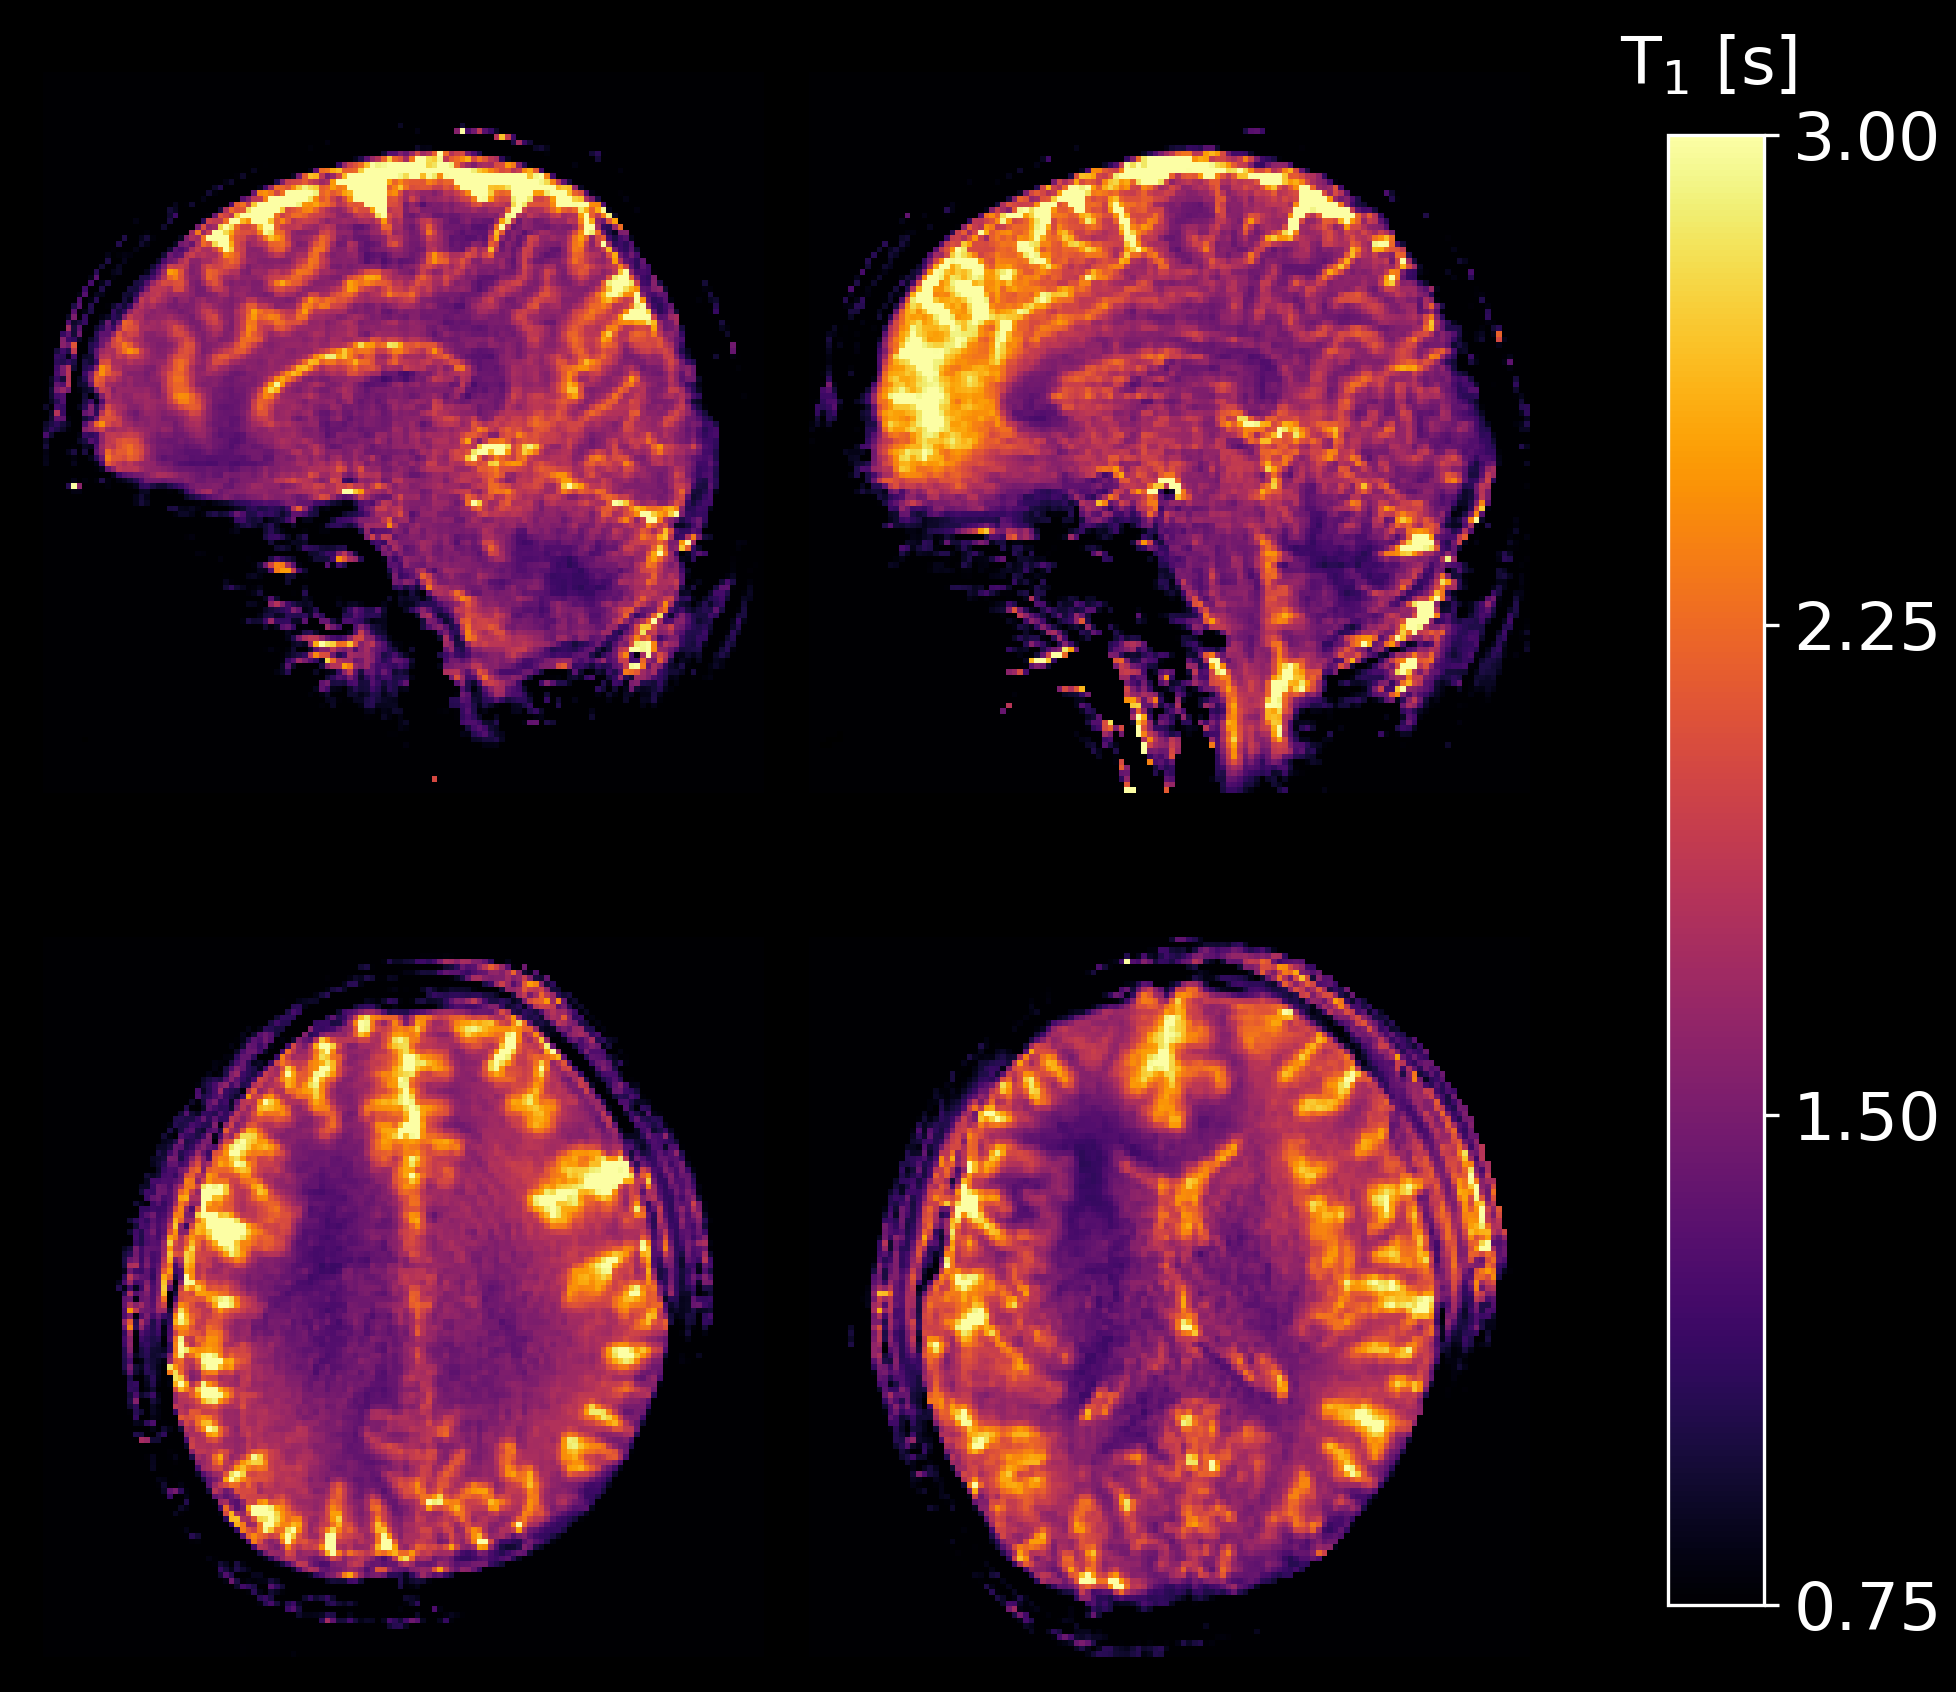
The acquired RUFIS images obtained at each flip angle (figure 2) showed water-fat shift artefacts (yellow arrows) manifesting around the cortex in the radial direction due to the radial acquisition. Susceptibility artefacts were also visible around the sinuses (red arrows). The Bloch-Siegert B1-map (figure 3) showed spatial variations in B1+>±50%. Quantitative T1-maps (figure 4) show strong contrast between white matter and cortical grey matter. T1 values from isolated ROIs were estimated as: putamen=1.59±0.23s, caudate=1.58±0.14s, WM=1.58±0.22s, cGM=2.25±0.19s.Discussion and Conclusions
In this work we have shown the first variable flip angle T1-maps acquired with RUFIS at 7T. T1 values from the grey matter ROIs compares well with values in the literature while the observed T1 in white matter is longer than reported in previous studies (e.g. Wright et al.: WM=1.13±0.10s, cGM=1.94±0.15s, putamen=1.64±0.167s, caudate=1.68±0.07)8–10. We attribute these issues to large variations in B1+ which makes the T1-fitting using VFA more difficult. This issue is most pronounced in the centre of the brain, where the flip angles are ~60% larger than prescribed. This will push the lower flip angles towards, or beyond, the Ernst angle which will reduce the quality of the T1-estimation. Future work will further investigate if the bandwidth and flip angle combinations can be optimized for the large variations in B1+ that are observed.
In conclusion, our results show that T1-mapping using silent RUFIS acquisition at 7T is possible, with errors in B1+ and water-fat shift artefacts being the most significant issues. While the observed variations in B1+ favours T1-mapping techniques with less sensitivities to B1+,such as MP2RAGE8,11, the VFA method is significantly faster with nearly 100% sampling efficiency compared to MP2RAGE which requires delays for inversion times. In addition, the RUFIS sequence allows for silent data acquisition. This is of particular interest at higher field strength where increased acoustic noise has been reported by participants as one of the main differences to scans at lower field strengths12.
Acknowledgements
This study represents independent research part funded by the NIHR-Wellcome Trust King's Clinical Research Facility and the National Institute for Health Research (NIHR) Biomedical Research Centre at South London and Maudsley NHS Foundation Trust and King’s College London. The views expressed are those of the author(s) and not necessarily those of the NHS, the NIHR or the Department of Health and Social Care. Funding was also received from General Electric Healthcare.References
- Madio DP, Lowe IJ. Ultra-Fast Imaging Using Low Flip Angles and FIDs. Magn Reson Med. 1995;34(4):525-529.
- Ljungberg E, Beatriz A, Sanchez S, et al. Silent T1-Mapping Using the Variable Flip Angle Method with Zero Echo Time. In: Proc. Intl. Soc. Mag. Reson. Med 26. Paris; 2018:0270.
- Wood TC. Improved formulas for the two optimum VFA flip-angles. Magn Reson Med. 2015;74(1):1-3.
- Vaughan JT, Garwood M, Collins CM, et al. 7T vs. 4T: RF power, homogeneity, and signal-to-noise comparison in head images. Magn Reson Med. 2001;46(1):24-30.
- Grodzki DM, Jakob PM, Heismann B. Correcting slice selectivity in hard pulse sequences. J Magn Reson. 2012;214:61-67.
- Sacolick LI, Wiesinger F, Hancu I, Vogel MW. B1 mapping by Bloch-Siegert shift. Magn Reson Med. 2010;63(5):1315-1322.
- Wood TC. QUIT: QUantitative Imaging Tools. J Open Source Softw. 2017;3(26):656.
- Wright PJ, Mougin OE, Totman JJ, et al. Water proton T1measurements in brain tissue at 7, 3, and 1.5T using IR-EPI, IR-TSE, and MPRAGE: Results and optimization. Magn Reson Mater Physics, Biol Med. 2008;21(1-2):121-130.
- Rooney WD, Johnson G, Li X, et al. Magnetic field and tissue dependencies of human brain longitudinal 1H2O relaxation in vivo. Magn Reson Med. 2007;57(2):308-318.
- Li T-Q, Deoni SC. Fast T1 Mapping of the Brain at 7T with RF Calibration Using Three Point DESPOT1 Method. Proc Int Soc Magn Reson Med. 2006;237(2005):2643.
- Marques JP, Gruetter R. New Developments and Applications of the MP2RAGE Sequence - Focusing the Contrast and High Spatial Resolution R1 Mapping. PLoS One. 2013;8(7).
- van Osch MJP, Webb AG. Safety of Ultra-High Field MRI: What are the Specific Risks? Curr Radiol Rep. 2014;2(8):61.
Figures