4975
The echo time of balanced steady-state free precession readouts modulates the influence of fat on MOLLI T1 measurements1Radcliffe Department of Medicine, University of Oxford, Oxford, United Kingdom, 2Perspectum Diagnostics, Oxford, United Kingdom
Synopsis
With the increasing world-wide prevalence of non-alcoholic fatty liver disease it is essential to look for non-invasive diagnostic and monitoring methods, like T1 mapping. It has previously been shown that the presence of fat can artificially prolong liver T1 times measured with modified Look-Locker methods. However, this effect depends on the chosen TR and TE of the readout sequence. Since achievable TR and TE differs for scanner vendors and models, it is important to understand the influence of sequence timings on MOLLI T1 measurements in the presence of fat.
Introduction
T1 relaxation time measured with modified Look-Locker inversion recovery (MOLLI) sequences is biased by T21, magnetization transfer1, off-resonance2, imperfect inversion, incomplete recovery3 and imperfect application of the Deichmann-Haase correction4. This is in addition to the physiological confounding effects of iron5, fibrosis and inflammation6,7. Fat has also been shown to influence MOLLI T1 measurements8,9 due to partial volume effects on a sub-voxel level. This is of importance in the liver, where physiological levels of fat can reach 50 %. The influence of fat on liver MOLLI T1 values has been previously described9 and an algorithm capable of reversing its effects was also proposed10. The aim of this work is to explore the effect of varying the echo time of the balanced steady-state free precession (bSSFP) readout employed by MOLLI sequences.Methods
Simulations of bSSFP signals were performed at TR=2.3 ms with TEs ranging from 0.581 ms to 1.15 ms. Over this interval, the water peak (T1=875 ms, T2=34 ms) and the methylene fat peak (δ=3.5 ppm) have a phase difference between π/2 rad and π rad at 2.89 T. A typical shortened-MOLLI (shMOLLI)3 sequence was simulated in MATLAB (The MathWorks, USA) using the Bloch equation. Fat was characterised by a six-peak spectral model11. Water and fat bSSFP signals were simulated separately and they were combined to reflect fat fractions between 0% and 100%. T1 values were determined using the shMOLLI conditional fitting3. Phantom measurements were performed on a Siemens Trio Tim 2.89 T system (Siemens Healthineers, Erlangen, Germany) using three sets of fat-water phantoms containing 0 %, 5 %, 10 %, 20 % and 30 % fat fractions by mass. The three sets of phantoms had different water T1 (690 ms, 1153 ms, and 1397 ms, respectively). ShMOLLI measurements were performed at TR=2.3 ms and TE=1.05 ms. Multiple-echo GRE data was also collected for field map quantification using a T2*-IDEAL algorithm12. A multiple-TR, multiple-TE STEAM spectroscopy sequence13 was used to determine the T1 of the water component in phantoms. Phantom shMOLLI T1 values were corrected to reflect the original water T1 in the absence of fat, using a previously described correction method10. Two corrections were performed: one assuming symmetric echo acquisition and another reflecting the asymmetric echo time used in the shMOLLI acquisition.Results
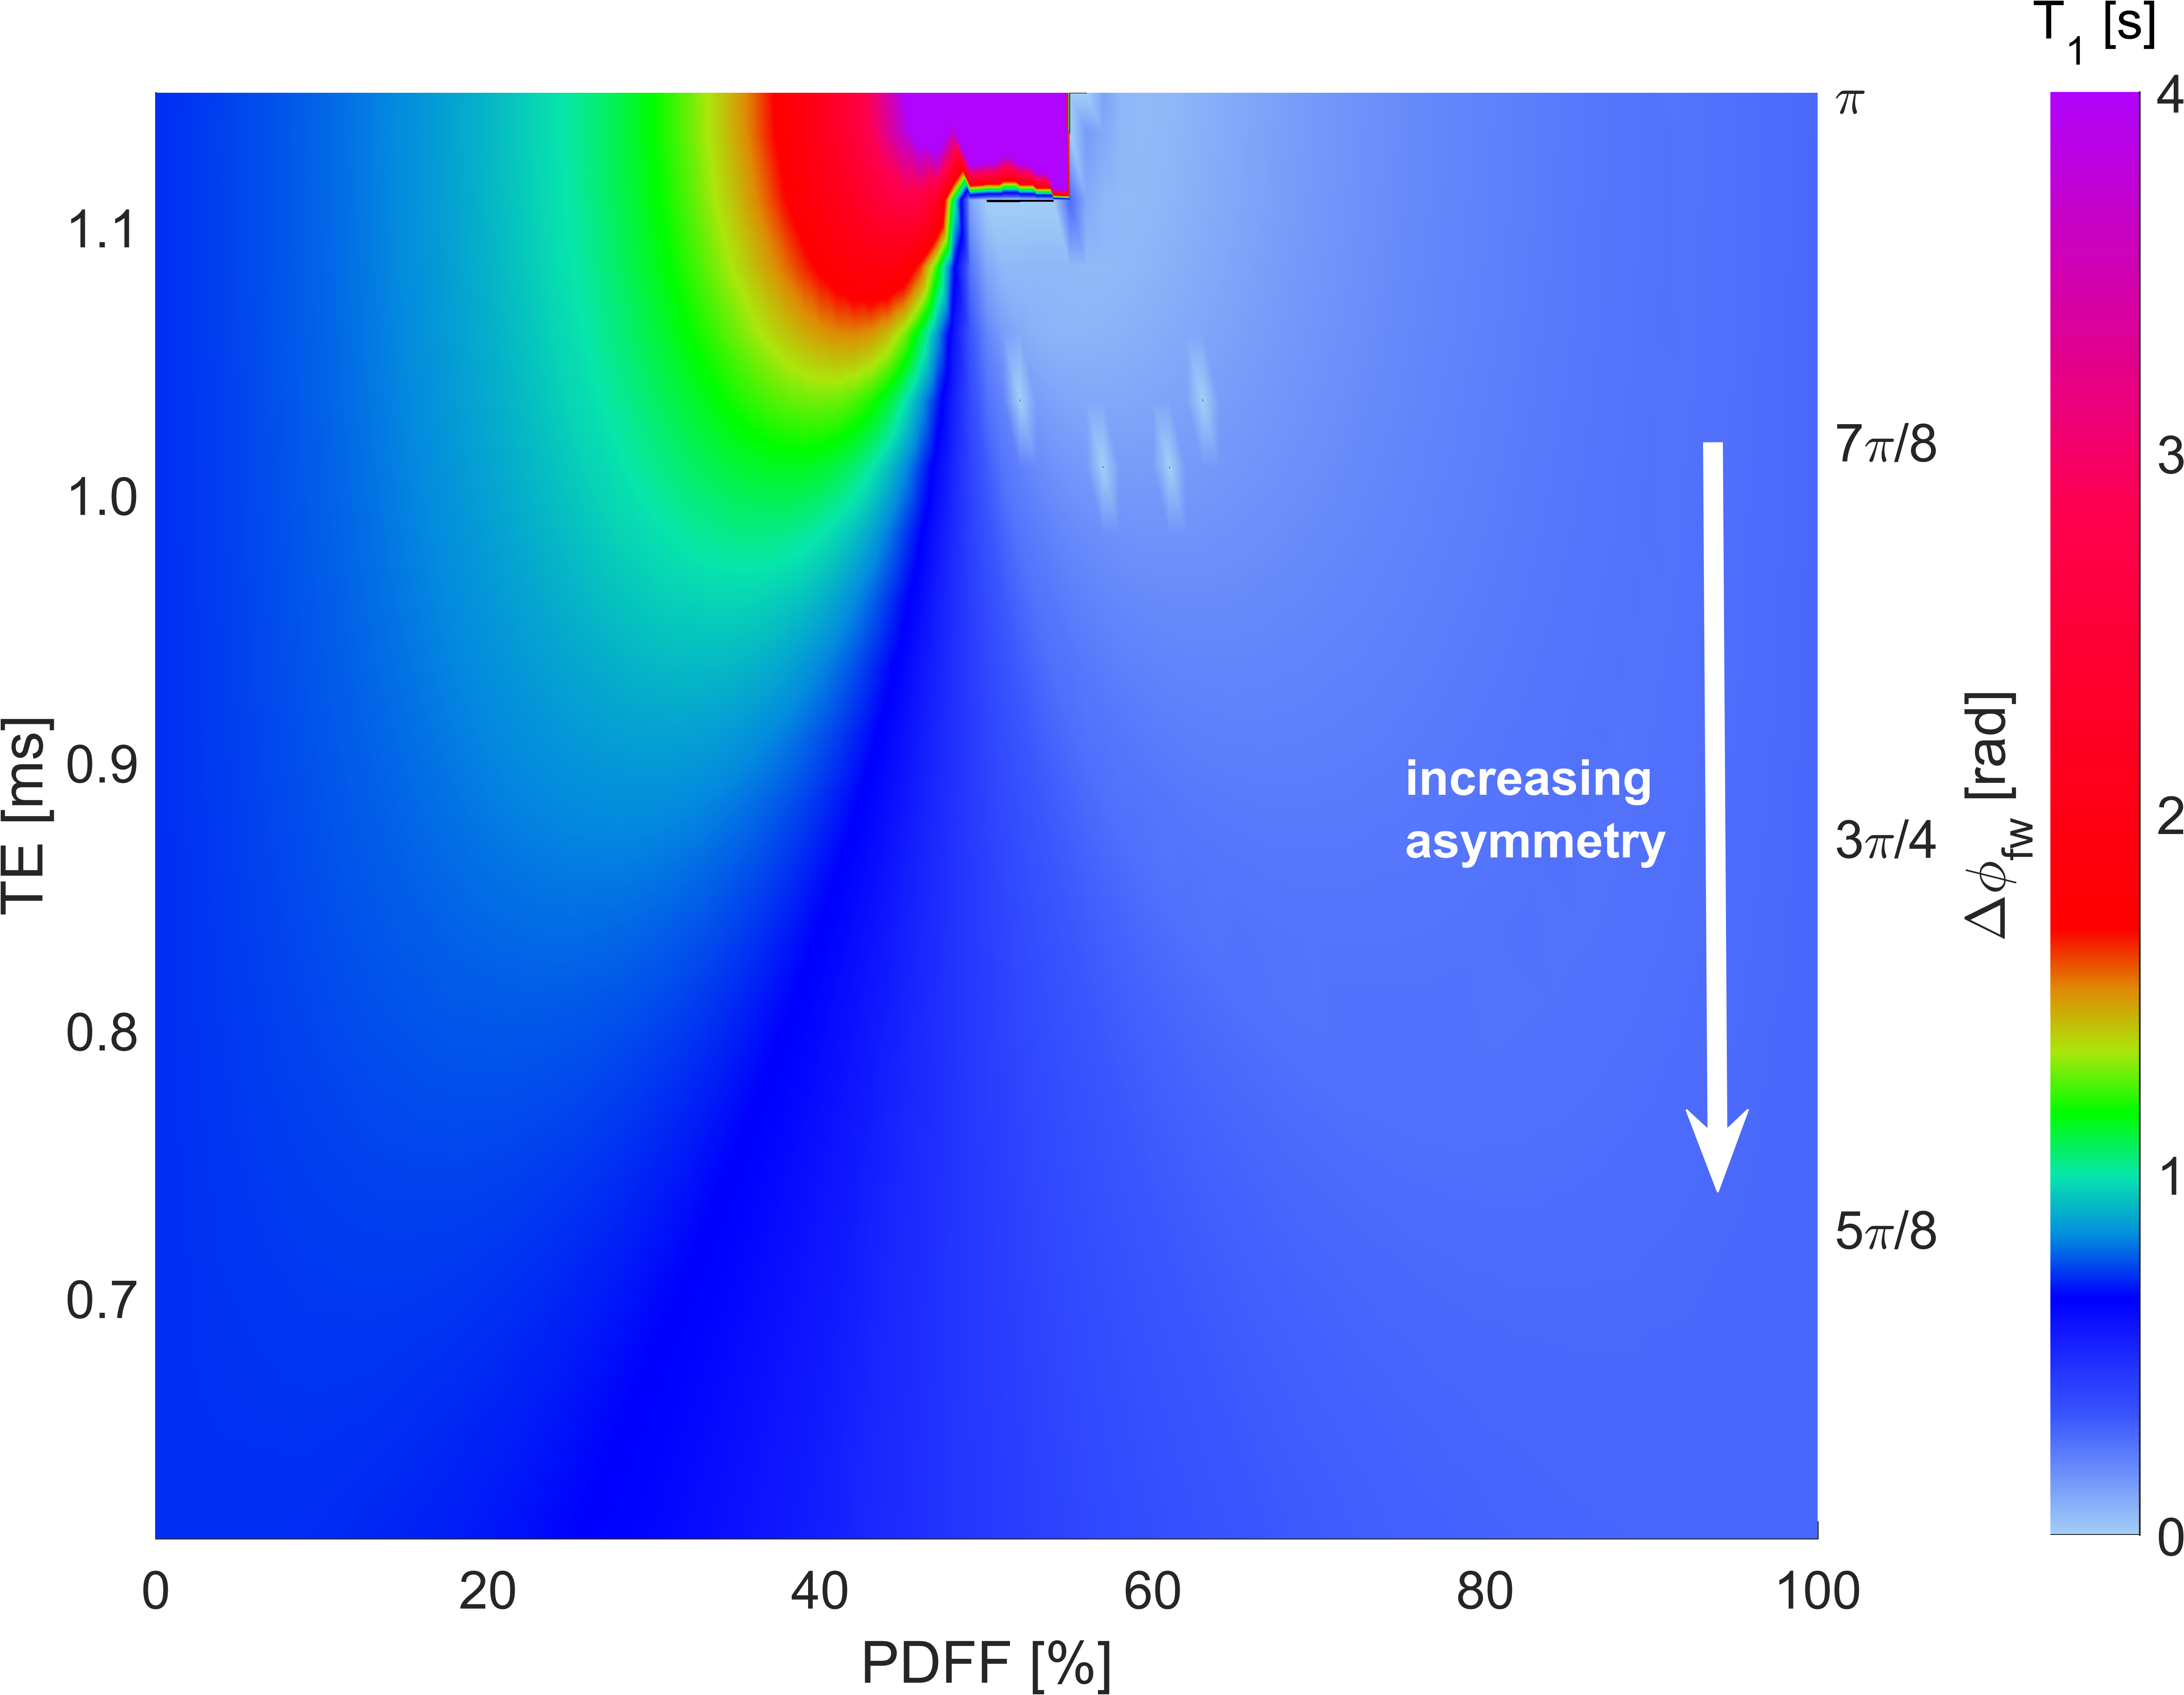
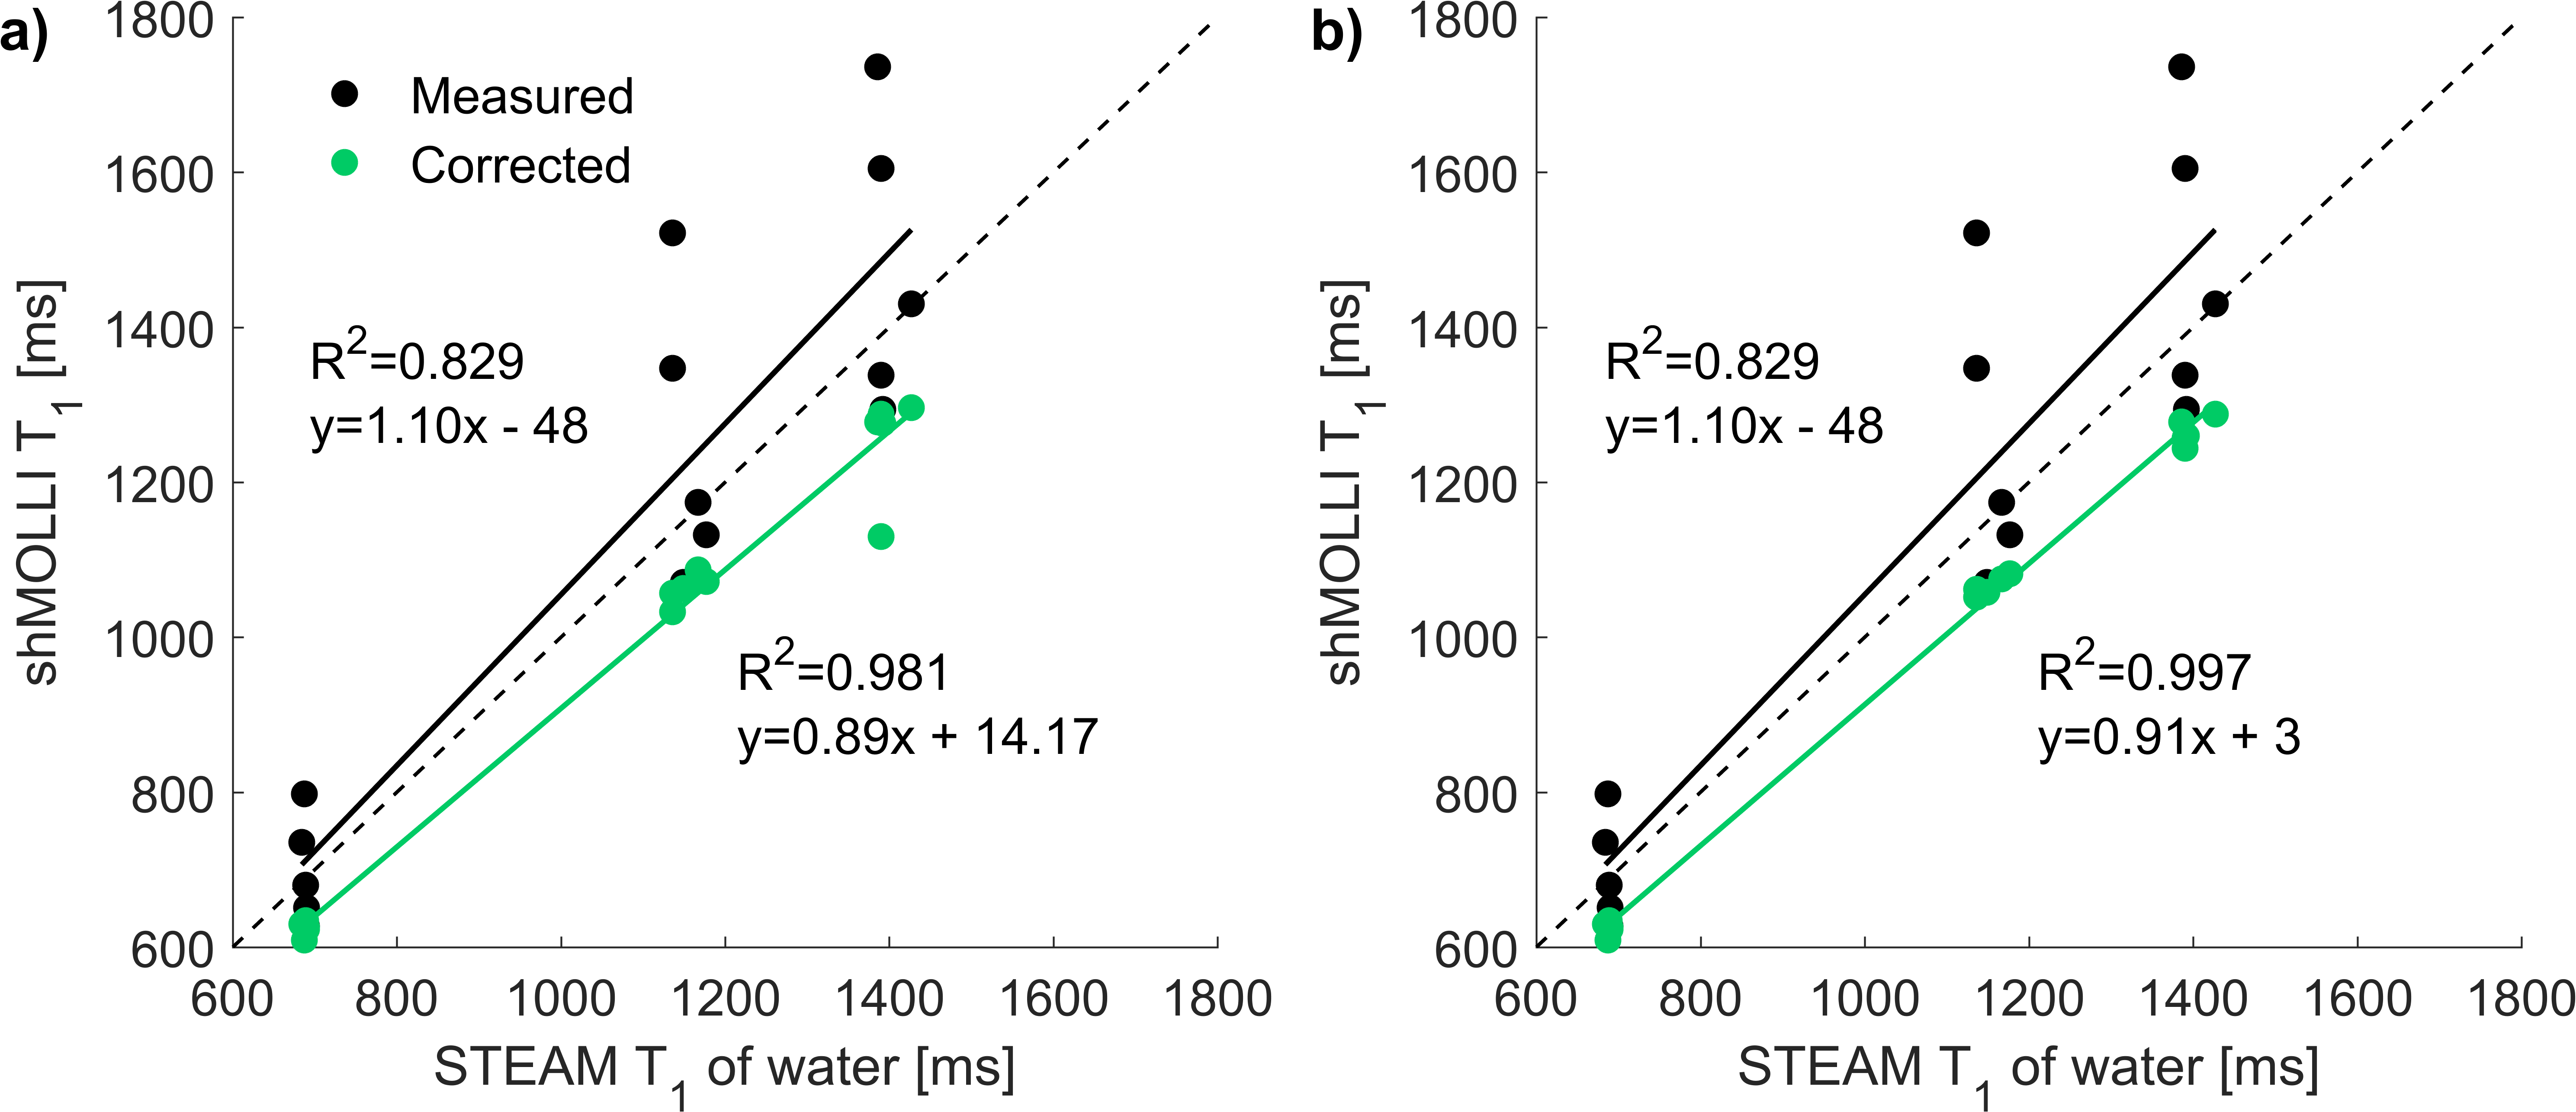
Figure 1 shows the results of the simulation. Increasing echo asymmetry results in a “milder” overestimation of combined water-fat T1 values and, at very short echo times, i.e. close to where bSSFP signals originating from water and the main fat peak are orthogonal, shorter combined T1 values might result than the T1 of the water component. The results of the phantom experiments and the fat correction algorithm also suggest that using the correct echo time, i.e. the one used during the acquisition, is essential to successfully remove the effects of fat from combined T1 values. As figure 2 shows, the coefficient of determination (R2) between STEAM T1 values of the water component in phantoms and corrected shMOLLI T1 increased from 0.829 to 0.997, when using the correct echo time.Discussion
By choosing a TR=1/δ (δ being the chemical shift difference between water and the methylene peak of the fat), the bSSFP transition bands of water and fat are matched, i.e. water and fat will have opposing phase. Simulations have shown that the choice of echo time in shMOLLI experiments affects the phase relationship between water and fat, leading to under- or overestimation of shMOLLI T1 values, without a consistent trend over the simulated range of fat fractions. The influence of fat is maximized by the use of a symmetric echo (TE=TR/2) and a TR where the water and the fat are out of phase. When imaging fatty livers, this complex mechanism might lead to a seemingly normal or abnormally high liver (sh)MOLLI T1 competing with or amplifying the effects of inflammation and fibrosis. This problem can be mitigated by correcting (sh)MOLLI T1 measurements for the effect of fat.Conclusion
Both the echo time and the repetition time of in vivo (sh)MOLLI experiments must be carefully chosen in liver imaging. The resulting liver T1 maps should be interpreted with care and correction of the effects of fat should be considered along with correction for iron and off-resonance frequency.Acknowledgements
The research was funded by a UK Medical Research Council Doctoral Training Award (MR/K501256/1), a Scatcherd European Scholarship, the RDM Scholars Programme, and by the National Institute for Health Research (NIHR) Oxford Biomedical Research Centre Programme. The views expressed are those of the authors and not necessarily those of the NHS, the NIHR or the Department of Health. Parts of this work are the subject of a UK patent application.References
1. Robson, M. D., Piechnik, S. K., Tunnicliffe, E. M. & Neubauer, S. T1 measurements in the human myocardium: The effects of magnetization transfer on the SASHA and MOLLI sequences. Magn. Reson. Med. 670, 664–670 (2013).
2. Kellman, P., Herzka, D. a, Arai, A. E. & Hansen, M. S. Influence of Off-resonance in myocardial T1-mapping using SSFP based MOLLI method. J. Cardiovasc. Magn. Reson. 15, 63 (2013).
3. Piechnik, S. K. et al. Shortened Modified Look-Locker Inversion recovery (ShMOLLI) for clinical myocardial T1-mapping at 1.5 and 3 T within a 9 heartbeat breathhold. J. Cardiovasc. Magn. Reson. 12, 69 (2010).
4. Deichmann, R. & Haase, A. Quantification of T1 values by SNAPSHOT-FLASH NMR imaging. J. Magn. Reson. 96, 608–612 (1992).
5. Tunnicliffe, E. M., Banerjee, R., Pavlides, M., Neubauer, S. & Robson, M. D. A model for hepatic fibrosis: the competing effects of cell loss and iron on shortened modified Look-Locker inversion recovery T1 (shMOLLI-T1) in the liver. J. Magn. Reson. Imaging (2016). doi:10.1002/jmri.25392
6. Banerjee, R. et al. Multiparametric magnetic resonance for the non-invasive diagnosis of liver disease. J. Hepatol. 60, 69–77 (2014).
7. Hoad, C. L. et al. A study of T1 relaxation time as a measure of liver fibrosis and the influence of confounding histological factors. NMR Biomed. 28, 706–714 (2015).
8. Kellman, P. et al. Characterization of myocardial T1-mapping bias caused by intramyocardial fat in inversion recovery and saturation recovery techniques. J. Cardiovasc. Magn. Reson. 17, 33 (2015).
9. Mozes, F. E., Tunnicliffe, E. M., Pavlides, M. & Robson, M. D. Influence of fat on liver T1 measurements using modified Look-Locker inversion recovery (MOLLI) methods at 3T. J. Magn. Reson. Imaging 44, 105–111 (2016).
10. Mozes, F. E. et al. Determining the T1 of the water in the liver by modelling the effects of fat, iron and off-resonance frequencies on MOLLI T1 measurements. in Proc. Intl. Soc. Mag. Reson. Med. 25 367 (2017).
11. Hamilton, G. et al. In vivo characterization of the liver fat 1H MR spectrum. NMR Biomed. 24, 784–90 (2011).
12. Hernando, D., Kellman, P., Haldar, J. P. & Liang, Z.-P. Robust water/fat separation in the presence of large field inhomogeneities using a graph cut algorithm. Magn. Reson. Med. 63, NA-NA (2009).
13. Hamilton, G. et al. In vivo breath-hold 1H MRS simultaneous estimation of liver proton density fat fraction, and T1 and T2 of water and fat, with a multi-TR, multi-TE sequence. J. Magn. Reson. Imaging 42, 1538–1543 (2015).
Figures