4974
Investigating the T1 of human venous blood at 7T in patients with diabetes, metabolic syndrome and healthy subjects.1Department of Cognitive Neuroscience, Maastricht University, Maastricht, Netherlands, 2Centre for Functional and Metabolic Mapping, University of Western Ontario, London, ON, Canada, 3Center for Neuroscience Imaging Research, Institute for Basic Science, Suwon, Korea, Republic of
Synopsis
Blood T1 values are important to accurately quantify perfusion with arterial spin labeling and to determine the optimal inversion time for vascular space occupancy and black-blood imaging. In this work, we demonstrate that a post-hoc B1+-corrected MP2RAGE sequence can be used to measure the subject-specific T1 of blood in the superior sagittal sinus at 7T, eliminating the need for additional dedicated measurement. The approach was applied in patients with diabetes, metabolic syndrome and healthy controls to examine the influence of these conditions on the respective T1 of blood. The method proposed can be employed at any field strength.
Introduction
Precise knowledge of the T1 of blood is essential to accurately quantify perfusion with arterial spin labeling (ASL), and to determine the optimal inversion time for vascular space occupancy (VASO) and black-blood imaging. Previous methods to determine the blood T1 include in vitro [1-3] and in vivo measurements [4-7] as well as biophysical modelling [8,9]. T1 of blood depends on the magnetic field strength, hematocrit proportion, oxygenation (percentage of deoxyhemoglobin) and presence of methemoglobin. Until now, blood T1 measurements have mostly been performed in neonates, healthy young and middle-aged volunteers or patients with sickle-cell anemia. The dedicated measurements could be performed either on venous or arterial T1, but the optimal acquisition approaches for these differ due to the change in blood velocity across the vascular tree. Blood T1 measurements on other patients have not been pursued due to time constraints and lack of specific hypotheses concerning particular diseases’ effects. In this work, we investigate the utility of MP2RAGE [10] data corrected for B1+-inhomogeneity to obtain venous blood T1 measurements in a large cohort of healthy adults and patients with diabetes and metabolic syndrome.Methods
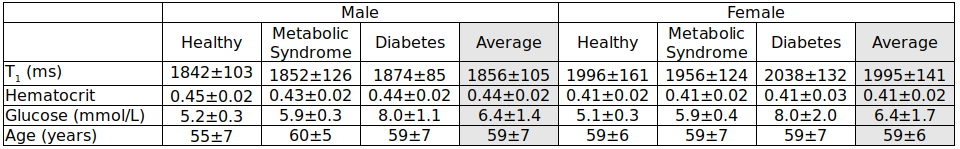
MRI data from 131 adults (ages between 40 and 69 years) were acquired using whole‐body 7T scanner (Siemens Healthineers, Erlangen, Germany) and 32‐channel phased‐array head coil (Nova Medical, Wilmington, MA, USA) after obtaining written informed consent. The cohort consisted of 70 males and 61 females; 44 patients with type 2 diabetes, 44 patients with metabolic syndrome and 43 healthy age-matched controls. High-resolution (0.7 mm isotropic) whole‐brain quantitative T1 images were obtained with the MP2RAGE sequence, and the Sa2RAGE sequence [11] was used to map B1+ (2 mm isotropic) across the brain. MP2RAGE data were acquired with TR/TE = 5000/2.47 ms, TI1/TI2 = 900/2750 ms, α1/α2 = 5°/3° and GRAPPA = 3 in the phase‐encoding (PE) direction. For the Sa2RAGE, the parameters were: TR/TE = 2400/0.78 ms, TD1/TD2 = 58/1800 ms, α1/α2 = 4°/11°, and GRAPPA = 2 in the PE direction. The B1+-correction of the MP2RAGE T1 maps was performed according to [12]. The sagittal sinus was chosen as the region of interest (ROI) for the blood T1 determination due to its large cross-sectional area and relatively constant low blood velocity [5]. ITK-snap [13] was used to manually segment the ROIs and a mean venous T1 value was obtained for each subject. Hematocrit and blood glucose were measured using a blood draw on a separate day. Statistical analyses were performed using SPSS 25.Results
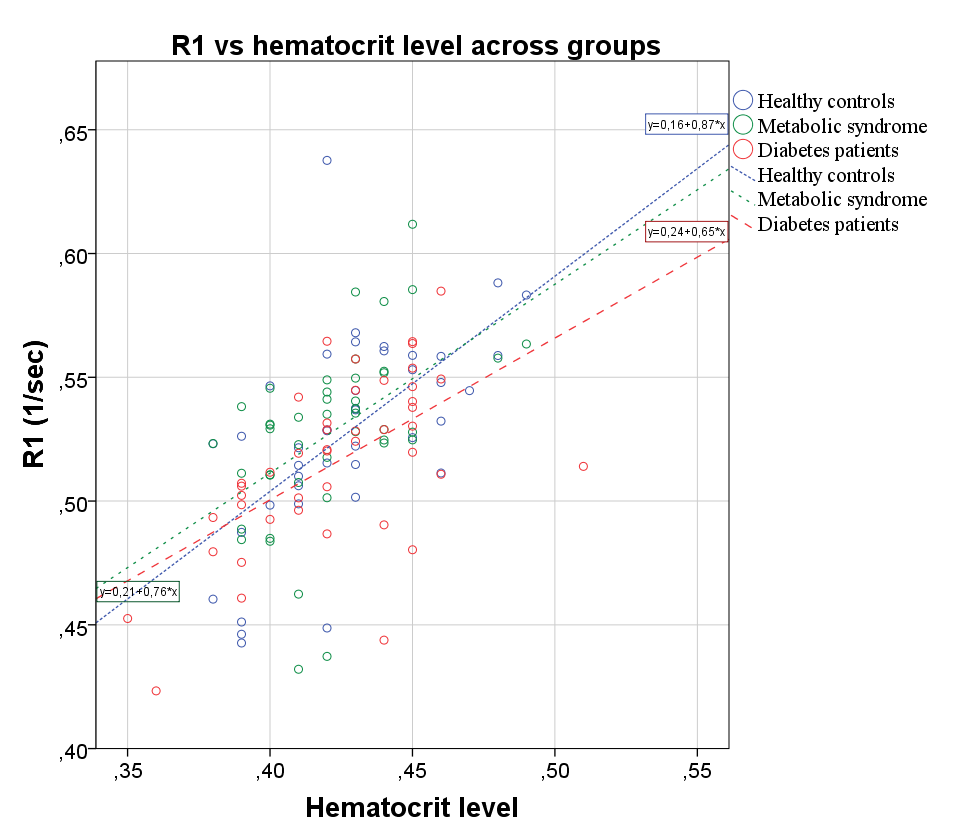
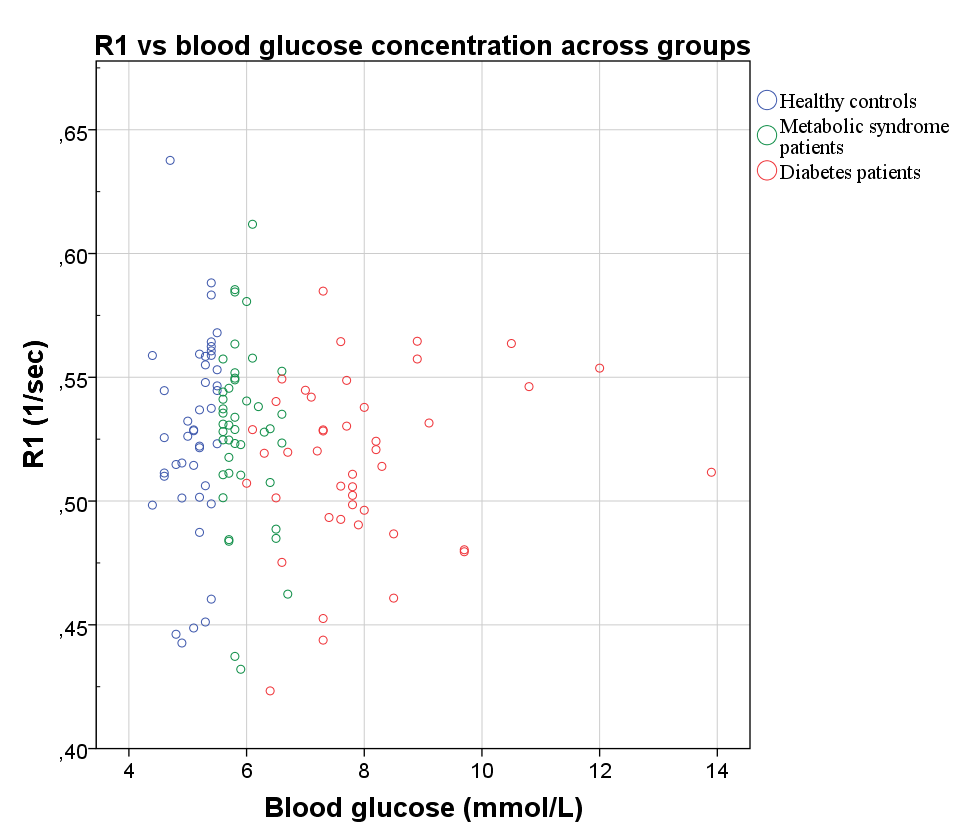
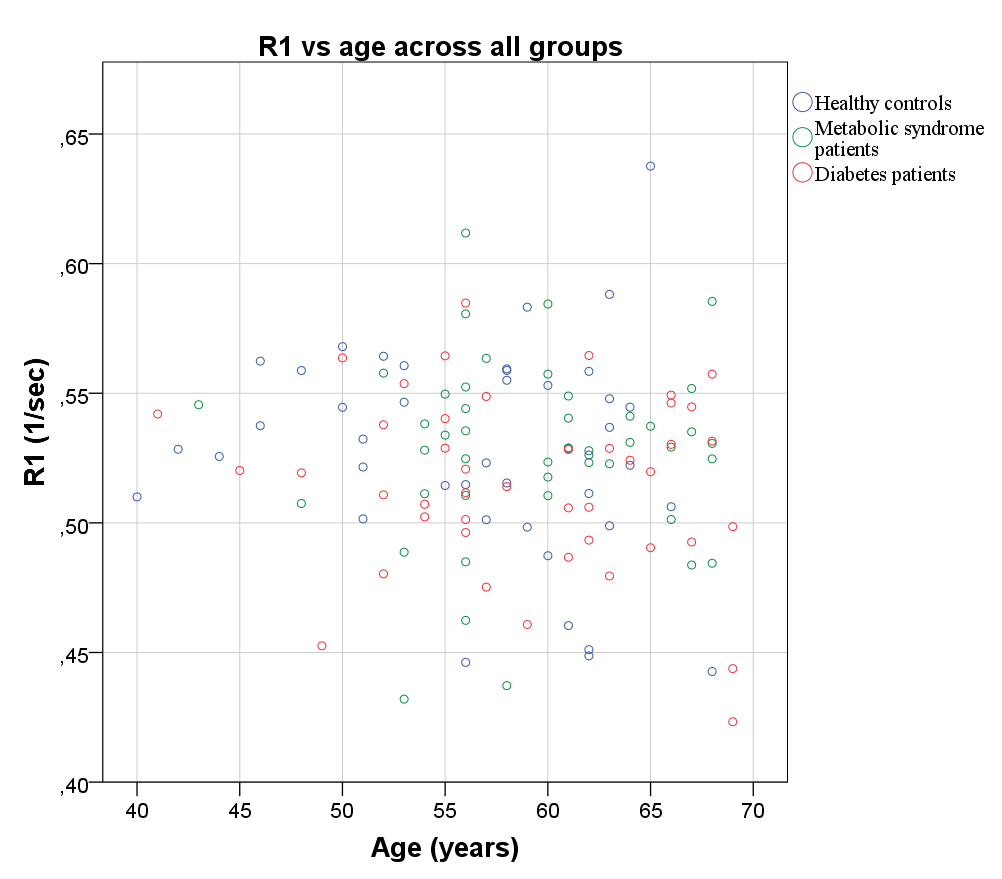
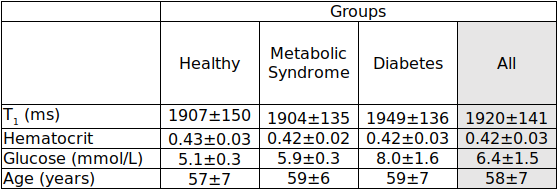
The three subject groups significantly differed only in their blood glucose level, but not in their sex, age and hematocrit values (see Table 1 and 2). The blood glucose level for the healthy controls was: 5.1±0.3 mmol/L, for the metabolic syndrome group: 5.9±0.3 mmol/L and for the diabetes patients: 8.0±1.6 mmol/L. The blood T1 values were consistently longer in females than in males, irrespective of whether they were patients or controls. This can be attributed to the usually higher hematocrit in males than in females. A statistically significant dependence of blood R1 (=1/T1) on hematocrit was found (Figure 1). No statistically significant dependence of blood R1 on age and blood glucose level were found in either men, women or the whole cohort (Figures 2 and 3).Discussion
The presented T1 values fall within the range of previous 7T reports from a much smaller group of healthy younger volunteers (2087±131 ms) obtained using a dedicated blood T1 measurement [6]. The reported venous T1 values are slightly lower, but generally in line with the theoretical predictions in [8] (1945-2116 ms for males and 2043-2193 ms for females). The R1 dependence on hematocrit is well documented and drives the T1 differences between genders. The lack of influence of blood glucose level on T1 and age are novel findings, but consistent with the theory of blood relaxivity [8]. Remaining known sources of variance for blood’s venous T1 for a given hematocrit value include blood oxygenation and the amount of methemoglobin, which were not measured here. Increased levels of methemoglobin shorten the blood’s T1 and are caused by certain oxidizing substances or some medications. Future work should estimate the effect size of methemoglobin on blood T1, while inaccuracies due to unknown blood oxygenation should not exceed 3%. The results presented support the validity of the proposed approach to measure venous T1 using a B1+-corrected MP2RAGE acquisition.Conclusion
B1+-corrected T1 maps from the MP2RAGE sequence can be used to reliably determine the venous T1 in the sagittal sinus. The presented approach is time-efficient and can be applied at any field strength.Acknowledgements
This research has been financially supported by VIDI grant (452-11-002) to KU.References
1 Dobre MC, Ugurbil K, Marjanska M. Determination of blood longitudinal relaxation time (T1) at high magnetic field strengths. Magn Reson Imaging. 2007; 25:733–735.
2 Grgac K, van Zijl PCM, Qin Q. Hematocrit and oxygenation dependence of blood (1)H2O T1 at 7 tesla. Magn Reson Med. 2013; 70:1153–1159.
3 Blockley NP, Jiang L, Gardener AG, Ludman CN, Francis ST, Gowland PA. Field strength dependence of R1 and R2* relaxivities of human whole blood to ProHance, Vasovist, and deoxyhemoglobin. Magn Reson Med. 2008; 60:1313–1320.
4 Rane SD, Gore JC. Measurement of T1 of human arterial and venous blood at 7T. Magn Reson Imaging. 2013; 31:477–9.
5 Varela M, Hajnal JV, Petersen ET, Golay X, Merchant N, Larkman DJ. A method for rapid in vivo measurement of blood T1. NMR Biomed. 2011; 24:80–8.
6 Zhang X, Petersen ET, Ghariq E, De Vis JB, Webb AG, Teeuwisse WM, Hendrikse J, van Osch MJP. In vivo blood T1 measurements at 1.5 T, 3 T, and 7 T. Magn Reson Med. 2012; 70:1082–1086.
7 Qin Q, Strouse JJ, van Zijl PCM. Fast measurement of blood T1 in the human jugular vein at 3 Tesla. Magn Reson Med. 2011; 65:1297–304.
8 Li W, Grgac K, Huang A, Yadav N, Qin Q, van Zijl PC. Quantitative theory for the longitudinal relaxation time of blood water. Magn Reson Med. 2016; 76:270-81.
9 Rooney WD, Johnson G, Li X, Cohen ER, Kim S-G, Ugurbil K, Springer CS. Magnetic field and tissue dependencies of human brain longitudinal 1H2O relaxation in vivo. Magn Reson Med. 2007; 57:308–18.
10 Marques JP, Kober T, Krueger G, van der Zwaag W, Van de Moortele PF, Gruetter R. MP2RAGE, a self bias‐field corrected sequence for improved segmentation and T1‐mapping at high field. NeuroImage 2010; 49:1271–1281.
11 Eggenschwiler F, Kober T, Magill AW, Gruetter R, Marques JP. SA2RAGE: A new sequence for fast B1+ ‐mapping. Magn Reson Med. 2012; 67:1609–1619.
12 Haast RAM, Ivanov D, Uludağ K. The impact of B1+ correction on MP2RAGE cortical T1 and apparent cortical thickness at 7T. Hum Brain Mapp. 2018; 39:2412-2425.
Figures