4973
Time efficient T1 measurement of Cortical Bone using a Three-Dimensional Ultrashort Echo Time Cones Variable Flip Angle-Actual Flip Angle Imaging (3D UTE-Cones VFA-AFI) method1Department of Radiology, University of California, San Diego, San Diego, CA, United States, 2Department of Biomedical Engineering, Tsinghua University, Beijing, China, 3Radiology Service, San Diego Healthcare System, San Diego, CA, United States
Synopsis
To reduce scan time and maintain the accuracy of T1 measurement for cortical bone, we propose a novel T1 measurement approach using three-dimensional ultrashort echo time cones variable flip angle (3D UTE-Cones VFA) with actual flip angle imaging (AFI) technique for the correction of B1 inhomogeneity. The results show the similar bone T1 values were obtained by the proposed fast 3D UTE-Cones AFI-VFA method compared with the previous UTE-Cones AFI and variable TR method.
Introduction
Three-Dimensional ultrashort echo time cones actual flip angle imaging with variable repetition time (3D UTE Cones AFI-VTR) method is considered as a feasible technique to accurately measure T1 of short T2 cortical bone1. However, relatively long scan time is required due to different combinations of TRs during data acquisition for the VTR method. Shorter scan time can be achieved via the variable flip angle (VFA) method with a relatively short TR. Low flip angles (<30°) with a short hard excitation pulse with less 80 μs are necessary to maintain sufficient excitation efficiency for as cortical bone2. However, AFI based B1 mapping always needs a high flip angle (no less than 40°) to get the accurate B1 estimation. Then the RF pulse duration is relatively longer, thus excitation inefficiency is low for short T2 cortical bone, which will cause inaccurate B1 estimation. Therefore, the inaccurate B1 can’t be used for VFA based T1 measurement for cortical bone. To overcome these challenges, we propose two accurate B1 mapping methods to correct the VFA based T1 measurement: one is to use the B1 map derived from the pore water component (with a T2* longer than 2ms), the other is to use the B1 map of surrounding soft tissues to estimation the B1 in cortical bone based on the spatially smooth character of B1.Methods
A rectangular hard pulse with a short RF pulse duration is used for excitation in UTE-Cones sequence, followed by 3D spiral trajectories. The ratio r of $$$S_{2}$$$ and $$$S_{1}$$$ can be simplified by a first-order approximation to the exponential terms1,3:
$$r=\frac{S_{2}}{S_{1}}\approx\frac{1+ncos(\alpha)}{n+cos(\alpha)}\quad[1]$$where$$$n=TR_{2}/TR_{1}$$$and it is easy to get B1 scaling factor1:$$B_{1s}=\alpha/\alpha_{nom}\quad[2]$$where$$$\alpha\approx\arccos(\frac{rn-1}{n-r})$$$can be calculated from Eq.[1],$$$\alpha_{nom}$$$ is the expected flip angle. Since the pore water T2* is no less than 2ms which is much longer than the excitation pulse in AFI (i.e. 150 us), the pore water B1 map will not suffer enough excitation efficiency. As T2* of bound water is pretty short around 0.3ms, UTE-Cones-AFI sequence with a relatively longer TE of 2.2ms is utilized to obtain the B1 mapping from pore water (bound water signals are not received due to the fast signal decay).
The signal acquired by the regular 3D UTE-Cones with a TE of 0.032ms for VFA based T1 measurement is expressed as1:$$S_{spgr}=M_{0}sin(\theta)\frac{1-E}{1-Ecos(\theta)}\quad[3]$$where$$$E=exp(-TR_{s}/T_{1})$$$,$$$\theta=B_{1s}*\alpha_{nom}$$$. $$$TR_{s}$$$is the repetition time of the UTE-Cones sequence.
T1 of short T2 tissues can be obtained by fitting Eq. [3] with 3D UTE-Cones VFA data. For bovine cortical bone chip T1 measurement, a homemade 30ml birdcage coil was used for the scan with a high SNR performance. The 3D UTE Cones AFI-VTR method with a fixed TRs (20/50/100/160ms for VTR and TR1/TR2 = 20/100ms for AFI) and flip angle (45°) is conducted as a reference. VFA data is collected with flip angle = 2/4/8/12/16°, RF duration = 46μs and TR = 8ms.
Longer TR (12ms), higher flip angle (2/4/8/12/16/20°) and RF duration (56μs) are selected when dealing with in vivo cases. For in vivo cortical bone T1 measurement, pore water SNR is pretty low, which makes it difficult to get high-quality B1 maps from the pore water. So we proposed the second method to estimate the spatially smooth B1 map by fitting B1 scaling factors in long T2 tissue regions. A low-order polynomial function is used for fitting. All mentioned methods are implemented on a 3T GE MR750 scanner.
Results and Discussion
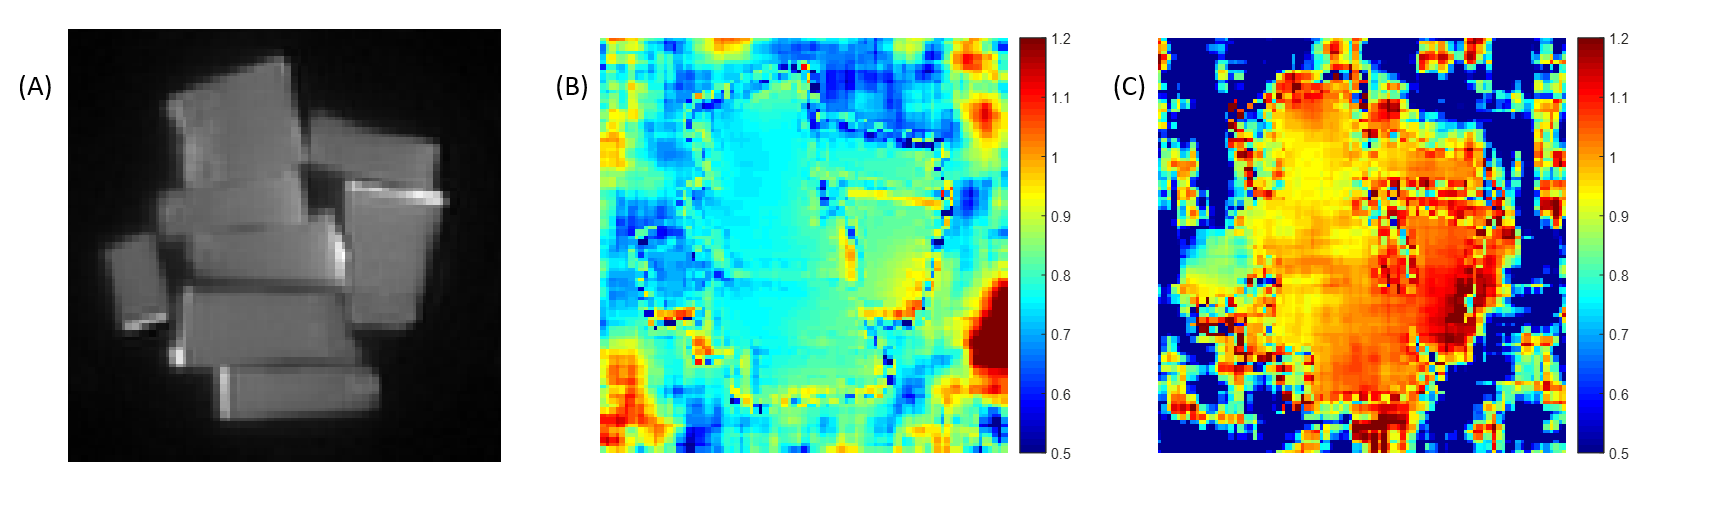
Figure 1 suggests a more accurate B1 map (closer to 1) calculated by the second echo of AFI (TE=2.2ms) than the first echo (TE=0.032ms).
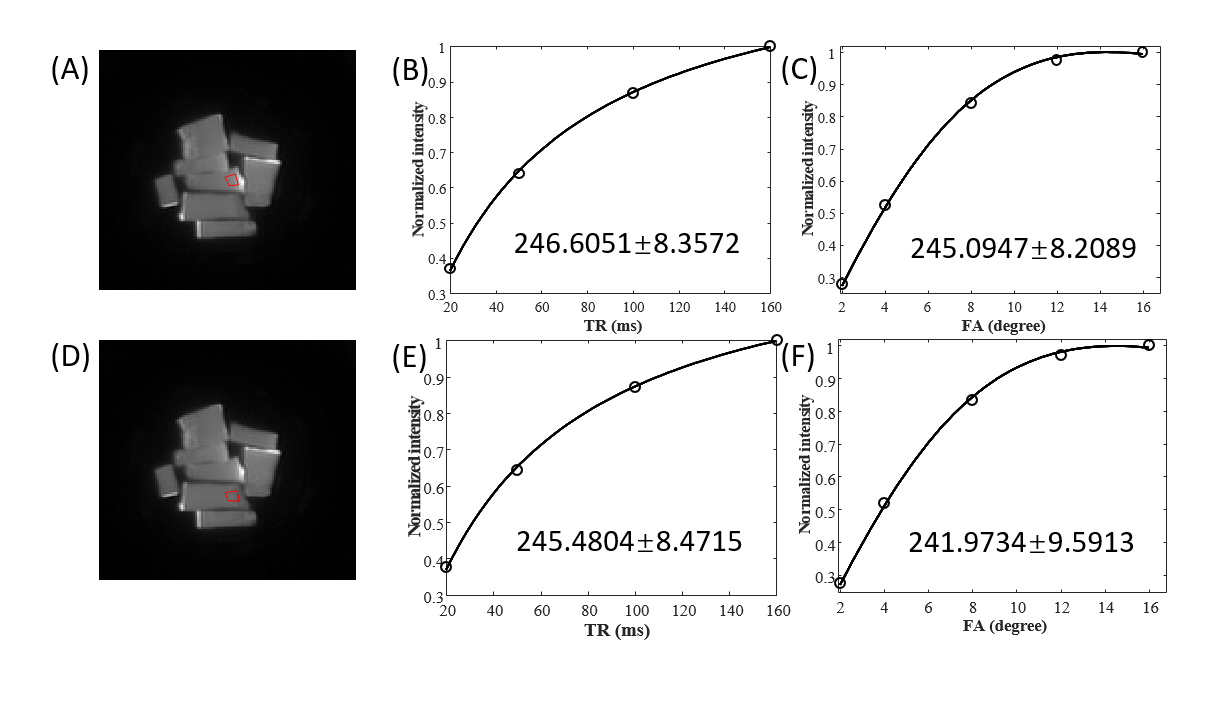
Figure 2 shows T1 measurement from two regions of interest (ROIs) of cortical bone chips (Fig. 2A, Fig. 2D). Both of the curves in each ROI shows the right trend to reach optimal Ernst angle, which suggests the feasibility of 3D UTE-Cones VFA-AFI method.
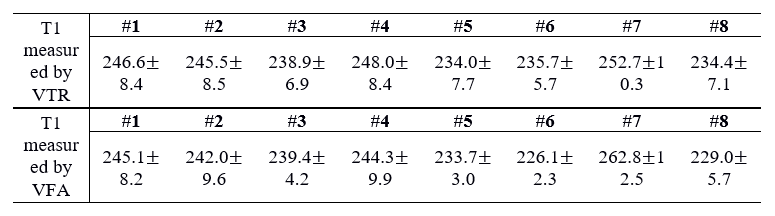
Table 1 summarized the T1 values measured by 3D UTE-Cones AFI-VTR and 3D UTE-Cones VFA-AFI (n=8), the difference of T1 values calculated by two methods for the same ROI of each chip is within 10ms. This suggested that the VFA based T1 measurement with a much less scan time (10-15 mins) can get reasonable T1 values compared with the VTR method with a much longer scan time (40-50 mins).
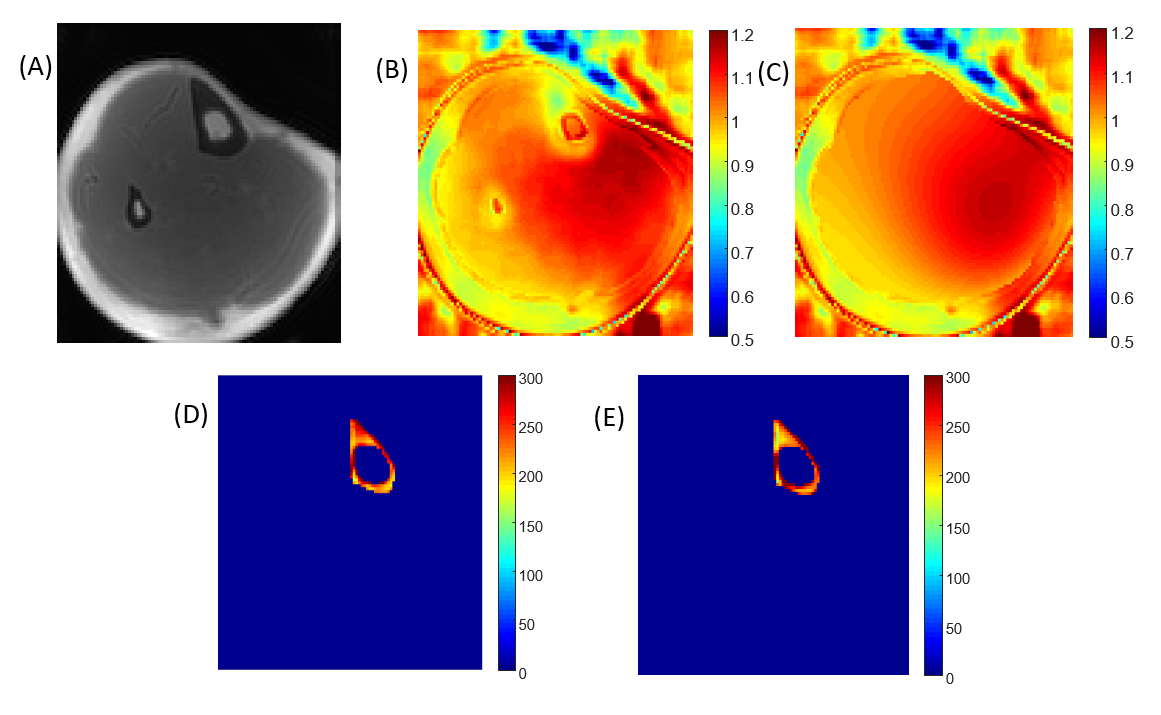
Figure 3 shows the B1 fitting and T1 mapping results for a tibial cortical bone (a healthy 21-year-old male). T1 values obtained by the 3D UTE-Cones VFA-AFI method are close to the T1 measured by 3D UTE-Cones AFI-VTR after fitting B1 scaling factors are used during correction.
Conclusion
3D UTE-Cones AFI-VFA method is a time-efficient approach to obtain accurate T1 measurement for cortical bone compared with AFI-VTR method.Acknowledgements
We thank the grant support from GE, NIH (1R21AR073496, R01AR068987) and the VA Clinical Science and Rehabilitation R&D Awards (I01CX001388 and I01RX002604)References
1. Ma, Y. J., Lu, X., Carl, M., Zhu, Y., Szeverenyi, N. M., Bydder, G. M., ... & Du, J. (2018). Accurate T1 mapping of short T2 tissues using a three‐dimensional ultrashort echo time cones actual flip angle imaging‐variable repetition time (3D UTE‐Cones AFI‐VTR) method. Magnetic resonance in medicine, 80(2), 598-608.
2. Du J, Bydder GM. Qualitative and quantitative ultrashort-TE MRI of cortical bone. NMR Biomed 2013;26:489-506.
3. Yarnykh VL. Actual flip-angle imaging in the pulsed steady state: a method for rapid three-dimensional mapping of the transmitted radiofrequency field. Magn Reson Med 2007;57:192–200.
Figures