4971
Observation and Mitigation of Magnetization Transfer Effects in the two-point 3D Variable Flip Angle T1 Mapping Technique at 3T1Medical Physics, Cancer Centre of Southeastern Ontario, Kingston, ON, Canada, 2Biomedical Engineering, University of Alberta, Edmonton, AB, Canada, 3Oncology, University of Alberta, Edmonton, AB, Canada, 4Medical Physics, Cross Cancer Institute, Edmonton, AB, Canada
Synopsis
The Variable Flip Angle (VFA) T1 mapping technique has been employed extensively in the past given its high contrast-to-noise ratio per unit scan time. However, its sensitivity to B1 field inhomogeneity and imperfect spoiling hinders its reproducibility among different scanners and imaging centers. In this study, we investigate the impact of magnetization transfer (MT) effects in a 3D VFA technique using fixed flip angles, while varying B1 amplitudes and durations, following corrections for non-ideal RF spoiling and RF inhomogeneity. We show that via careful tuning of the RF pulse amplitudes and durations, MT effects can be mitigated, yielding T1 measurements that match closely with a gold-standard IR-EPI technique.
Introduction
Recently, the impact of on-resonance magnetization transfer has been investigated in several T1 mapping techniques (e.g., MP2RAGE and IR-FSE [1]), to improve their reproducibility and accuracy [2]. Ou et al [3] reported MT effects in 2D (slice-selective) variable flip angle (VFA) T1 quantification, which resulted in a systematic underestimation of the true T1. In the 3D (non-selective) two-point VFA technique, some authors have obtained accurate T1 maps (that agreed closely with gold-standard inversion recovery) after correcting for both flip-angle inhomogeneity and non-ideal RF spoiling [4], while others have observed a remaining yet unknown source of bias [2], [5]. In this study, we investigate the impact of MT effects (which we suspect to be this remaining source of bias) in a 3D VFA technique using fixed flip angles, while varying B1 amplitudes and durations, following corrections for non-ideal RF spoiling and RF inhomogeneity.Methods
Four healthy volunteers (ages 20-30) were scanned (after informed consent and ethics approval) on a Philips Achieva 3T scanner using 3D 9-echo (bipolar) VFA protocols (see Table 1). The T1 was solved from the slope of the linearized Ernst equation:
$$ \frac{S_{ME}}{sin(c_{RF}^{+} α_{nom} )} =E_{1} \frac{S_{ME}}{tan(c_{RF}^{+} α_{nom} )}+c_{RF}^{-} M_0 (1-E_1 ) \sqrt{\sum_{n=1}^9e^{-2TE_n/T_2^*}}$$,
where SME is the combined signal (root-sum-of-squares) of the 9 echoes, cRF+ is the ratio of the local to nominal flip angle (αnom), E1=exp(-TR/T1), M0 is the proton density and cRF- is the receiver coil profile. From this equation, it can be shown that the T1app (T1 solved by assuming cRF+=1) is related to the true T1 by $$$T_1^{app}\approx (c_{RF}^+)^2 T_1$$$. All scan parameters were kept identical in three versions of the sequence except that the duration and amplitude of the rectangular (non-selective) RF pulses were varied. Correction for the non-ideal RF spoiling was performed using the technique of Preibisch and Deichmann [5]. To guarantee the accuracy of the B1 maps, two independent B1 mapping sequences were acquired for comparison: Actual Flip angle Imaging (AFI) [6] and the Saturated Double Angle Method (SDAM) [7].The B1 field was also simulated using Ansys HFSS on a rectangular phantom (with two different NaCl concentrations) placed inside a T/R birdcage coil and compared to phantom VFA, AFI and SDAM measurements. To compare the in vivo VFA T1 with inversion recovery, a single-slice (encompassing important brain ROIs) 8-point IR-EPI sequence was also tested on the 4 subjects (using the T1 mapping toolbox of Barral et al [8]). The T1 maps from the 3 VFA protocols were co-registered and compared with IR-EPI at TImin=20/200ms (including/avoiding MT effects).
Results
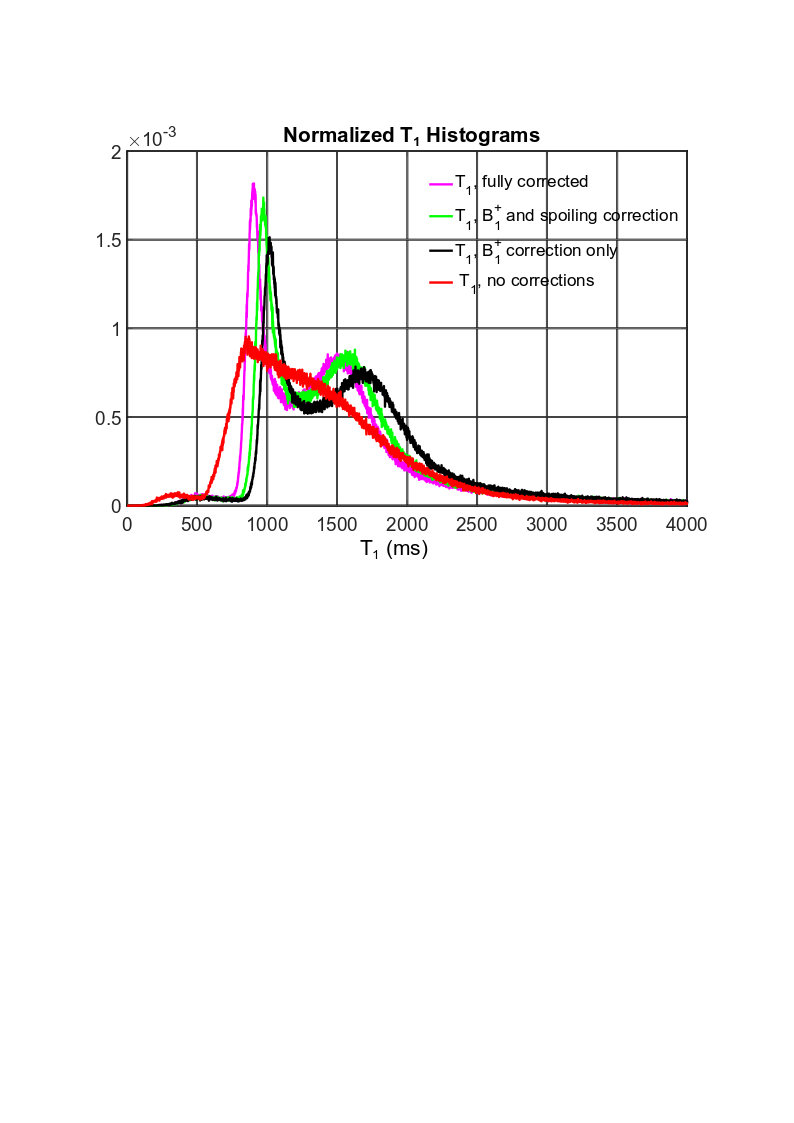
As shown in Figure 1, both AFI and SDAM yield a measured B1 field very comparable to the HFSS simulations, while the common assumption of $$$T_1^{app}\approx (c_{RF}^+)^2 T_1$$$ (without a spoiling correction) fails if using a phase-cycle increment of ϕ0=50°, especially in the low-loss phantom. Figure 2 demonstrates the significant impact of the different types of corrections on a whole-brain T1 histogram, while Figure 3 shows the axial-slice comparison of IR-EPI at TImin=20/200ms with VFA-SDAM at three different B1 amplitudes. The ROI T1 measurements in various brain regions (averaged across the 4 subjects) are tabulated for the different techniques in Table 2, demonstrating the close agreement (<0.5% difference between AFI and SDAM). As expected, varying the VFA B1 amplitude had no impact on the T1 map of a water phantom (<2% difference, not shown), where a single pool of liquid protons exists.Discussion
The impact of on-resonance magnetization effects on T1 in the VFA technique depends largely on the RF pulse duration and amplitude of the higher SPGR flip angle. Using high B1 amplitudes yields higher T1 (mean WM T1≈975ms) than IR-EPI at TImin=200ms, while low B1 amplitudes yield significantly lower T1 (WM T1≈830ms), which is consistent with the results of Ou et al [3]. Rioux et al [1] recommended using TImin>200ms at 3T to remove the shorter-decaying T1 component. Our results demonstrate that by adjusting the B1 amplitude and duration of the longer SPGR flip angle, VFA T1 measurements can be made to match closely with IR-EPI mono-exponential T1 in the brain.Conclusion
In this work, we have demonstrated that, in addition to B1 inhomogeneity and/or non-ideal RF spoiling, MT effects can also bias the resulting T1, depending on the RF durations (and, obviously, the flip angles). The three sources of bias explain the broad range in mean WM T1 reported at 3T: (~900ms [4] to ~1085ms [9], reproduced here in Figure 2) and must therefore be corrected. For better VFA T1 accuracy/reproducibility in the future, the SPGR pulse durations and flip angles should be specified and fine-tuned (e.g. B1≈6μT given α1/α2/TR≈5°/29°/24ms) to match the T1 obtained with IR-EPI (with TImin≥200ms).Acknowledgements
The authors wish to thank Dr. Keith Wachowicz for accelerating the MATLAB simulation code used to obtain the spoiling correction coefficients. We also thank the Alberta Cancer Foundation for funding, Philips Healthcare for technical support, Dr. Roger Luechinger for the PATI program used for data transfer, as well as all volunteers who took part in this study.References
[1] J. A. Rioux, I. R. Levesque, and B. K. Rutt, “Biexponential longitudinal relaxation in white matter: Characterization and impact on T1 mapping with IR-FSE and MP2RAGE,” (2016) Magn. Reson. Med.(75):2265–2277.
[2] N. Stikov, M. Boudreau, I. R. Levesque, C. L. Tardif, J. K. Barral, and G. B. Pike, “On the accuracy of T1 mapping: Searching for common ground,” (2015) Magn. Reson. Med. (73):514–522.
[3] X. Ou and D. F. Gochberg, “MT effects and T1 quantification in single-slice spoiled gradient echo imaging,”(2008) Magn. Reson. Med. (59):835–845.
[4] R. Heule, C. Ganter, and O. Bieri, “Variable flip angle T1 mapping in the human brain with reduced T2 sensitivity using fast radiofrequency-spoiled gradient echo imaging,” (2016) Magn. Reson. Med. (75):1413–1422.
[5] C. Preibisch and R. Deichmann, “Influence of RF spoiling on the stability and accuracy of T1 mapping based on spoiled FLASH with varying flip angles.,” (2009) Magn. Reson. Med., (61):125–135.
[6] V. L. Yarnykh, “Optimal radiofrequency and gradient spoiling for improved accuracy of T1 and B1 measurements using fast steady-state techniques.,” (2010) Magn. Reson. Med. (63):1610–1626.
[7] C. H. Cunningham, J. M. Pauly, and K. S. Nayak, “Saturated double-angle method for rapid B1+ mapping.,” (2006) Magn. Reson. Med.,(55):1326–1333.
[8] J. K. Barral, E. Gudmundson, N. Stikov, M. Etezadi-Amoli, P. Stoica, and D. G. Nishimura, “A robust methodology for in vivo T1 mapping,” (2010) Magn. Reson. Med. (64):1057–1067.
[9] H-L. M. Cheng and G.A. Wright. “Rapid high-resolution T1 mapping by variable flip angles: accurate and precise measurments in the presence of radiofrequency field inhomogeneity. (2006) Magn. Reson. Med.(55):566-574.
Figures