4970
Rapid, whole-brain T1 mapping using inversion recovery EPIK (ir-EPIK): a quantitative assessment with a group of subjectsN. Jon Shah1,2,3,4 and Seong Dae Yun1
1Institute of Neuroscience and Medicine 4, INM-4, Forschungszentrum Juelich, Juelich, Germany, 2Institute of Neuroscience and Medicine 11, INM-11, JARA, Forschungszentrum Juelich, Juelich, Germany, 3JARA - BRAIN - Translational Medicine, Aachen, Germany, 4Department of Neurology, RWTH Aachen University, Aachen, Germany
Synopsis
Due to their relative insensitivity to B1 inhomogeneities, Look-Locker methods are widely used for the quantification of T1 relaxation time. One such Look-Locker method, TAPIR, has been demonstrated with several clinical applications and has been shown to be faster than conventional gradient-echo sequences. However, it still requires a considerable acquisition time for whole-brain imaging. To overcome this limitation, a much faster method, ir-EPIK, has been presented in our earlier work. This work aims to perform a quantitative assessment of ir-EPIK in comparison to TAPIR using phantom data and twenty data sets from subjects. All data were acquired at 3T.
Introduction
The quantification of T1 relaxation time has been performed using various methods such as variable flip angle or Look-Locker approaches.1-4 Compared to the variable flip angle scheme, the Look-Locker methods are more robust against B1 inhomogeneity and consequently do not require additional efforts for the correction of inhomogeneity effects.5 TAPIR (T1-mApping-with-Partial-Inversion-Recovery) is one such Look-Locker approach and has been demonstrated with several clinical applications.6,7 Although the method is faster than conventional gradient-echo sequences, it still requires a considerable acquisition time for whole-brain imaging. To overcome this limitation, a much faster Look-Locker method, inversion recovery EPI with keyhole (ir-EPIK), was presented in our earlier work.3,8-11 This work aims to perform a quantitative assessment of ir-EPIK in comparison to TAPIR using phantom data and data sets from 20 subjects. All data were gathered at 3T. Here, the T1 difference between the male and female groups is also considered.Methods
Figure 1 depicts the sequence diagram of TAPIR and the corresponding schematic plot of the T1 recovery curve showing how the temporal points are sampled. TAPIR is essentially based on multi-slice FLASH imaging, but here its scheme was modified to sample multiple phase encoding lines (e.g. 3) per excitation in the same way as an EPI readout. As shown in Fig. 1b, TAPIR acquires multi-slice data within the same T1 recovery plot, which is repeated as many times as the number of required phase encoding set. Figure 2 illustrates the case for ir-EPIK. In contrast to TAPIR, it only acquires single-slice data per each T1 recovery plot, which is repeated as many times as the number of slices. Phantom data were acquired with the following imaging conditions: FOV = 240 × 240 mm2, matrix = 96 × 96 (in-plane resolution: 2.5 × 2.5 mm2), number of slices = 1 with 2.5 mm thickness, TR/TE/TI = 60/25/20 ms, FA = 25° and number of time points = 63. Here, only a single slice was measured to keep the same condition for both ir-EPIK and TAPIR. It is important to note that ir-EPIK and TAPIR acquire single-slice and multi-slice data per each single T1 recovery plot, respectively. The same imaging parameters were applied to the measurement of twenty subjects (10 males, 10 females; mean ± SD age, 28.20 ± 4.99 years), except that the number of slices was 49 for ir-EPIK. For TAPIR, only seven slices were acquired with the shortest possible TE/TR (125.3/7.67 ms) to keep the total acquisition time as short as possible. The number of time points in TAPIR was also changed to 30 for the in vivo measurements so as to maintain the similar total T1 recovery time (3.76 s) as ir-EPIK (3.78 s). The above configuration was employed on a Siemens Magnetom Trio 3T MRI scanner.Results
Figure 3 shows obtained T1 maps. For the in vivo data, all slices (7) are presented for TAPIR, whilst only 7 slices at the identical slice positions, out of 49 slices, are presented for ir-EPIK. For the phantom data, five ROIs were defined and the corresponding computed mean ± SD T1 values are listed in Fig. 4a. The same analysis was applied to the in vivo data but only two ROIs (WM and GM) were used. Here, the mean ± SD T1 over 20 subjects is listed in Fig. 4b. The phantom results suggest that the T1 values from both methods are quite comparable to each other. The in vivo results reveal that the estimated T1 values from ir-EPIK were slightly higher than those from TAPIR; they were around 6.84% and 3.67% higher for the WM and GM regions, respectively. Figure 4c shows two-sample t-test results between the male and female groups, where relatively high p-values were obtained. This indicates that the T1 difference between the two groups was not significant. Figure 5 shows the T1 maps for the entire slices (49) from ir-EPIK, presenting that reliable T1 estimation was performed for all slices.Discussion and conclusions
This work demonstrates rapid, whole-brain T1 mapping using ir-EPIK. The method acquired the entire T1 recovery data (2.5 mm2 resolution × 49 slices × 63 time-points) within 5 minutes. The estimated T1 values from ir-EPIK were comparable to those from TAPIR, but were found to be slightly higher for the in vivo data. This was mainly due to the use of a different TE for the measurement of in vivo data. A previous work reported the dependence of the estimated T1 values on the TE employed; T1 increases by nearly 100ms between TE = 9.5 and TE = 25ms.12Acknowledgements
No acknowledgement found.References
- Heule R, Ganter C, Bieri O. Variable flip angle T1 mapping in the human brain with reduced T2 sensitivity using fast radiofrequency-spoiled gradient echo imaging. Magn Reson Med. 2016 Apr;75(4):1413-22.
- Shah NJ, Zaitsev M, Steinhoff S, Zilles K. A new method for fast multislice T1 mapping. Neuroimage. 2001 Nov;14(5):1175-85.
- Shah NJ, Yun S. A rapid, whole-brain look-locker method for T1 mapping using inversion recovery EPIK. In Proceedings of the 25th Annual Meeting of ISMRM, Honolulu, USA, 2017. Abstract 3719.
- Wright PJ, Mougin OE, Totman JJ, Peters AM, Brookes MJ, Coxon R, Morris PE, Clemence M, Francis ST, Bowtell RW, Gowland PA. Water proton T1 measurements in brain tissue at 7, 3, and 1.5 T using IR-EPI, IR-TSE, and MPRAGE: results and optimization. MAGMA. 2008 Mar;21(1-2):121-30.
- Li W, Griswold M, Yu X. Rapid T1 mapping of mouse myocardium with saturation recovery Look-Locker method. Magn Reson Med. 2010;64(5):1296-1303.
- Shah NJ, Neeb H, Kircheis G, et al. Quantitative cerebral water content mapping in hepatic encephalopathy. Neuroimage. 2008;41(3):706-717.
- Shah NJ, Neeb H, Zaitsev M, Steinhoff S, Kircheis G, Amunts K, Häussinger D, Zilles K. Quantitative T1 mapping of hepatic encephalopathy using magnetic resonance imaging. Hepatology. 2003 Nov;38(5):1219-26.
- Zaitsev M, Zilles K, Shah NJ. Shared k-space echo planar imaging with keyhole. Magn Reson Med. 2001;45(1):109-117.
- Zaitsev M, D'Arcy J, Collins DJ, Leach MO, Zilles K, Shah NJ. Dual-contrast echo planar imaging with keyhole: application to dynamic contrast-enhanced perfusion studies. Phys Med Biol. 2005 Oct 7;50(19):4491-505.
- Yun S, Reske M, Vahedipour K, et al. Parallel imaging acceleration of EPIK for reduced image distortions in fMRI. NeuroImage. 2013;73:135-143.
- Yun S, Shah NJ. Whole-brain high in-plane resolution fMRI using accelerated EPIK for enhanced characterisation of functional areas at 3T. PLoS One. 2017;12(9):e0184759.
- Oros-Peusquens AM, Keil F, Shah NJ. Fast two-dimensional relaxometric characterisation of brain tissue in vivo: is T1 relaxation multi-component? In: Proc. Intl. Soc. Mag. Reson. Med. 18 (2010) 4988.
Figures
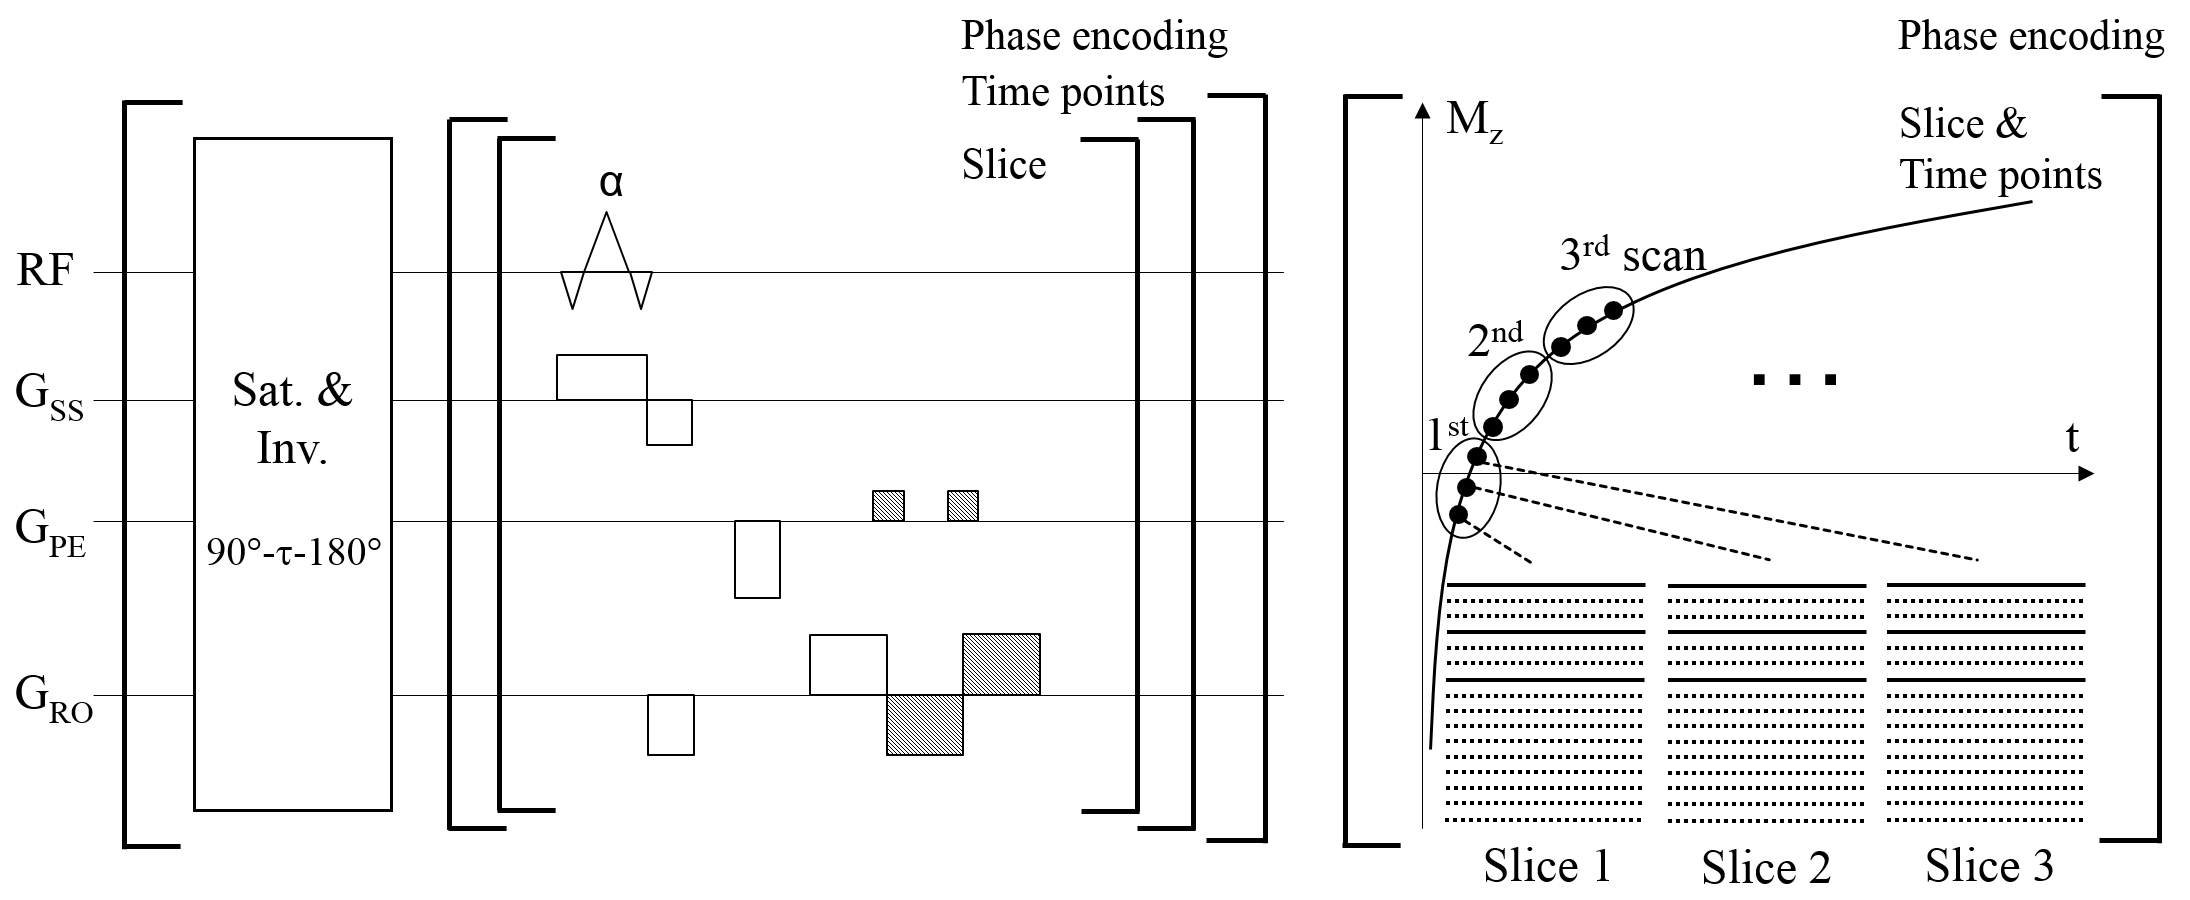
Figure 1. (a) Sequence diagram of TAPIR and (b) the corresponding schematic plot of
the distribution of time points on the T1 recovery curve. For each T1
recovery curve, a set of phase encoding lines is sampled for each slice. This
example features an EPI factor of 3 with three slices. After the acquisition of
all slices, sampling for the next temporal points starts (i.e. 2nd, 3rd,
… time points). This entire T1 recovery is repeated until the full
phase encoding lines are acquired.
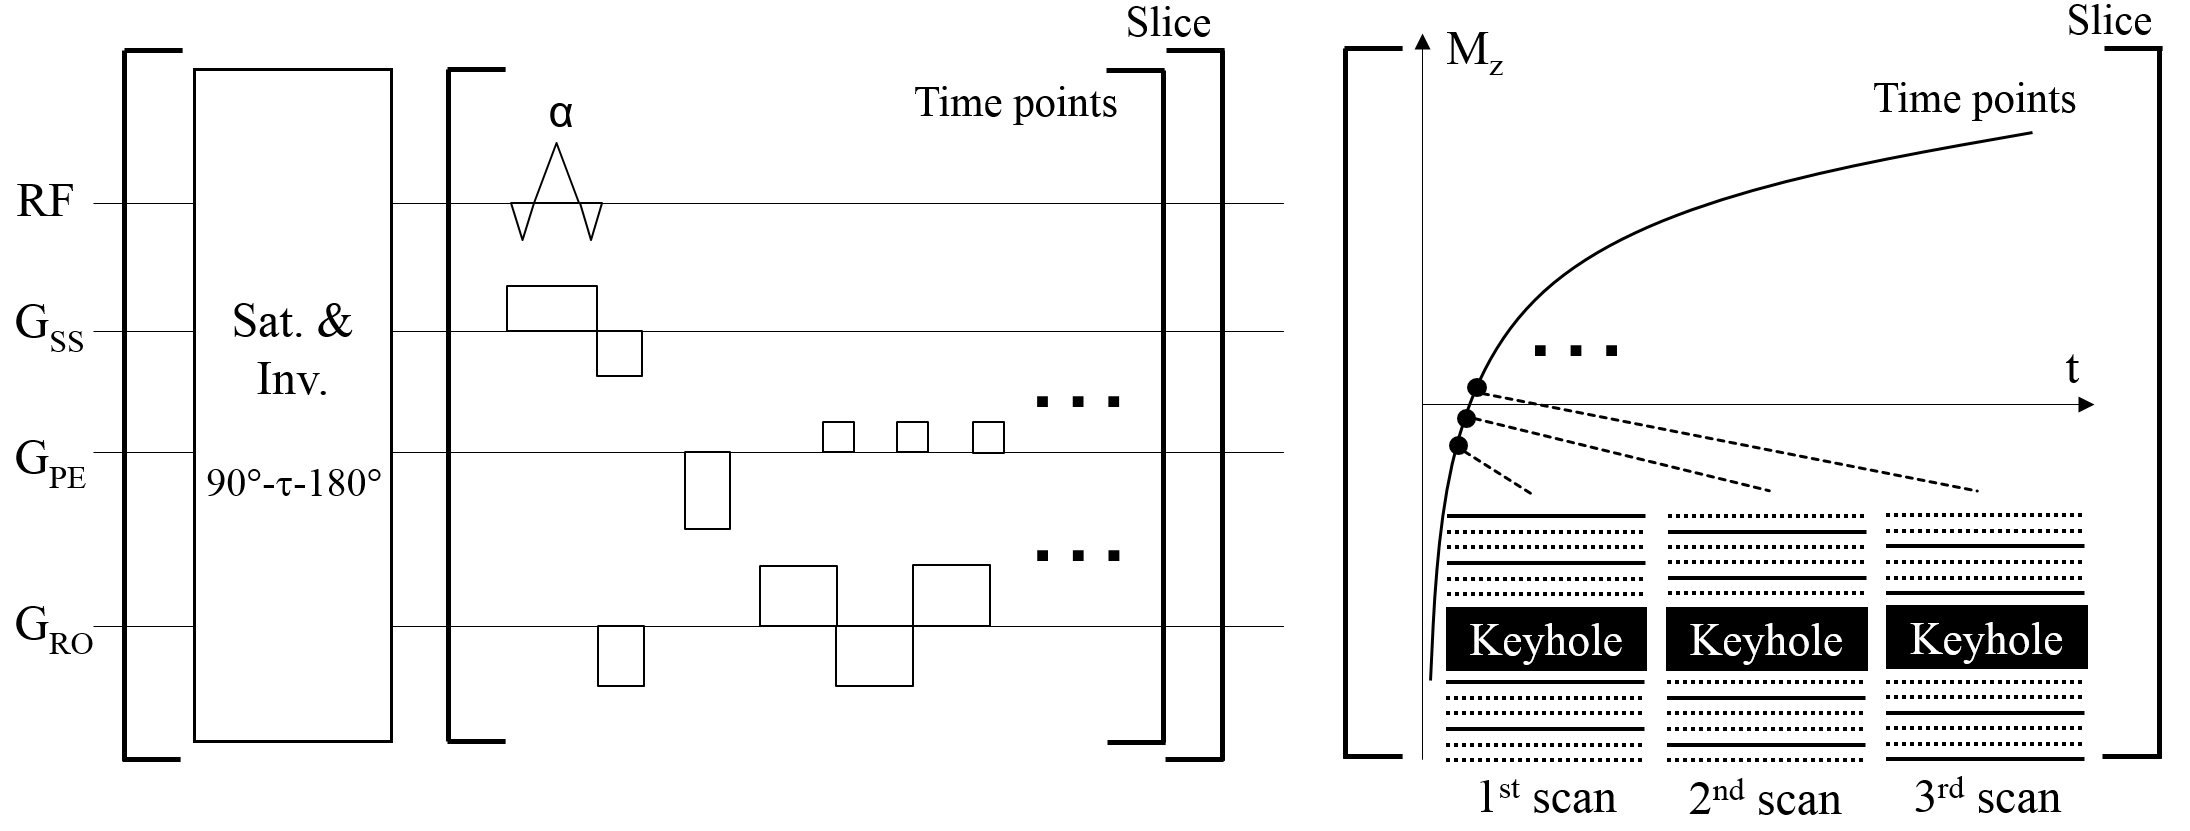
Figure 2. (a) Sequence diagram of ir-EPIK and (b) the corresponding schematic plot of the distribution of time
points on the T1 recovery curve. For each time point, a single EPIK
scan is obtained where the keyhole region is fully sampled whilst peripheral
k-space is sparsely sampled resembling three-shot EPI (Δky' = 3/FOV); here, peripheral
k-space is reconstructed using the sliding window technique. The entire T1
recovery is repeated as many times as the number of slices applied.
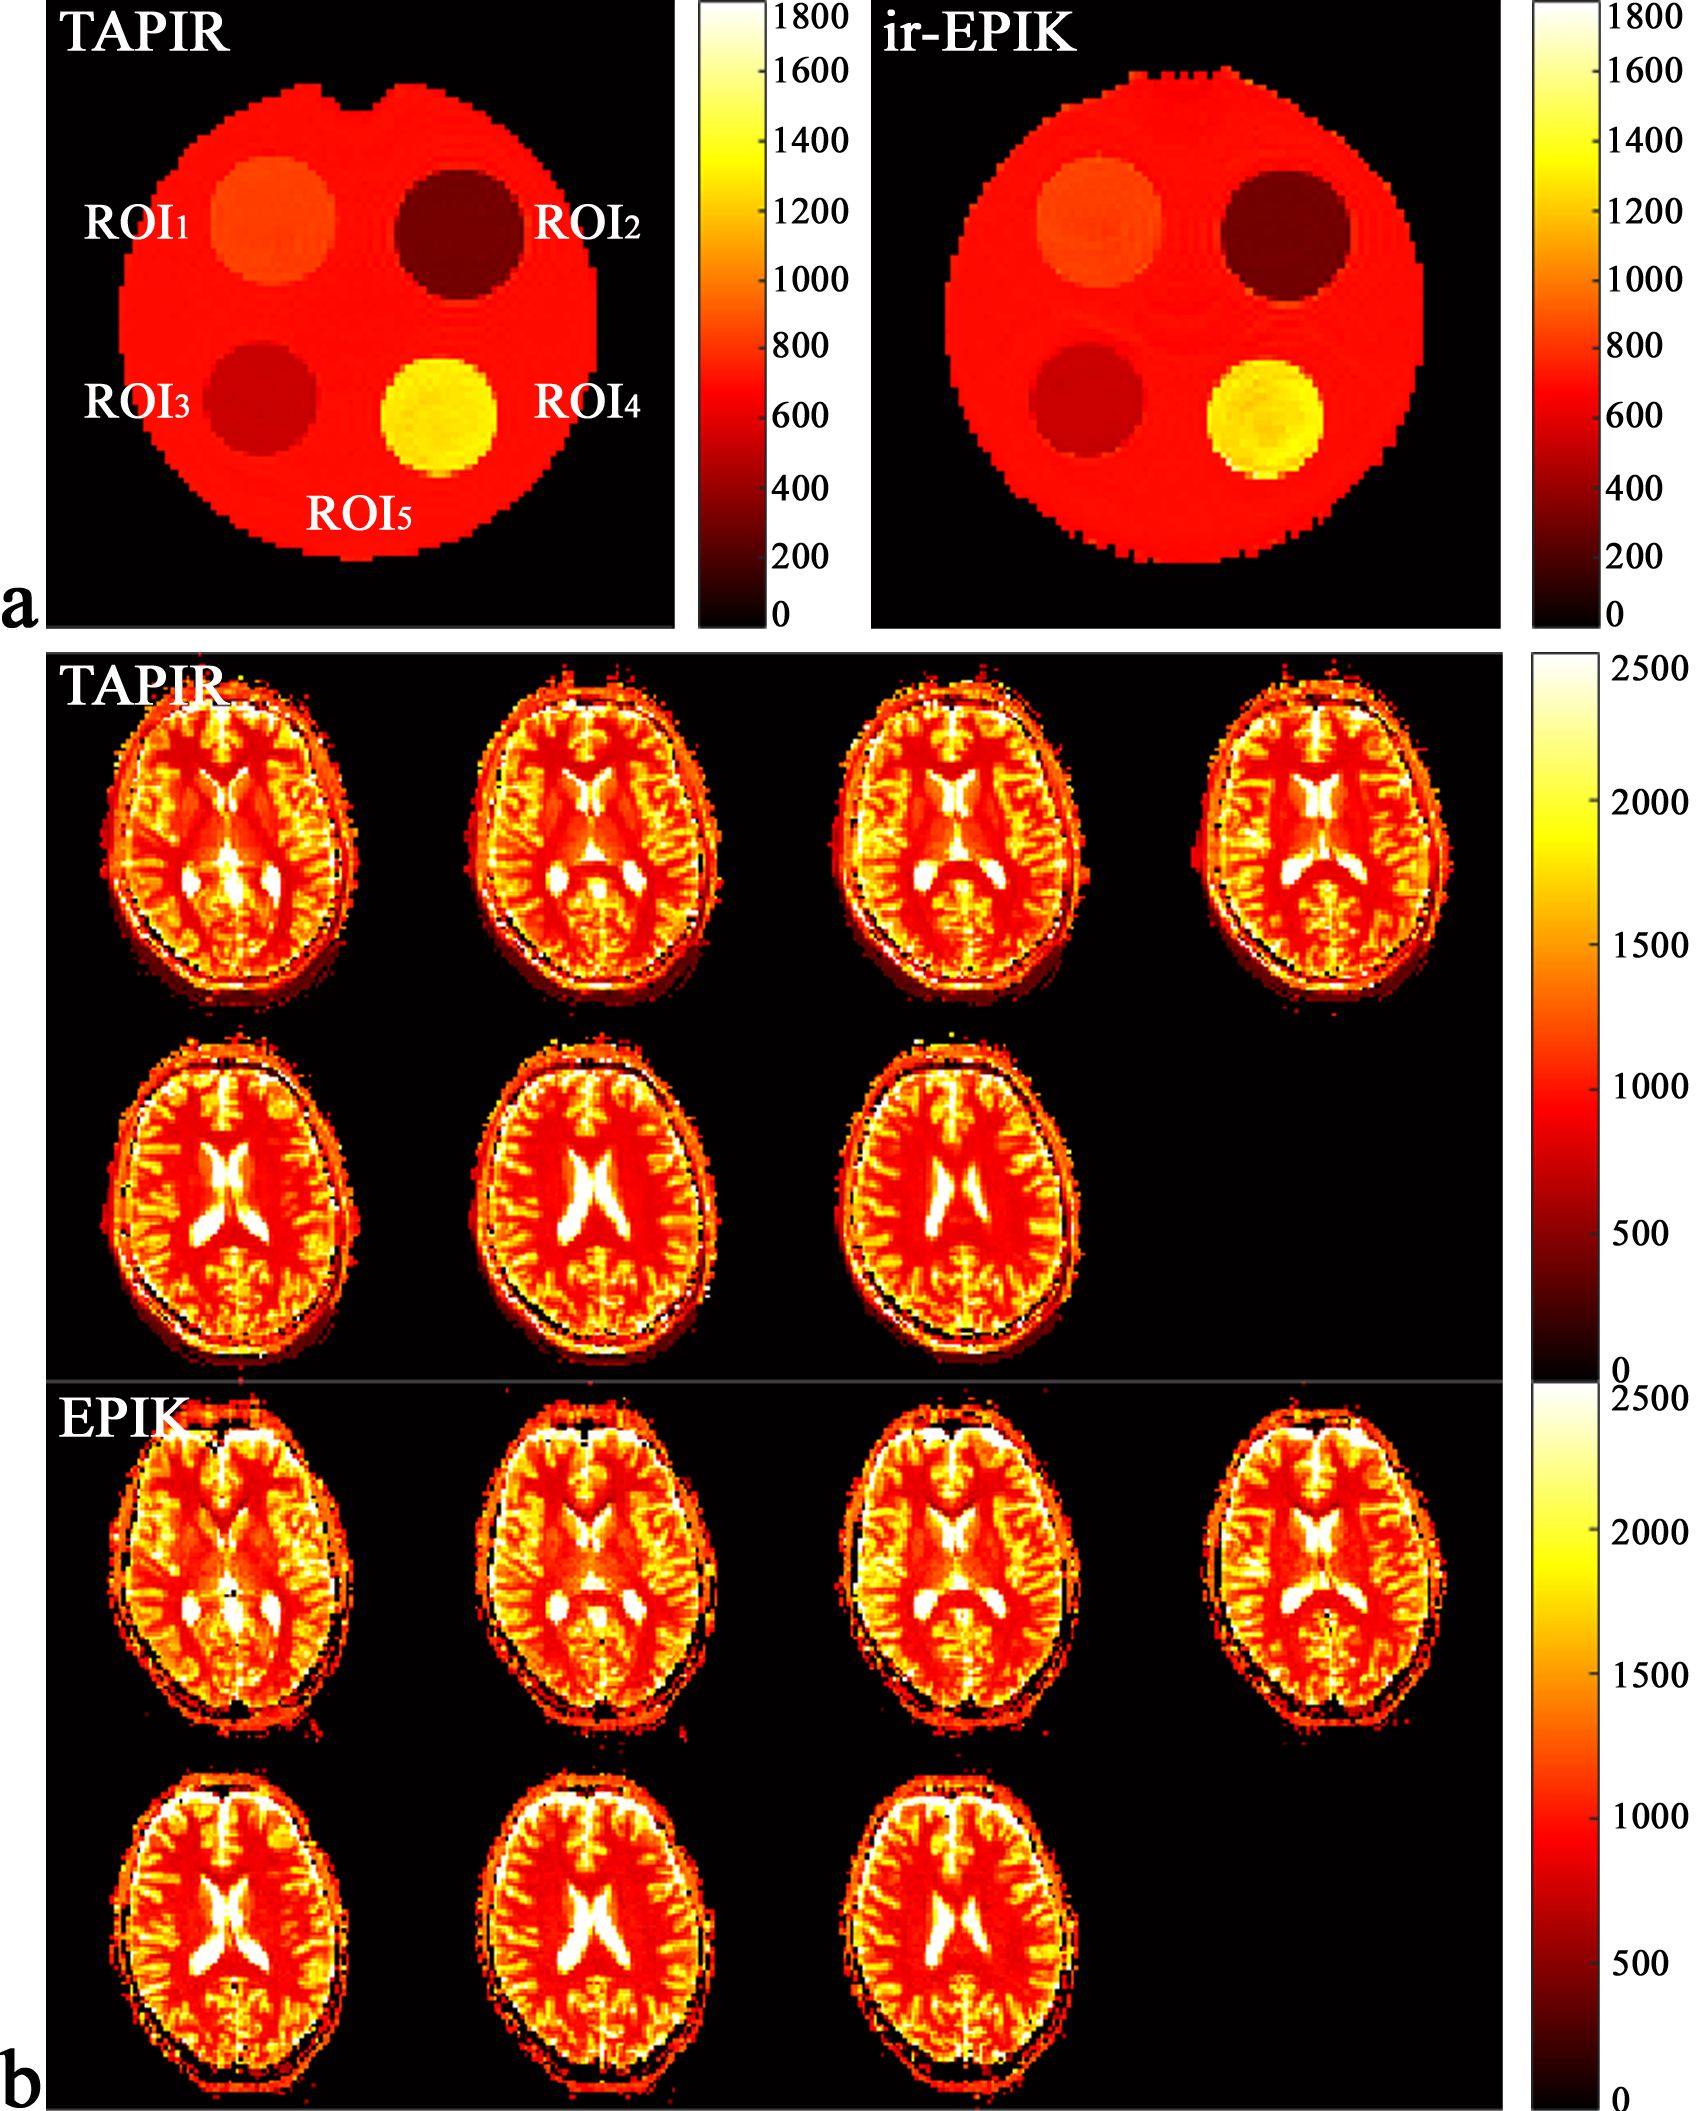
Figure 3. (a) T1 maps obtained from the phantom. The phantom has 4
small flasks (ROI1, ROI2, ROI3 and ROI4)
inside, each of which has its own distinct T1 value. The surrounding
area, indicated by ROI5, has also its own T1 value. (b) T1 maps obtained from a
representative subject. For ir-EPIK, only seven slices having the identical
slice locations as TAPIR are shown.
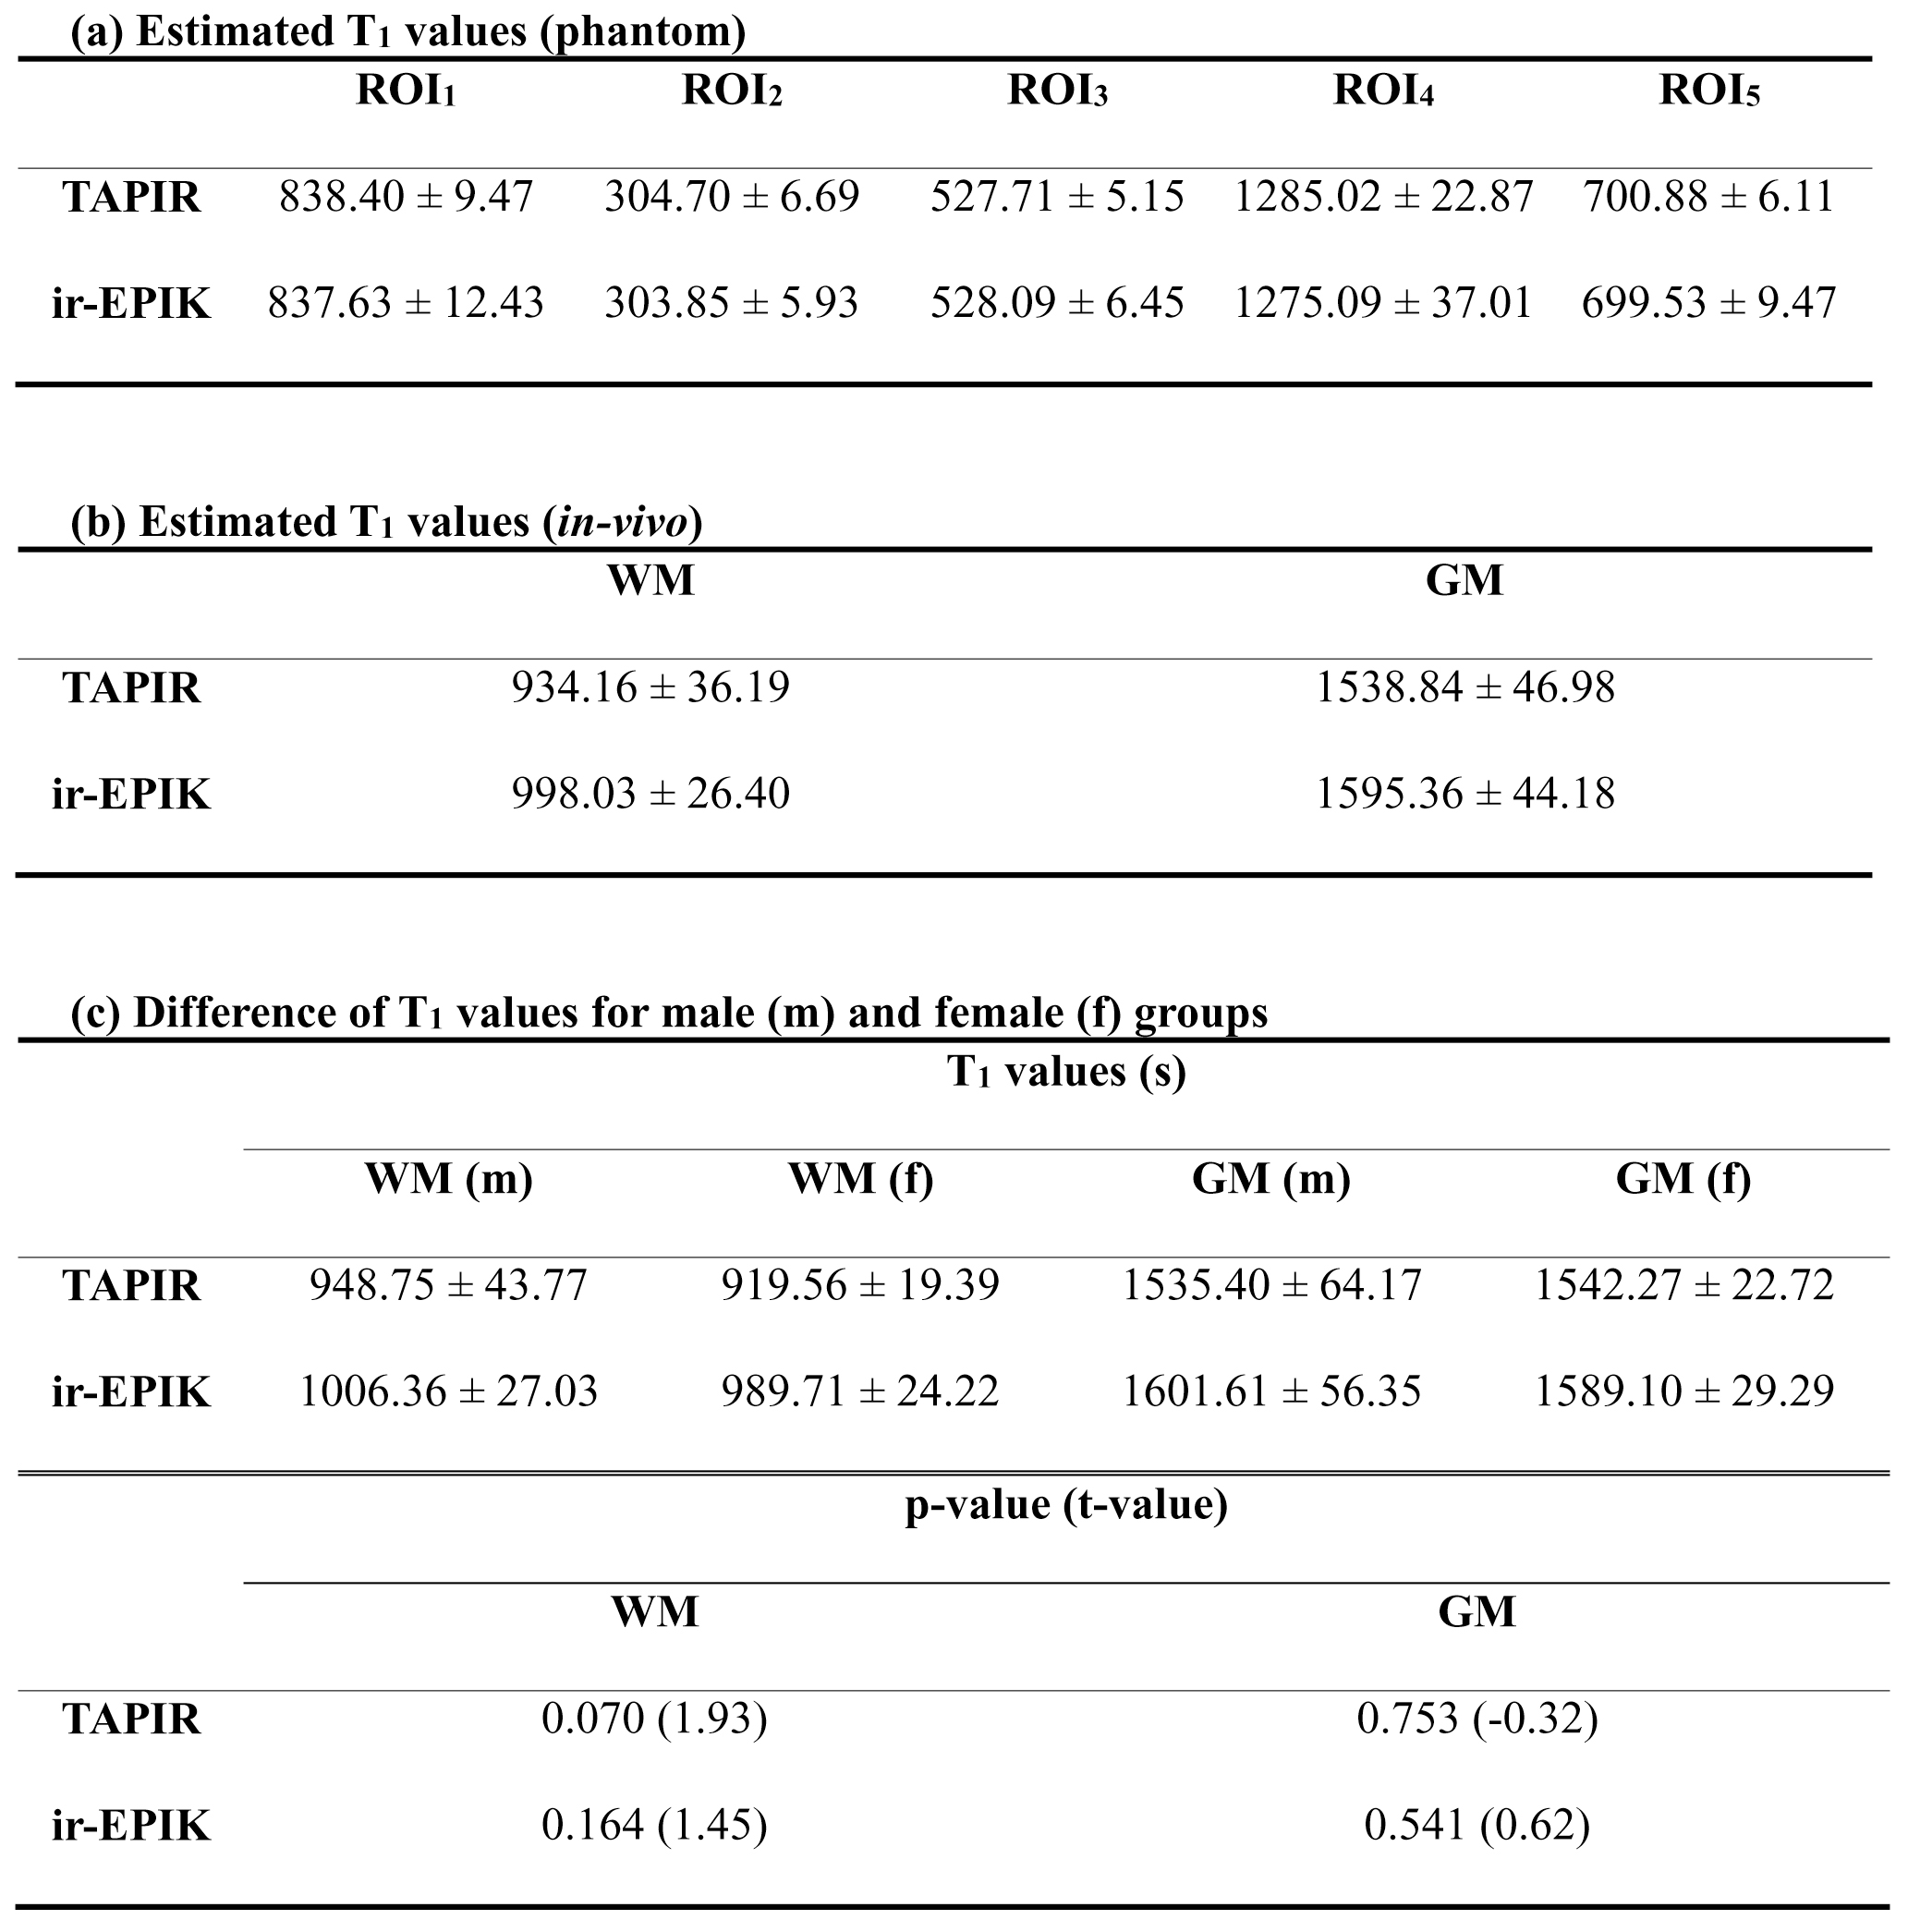
Figure 4. (a) Estimated mean ± SD T1 values for the
5 ROIs of the phantom. (b) Estimated
mean ± SD T1 values for the WM and GM of the in vivo subjects. (c) Estimated mean
± SD T1 values for the male and female groups (top row) and the
two-sample t-test results between
the two groups (bottom row). The presented p-values and corresponding t-values are the
thresholds that reject the null hypothesis. The relatively high p-values
indicate that the effect of different gender on the T1 value
estimation was not significant.
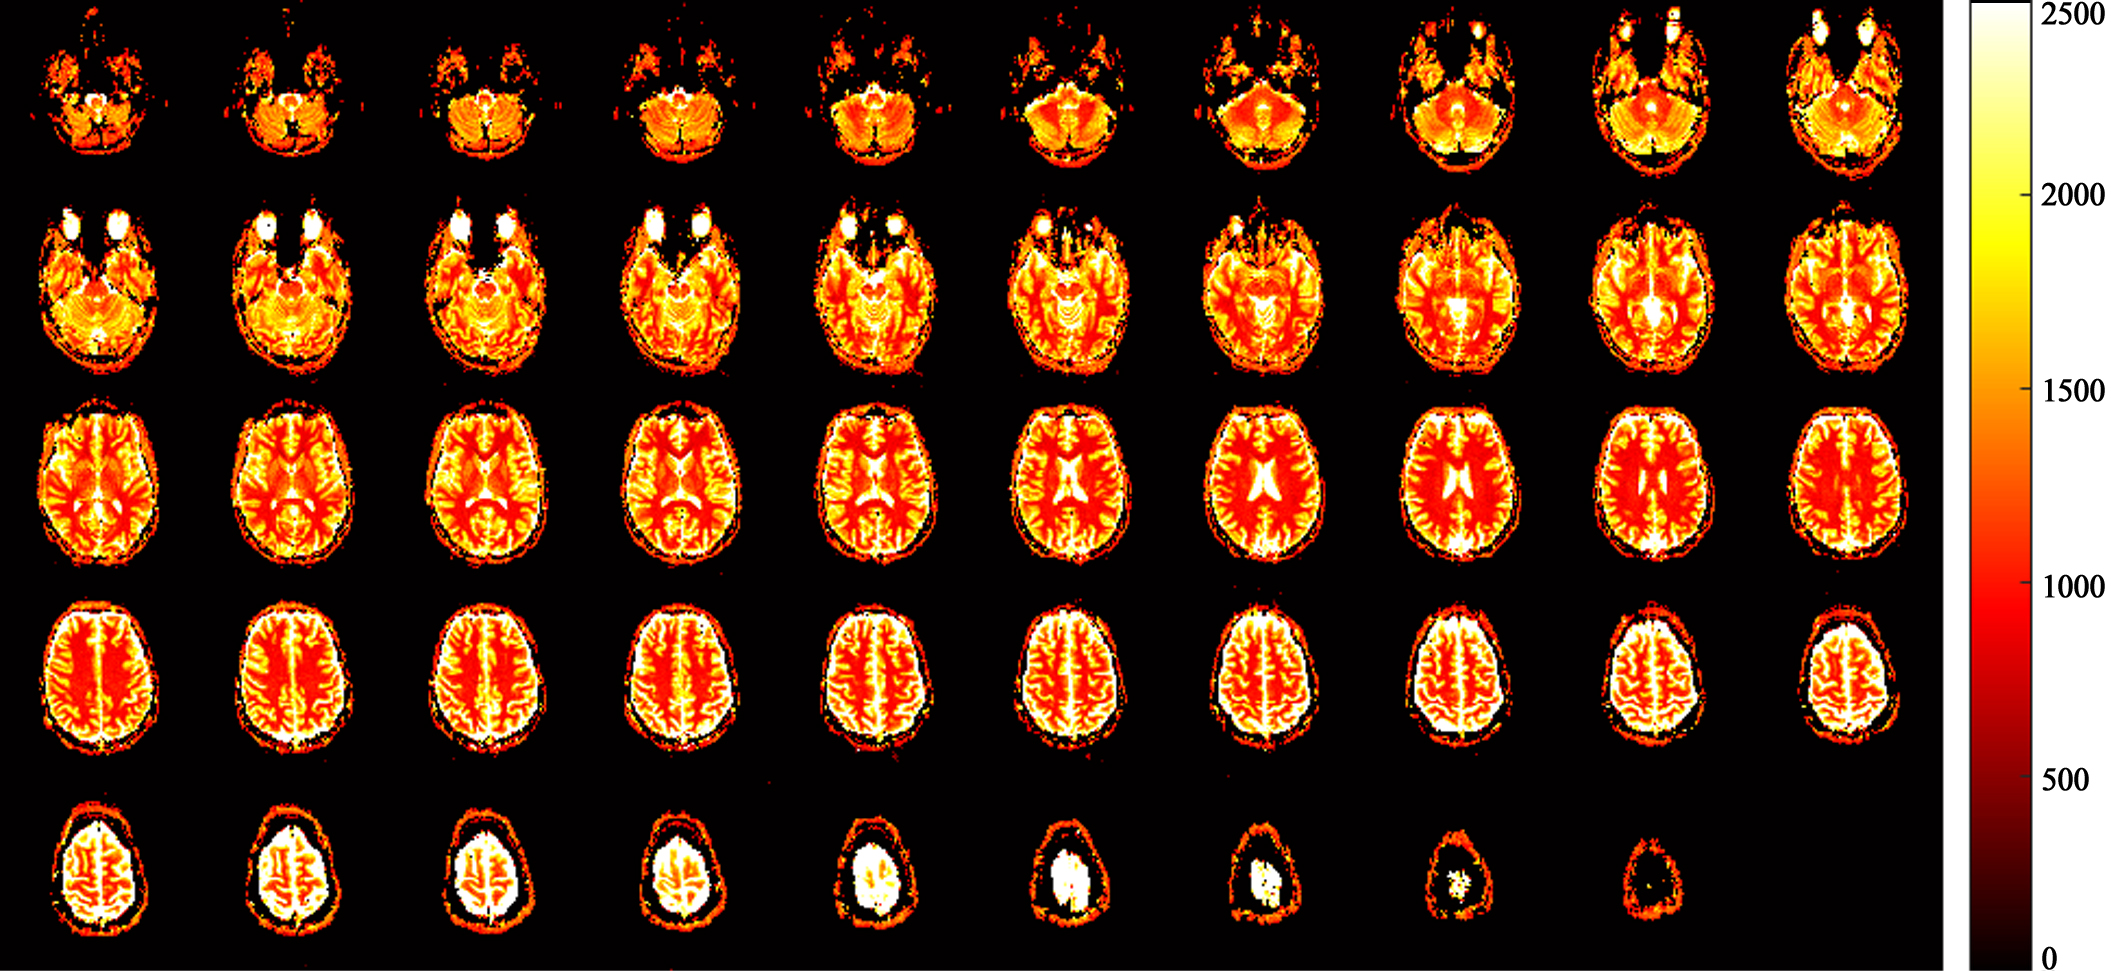
Figure 5. T1 maps for entire
slices (2.5 mm × 2.5 mm × 49 slices) obtained from ir-EPIK.