4969
Correlation between Fat Fraction and MR relaxation times in the vertebral bone marrow at 1.5 T.1Univ Rennes, Inserm, LTSI – UMR 1099, Rennes, France, 2CHU Rennes, Rennes, France
Synopsis
The aim of this study was to investigate the in-vivo correlation between Fat Fraction and T1, T2* for both water and fat compartments, in vertebral bone marrow at 1.5T. A fast chemical-shift-encoded 3D multi-gradient-echo sequence and a B1-mapping sequence were acquired at two different flip angles. Fat Fraction, T1 of water, T2* of water, T1 of fat and T2* of fat were obtained using a previously published method. The results of the current study show strong correlation between Fat Fraction and the relaxation times.
Introduction
Bone marrow is a tissue composed of hematopoietic cells and adipocytes. Its fat fraction depend on the age, sex, ethnicity1 and pathologies2. This composition variability, even in a healthy population, makes bone marrow an excellent candidate for investigations in-vivo of the correlation fat fraction/relaxation times. A previous study has investigated the in-vitro correlation between Fat Fraction (FF) and T1 relaxation times3. In the current study, measurements of Fat Fraction, T1 and T2* of water and fat (T1w, T1f, T2*w and T2*f) were conducted. The correlation between FF and relaxation times were investigated, with the aim of comparing our result with Hu&Nayak3 work.Materials & Methods
MR Imaging: The data of 9 healthy volunteers (mean age 27 ± 8) were acquired at 1.5 T (MAGNETOM Aera, Siemens Healthcare, Germany) using a four-echoes VIBE-Dixon sequence; TR/TEs 8.20/1.23,2.41,4.4,6.8 ms ; Bandwidth 1220 Hz/Px ; FOV 325 x 400 mm² ; matrix 179 x 256; Partial Fourier 6/8 ; 72 slices of 4 mm and CAIPIRINHA (controlled aliasing in volumetric parallel imaging results in higher acceleration) acceleration factor of 4). Each VIBE-Dixon was followed by one TurboFLASH B1-Mapping sequence; TR/TE 2000/1.5 ms ; 490 Hz/Px ; FOV 400x400 mm² ; matrix 64 x 64 and 7 slices of 8 mm for a total of 20 seconds. The VIBE-Dixon and TurboFLASH B1-Mapping sequences were acquired at two flip angles (5° and 15°).
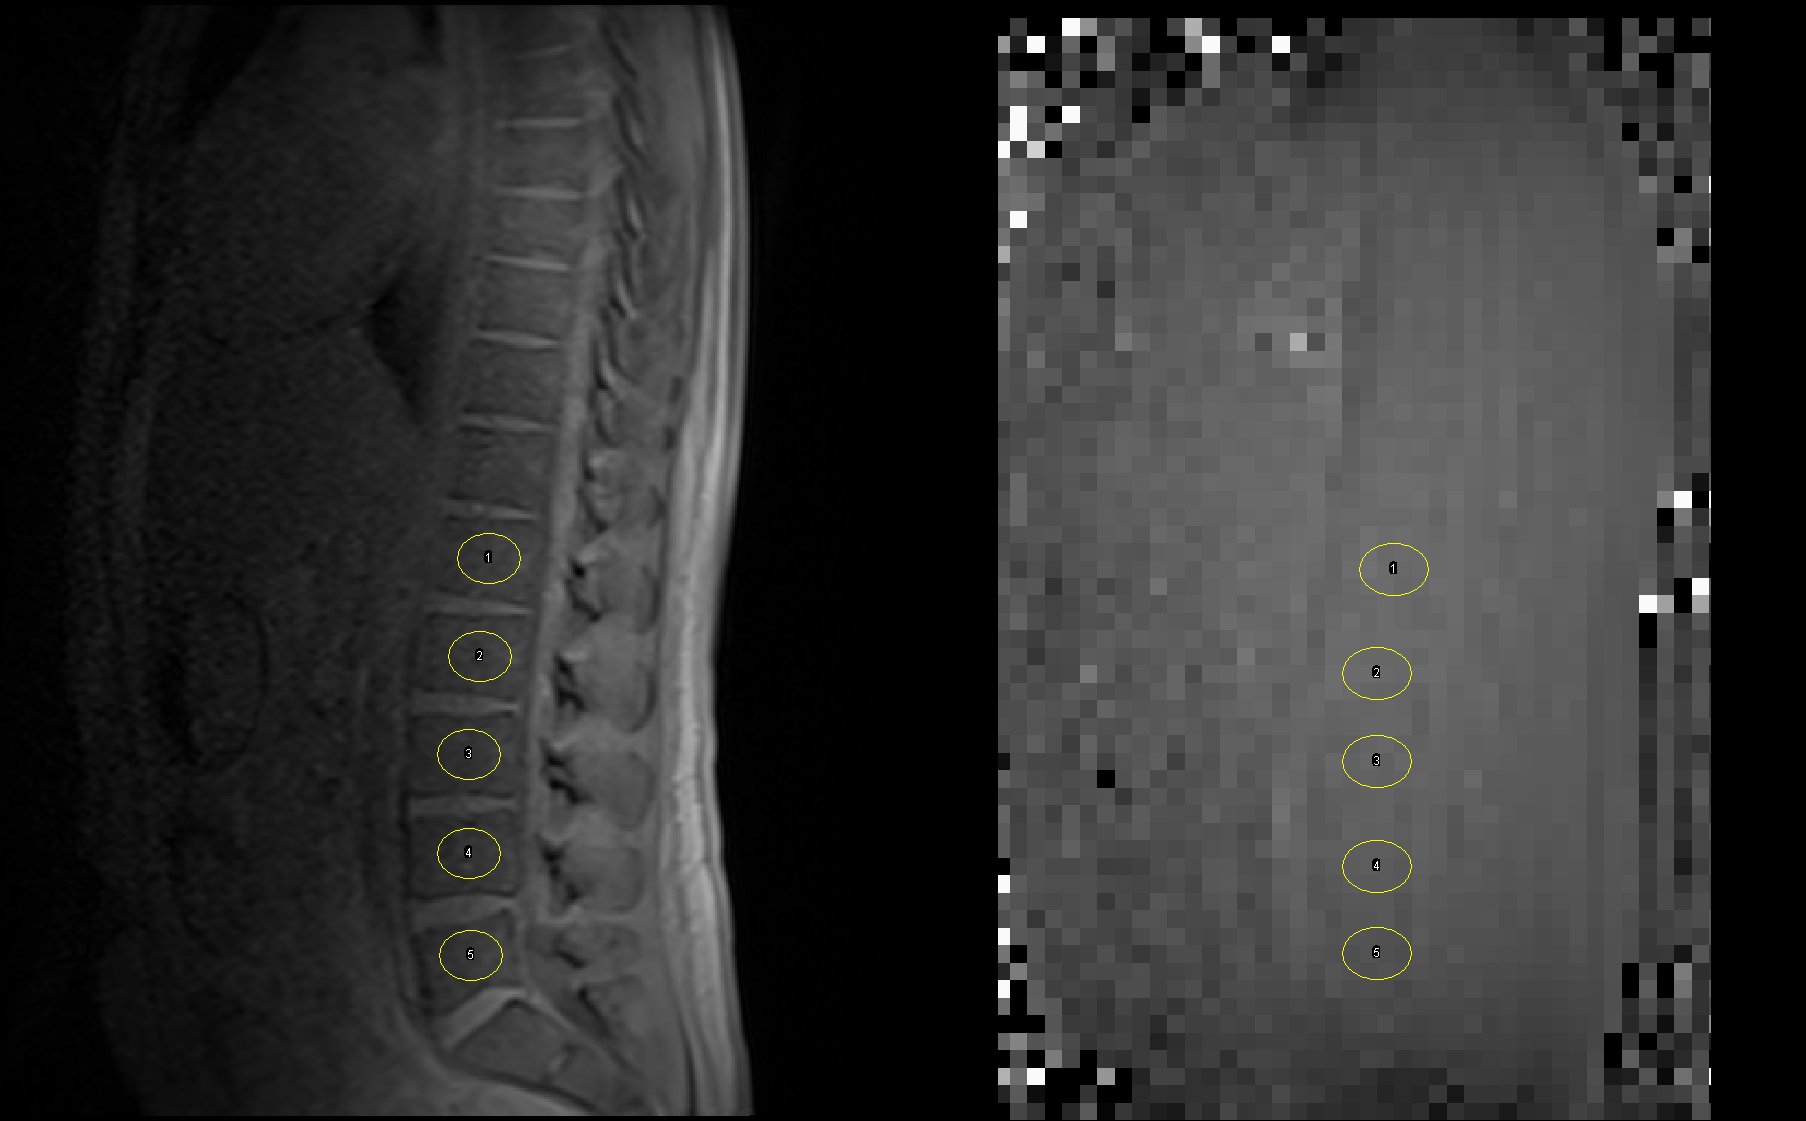
Data Analysis: ROIs were drawn in the five lumbar vertebrae of each volunteer with ImageJ (NIH, Bethesda, MD, http://imagej.nih.gov/ij/) and transposed to the same location in each sequence [Figure1]. Each ROI had an area of 133 voxels for the VIBE-Dixon sequence and 8 voxels for the TurboFLASH B1-Mapping sequence. The mean magnitude value from VIBE sequences, with the corrected flip angle value obtained from B1 maps, was fitted to the signal equation using a previously published method4, which yielded the FF, T1w, T1f, T2*w and T2*f.
Statistical analysis: The correlation between FF and relaxation times was assessed using the Pearson correlation coefficient. The threshold p <0.0001 was chosen for statistical significance.
Results
Figure 1 shows an example of VIBE-Dixon and TurboFLASH B1-Mapping images.
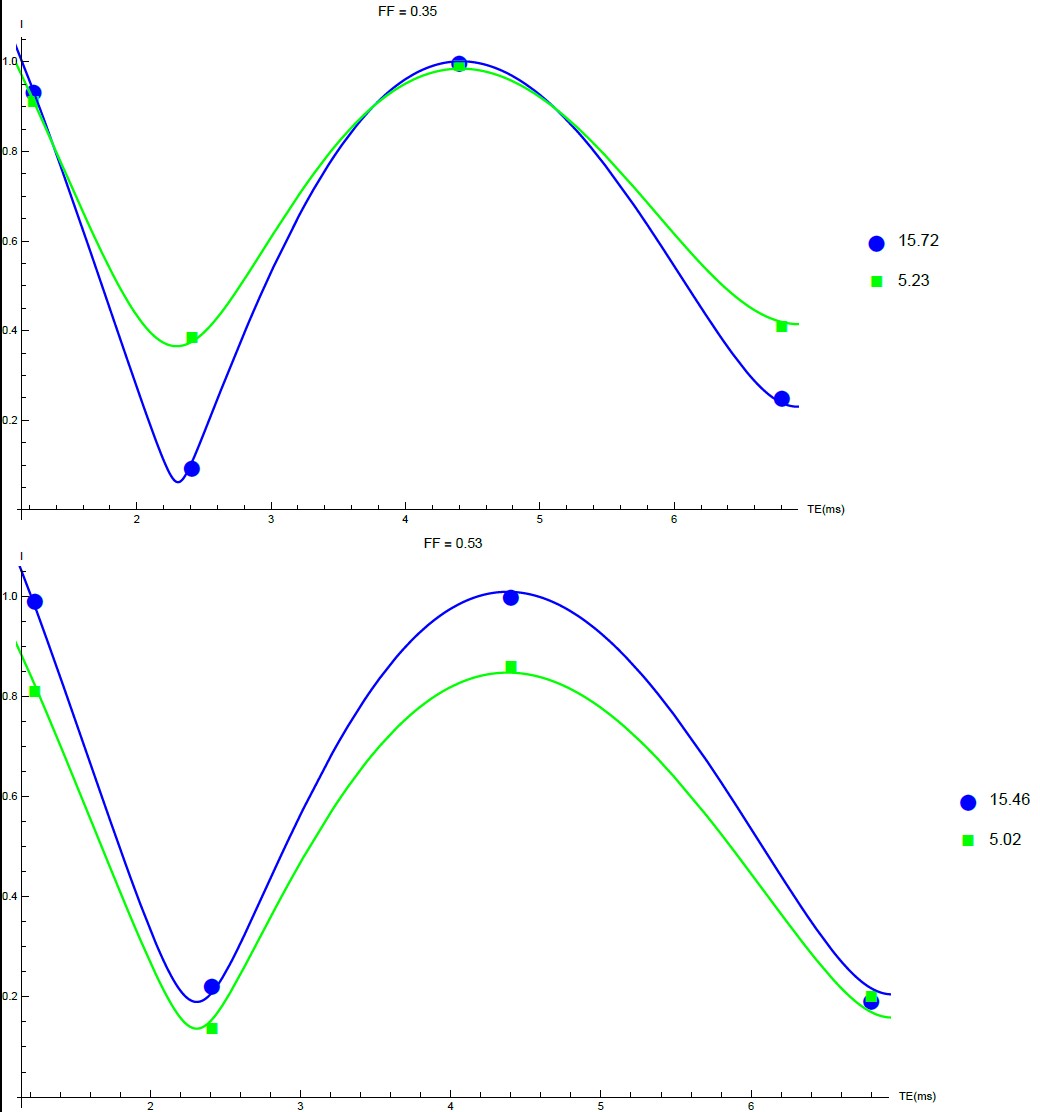
In Figure 2, two examples of data fitting of the signal from two ROI are shown (one ROI with the lower FF of 0.35, and one ROI with the higher FF of 0.53). Good quality of the data fitting is noticeable in both cases.
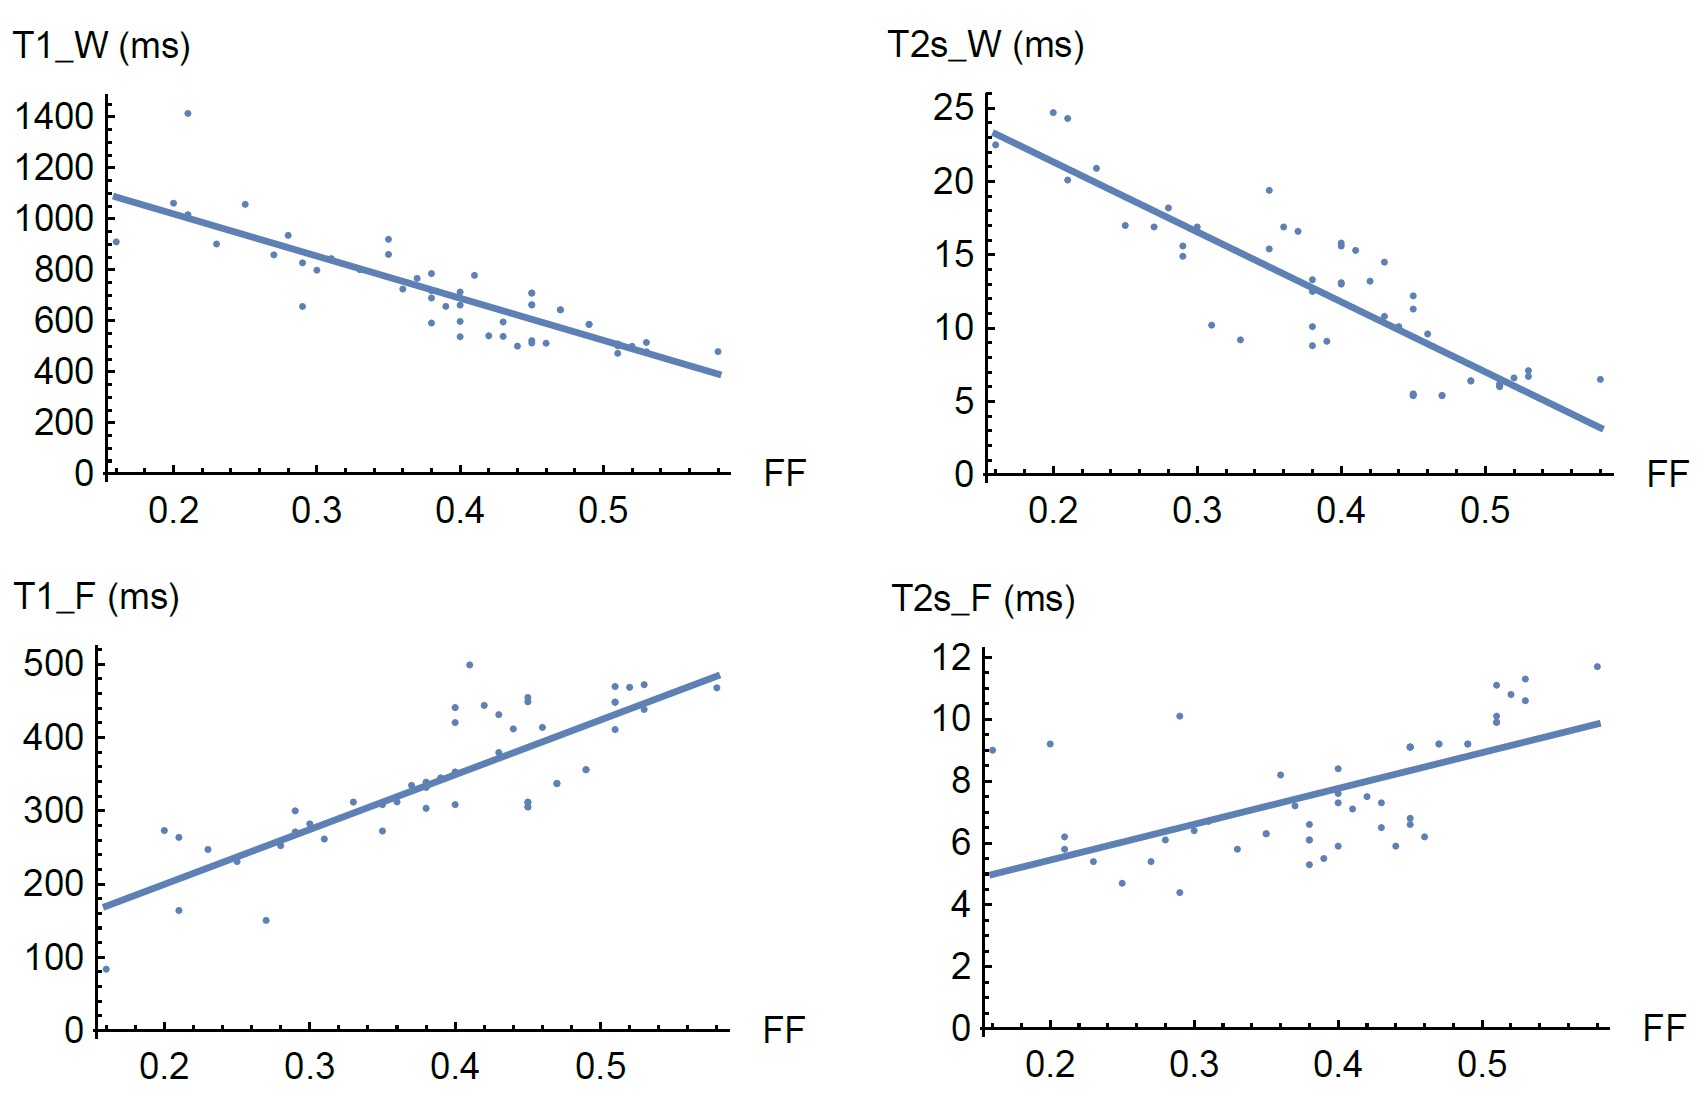
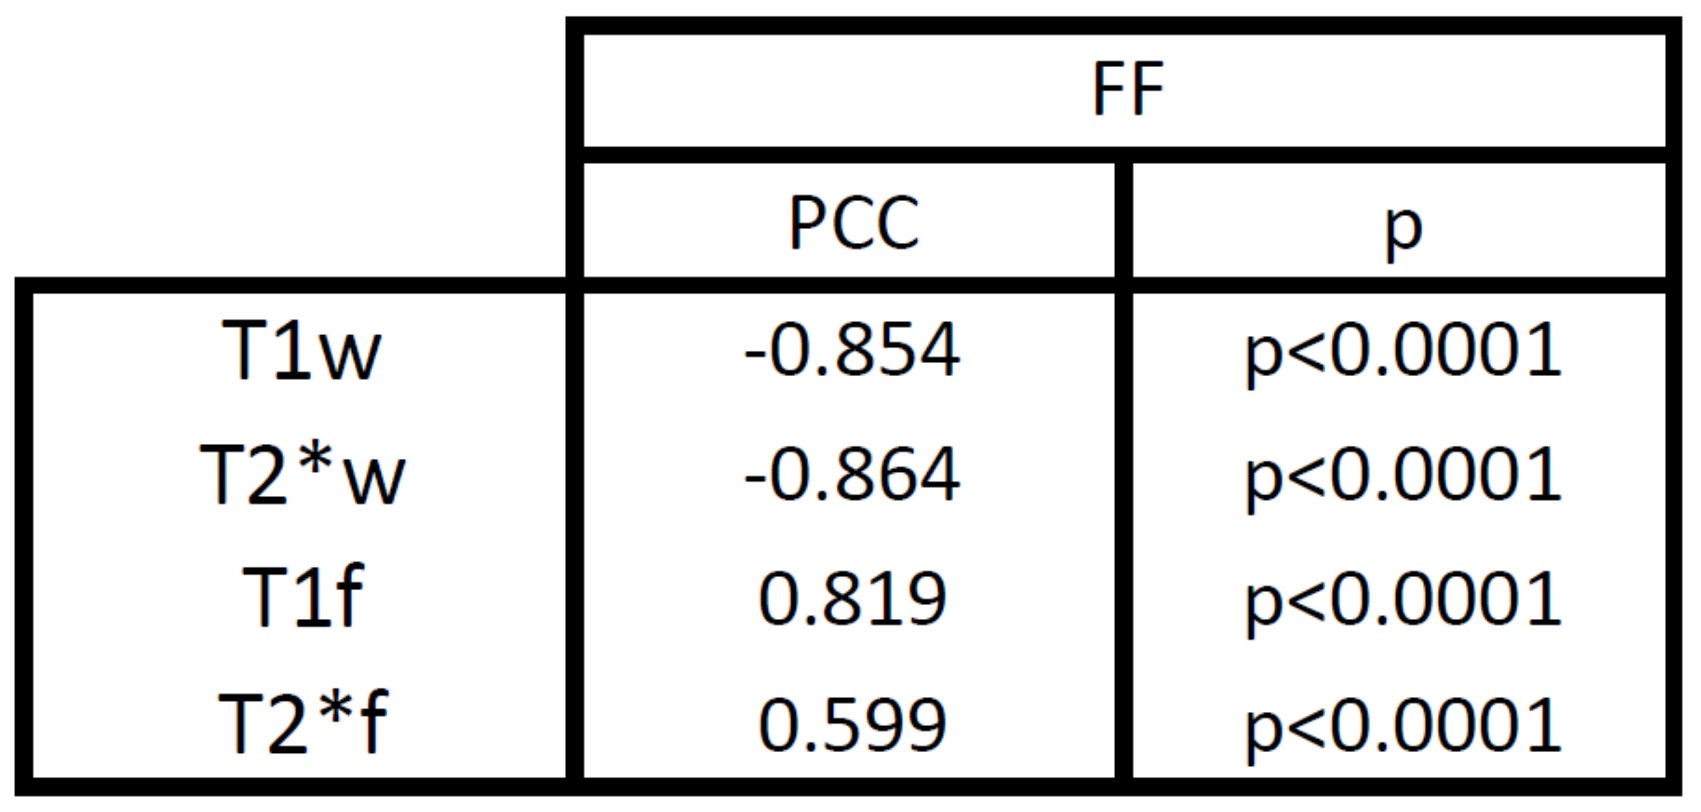
Figure 3 shows the values of relaxation times versus the FF and the corresponding linear regression. Table1 presents the correlation between FF and relaxation times. A significant correlation was found between FF and relaxation times.
Discussion
A previous study performed in vitro at 3T found a negative correlation between T1 of water and FF as well as a negative correlation between T1 of fat and FF3. In another study, this one performed in vivo at 1.5T on the bone marrow of humerus and femur, a negative correlation between T1 of water and FF was observed5. The results of the current study confirm the negative correlation previously found between T1 of water and FF3,5. On the other hand, in contrast to the results obtained in the previous in vitro study3, we observed a positive correlation between T1 of fat and FF. It is noticeable however that in both our study and the in vitro study the T1 of water and the T1 of fat converge to each other as FF increases.
The T2* of water decreases as the FF increases. This can be explained by the fact the microenvironment of the water molecule become less homogeneous as the FF increases. This increased inhomogeneity naturally decreases the T2* of water. Similarly, the increase of the T2* of fat with the increase of FF could be attributed to the same phenomenon.
Conclusion
In the current study, performed in bone marrow at 1.5T strong correlations between Fat Fraction and the relaxation times was observed on healthy volunteers. The negative correlation between T1 of water and FF is in agreement with previous studies3,5.Acknowledgements
No acknowledgement found.References
1. Chan, G. M. F. et al. Role of Fat and Bone Biomarkers in the Relationship Between Ethnicity and Bone Mineral Density in Older Men. Calcif. Tissue Int. 102, 64–72 (2018).
2. Takasu, M. et al. Iterative Decomposition of Water and Fat with Echo Asymmetry and Least-Squares Estimation (IDEAL) Magnetic Resonance Imaging as a Biomarker for Symptomatic Multiple Myeloma. PLOS ONE 10, e0116842 (2015).
3. Hu, H. H. & Nayak, K. S. Change in the proton T 1 of fat and water in mixture. Magn. Reson. Med. 63, 494–501 (2010).
4. Le Ster, C. et al. Breath-hold MR measurements of fat fraction, T 1 , and T 2 * of water and fat in vertebral bone marrow: Bone Marrow Fat Fraction, T 1 and T 2 *. J. Magn. Reson. Imaging 44, 549–555 (2016).
5. Le Ster, C. et al. A fast method for the quantification of fat fraction and relaxation times: Comparison of five sites of bone marrow. Magn. Reson. Imaging 39, 157–161 (2017).
Figures