4968
Venous Velocity Selective Inversion for improved selection of the venous blood pool for oxygen extraction fraction determination1Radiology, Leiden University Medical Center, Leiden, Netherlands, 2Radiology, University Medical Centre Utrecht, Utrecht, Netherlands
Synopsis
By combining pulsed ASL and Velocity Selective Inversion it is possible to selectively label the venous blood pool. This new method, dubbed venous velocity selective inversion (vVSI) could be used to measure the oxygen extraction fraction in the venous and arterial blood with a single scan.
Introduction
Currently there are three methods available to measure the oxygen extraction fraction (OEF) by isolating the venous blood signal, as a result of which no contaminations due to either pathology or iron deposition can occur: TRUST[1], QUIXOTIC[2], VSEAN[3]. They all exploit T2-measurements of venous blood to infer venous oxygen saturation (Yv), from which OEF can be approximated by assuming full oxygenation of arterial blood. When additional cerebral blood flow and hematocrit measurements are available, cerebral metabolic rate of oxygen (CMRO2) can be determined. Unfortunately, low SNR and limited coverage prevent those methods to make a reliable measurement of the OEF for clinical use outside the sagittal sinus or other large veins. Recently, Qin[4] introduced a velocity selective inversion (VSI) technique, which increased the SNR significantly compared to velocity selective ASL. This VSI technique labels, however, both arterial and venous blood. In this study we employ a pulsed ASL module T1,blood*ln(2) seconds before VSI-labeling to null the arterial pool. Moreover, this new method, dubbed venous velocity selective inversion (vVSI), not only the venous, but also the arterial signal can be calculated using the same sequence, when the control condition of PASL is also acquired.Materials and Methods
The vVSI-method cycles through four different labeling
combinations (see Figure 1). When using the label condition of the pulsed ASL (PASL
label, Pl) in the post-processing arterial signal will be nulled and thus
eliminated. Subtraction of VSI label (Vl) and control (Vc) images will then
provide a map of venous signal, as shown in figure 1. Similarly, when using the
control condition of VSI and subtracting PASL control (Pc) and label, only
arterial signal is obtained.
Five healthy volunteers (26-45yrs, 1f/4m) were scanned on a
3T Philips Achieva MRI-scanner using a 32-receive channel head-coil. All
volunteers provided written informed consent and the study was approved by
local IRB. The VSI-labeling module parameters were corresponding to a vCut-off
of 1.8cm/s, implemented as described by Qin et al[4]. The effect of the PASL labeling module on the VSI-signal was evaluated by putting the PASL gradients to zero. To test the efffect of the VSI-labeling module on the PASL-signal the RF-pulses were put to zero.
Results
In figure 2 the velocity selective arterial and venous difference images are shown from a single subject. In the VSvenous image (PlVc-PlVl), the sagittal sinus is clearly visible, but there is also signal from smaller veins and venules. The negative signal is mainly found in the arteries in the lower slice, which is the result from fresh inflow.
In figure 3 the effect of the PASL labeling module on the VSI signal is shown. VS art+ven (PcVc-PcVl) and VS ven (PlVc-PlVl) gave similar images when the gradient strength of the PASL labeling module was set to zero: In both images arterial en venous signal were present. When performing PASL labeling with gradients the arterial signal was nulled at the moment of labeling with the VSI-module. Therefore only venous blood was labeled.
In figure 4 the effect of the VSI module in addition to the PASL signal is shown. PASL art (PcVc-PlVc) and PASL vasc crush (PcVL-PLVL) showed similar images when the RF-pulses from the VSI module were turned off. With the RF-pulses the VSI-module performed as a vascular crusher and reduced the signal from regions with higher flow.
Discussion and conclusion
By
combining PASL and VSI it is possible to selectively label the venous blood
pool, by nulling the arterial signal during labeling with VSI. By cycling through the different labeling combinations, it is also possible to calculate the arterial signal, without acquisition of an additional scan. In this study was demonstrated that the effect of the two labeling modules on the signal they create is minimal when the gradient strenght was set to zero for the PASL-module or the RF-pulses were set to zero degrees for the VSI-module. To measure the T2 to estimate the oxygen extraction fraction inthe venous blood pool, the vVSI-sequence could be extended by adding a T2-preparation before imaging. Furthermore, the negative signal found In the lower slices, mainly in the
arteries due to fresh inflow, could be suppressed by a
QUIPSS-module.Acknowledgements
This work is part of the research programme Innovational
Research Incentives Scheme Vici with project number 016.160.351, which is
financed by the Netherlands Organisation for Scientific Research (NWO). This study
is supported by the Out of the Box challenge 2018 from the ISMRM Benelux
Chapter.
We thank Qin Qin for his help on implementing the VSI sequence.
References
1. H
Lu and Y Ge. MRM, 2008
2. DS Bolar, et al. MRM, 2011
3. J Guo and EC Wong. MRM, 2012
4. Q Qin
and PCM van Zijl. MRM, 2016
Figures
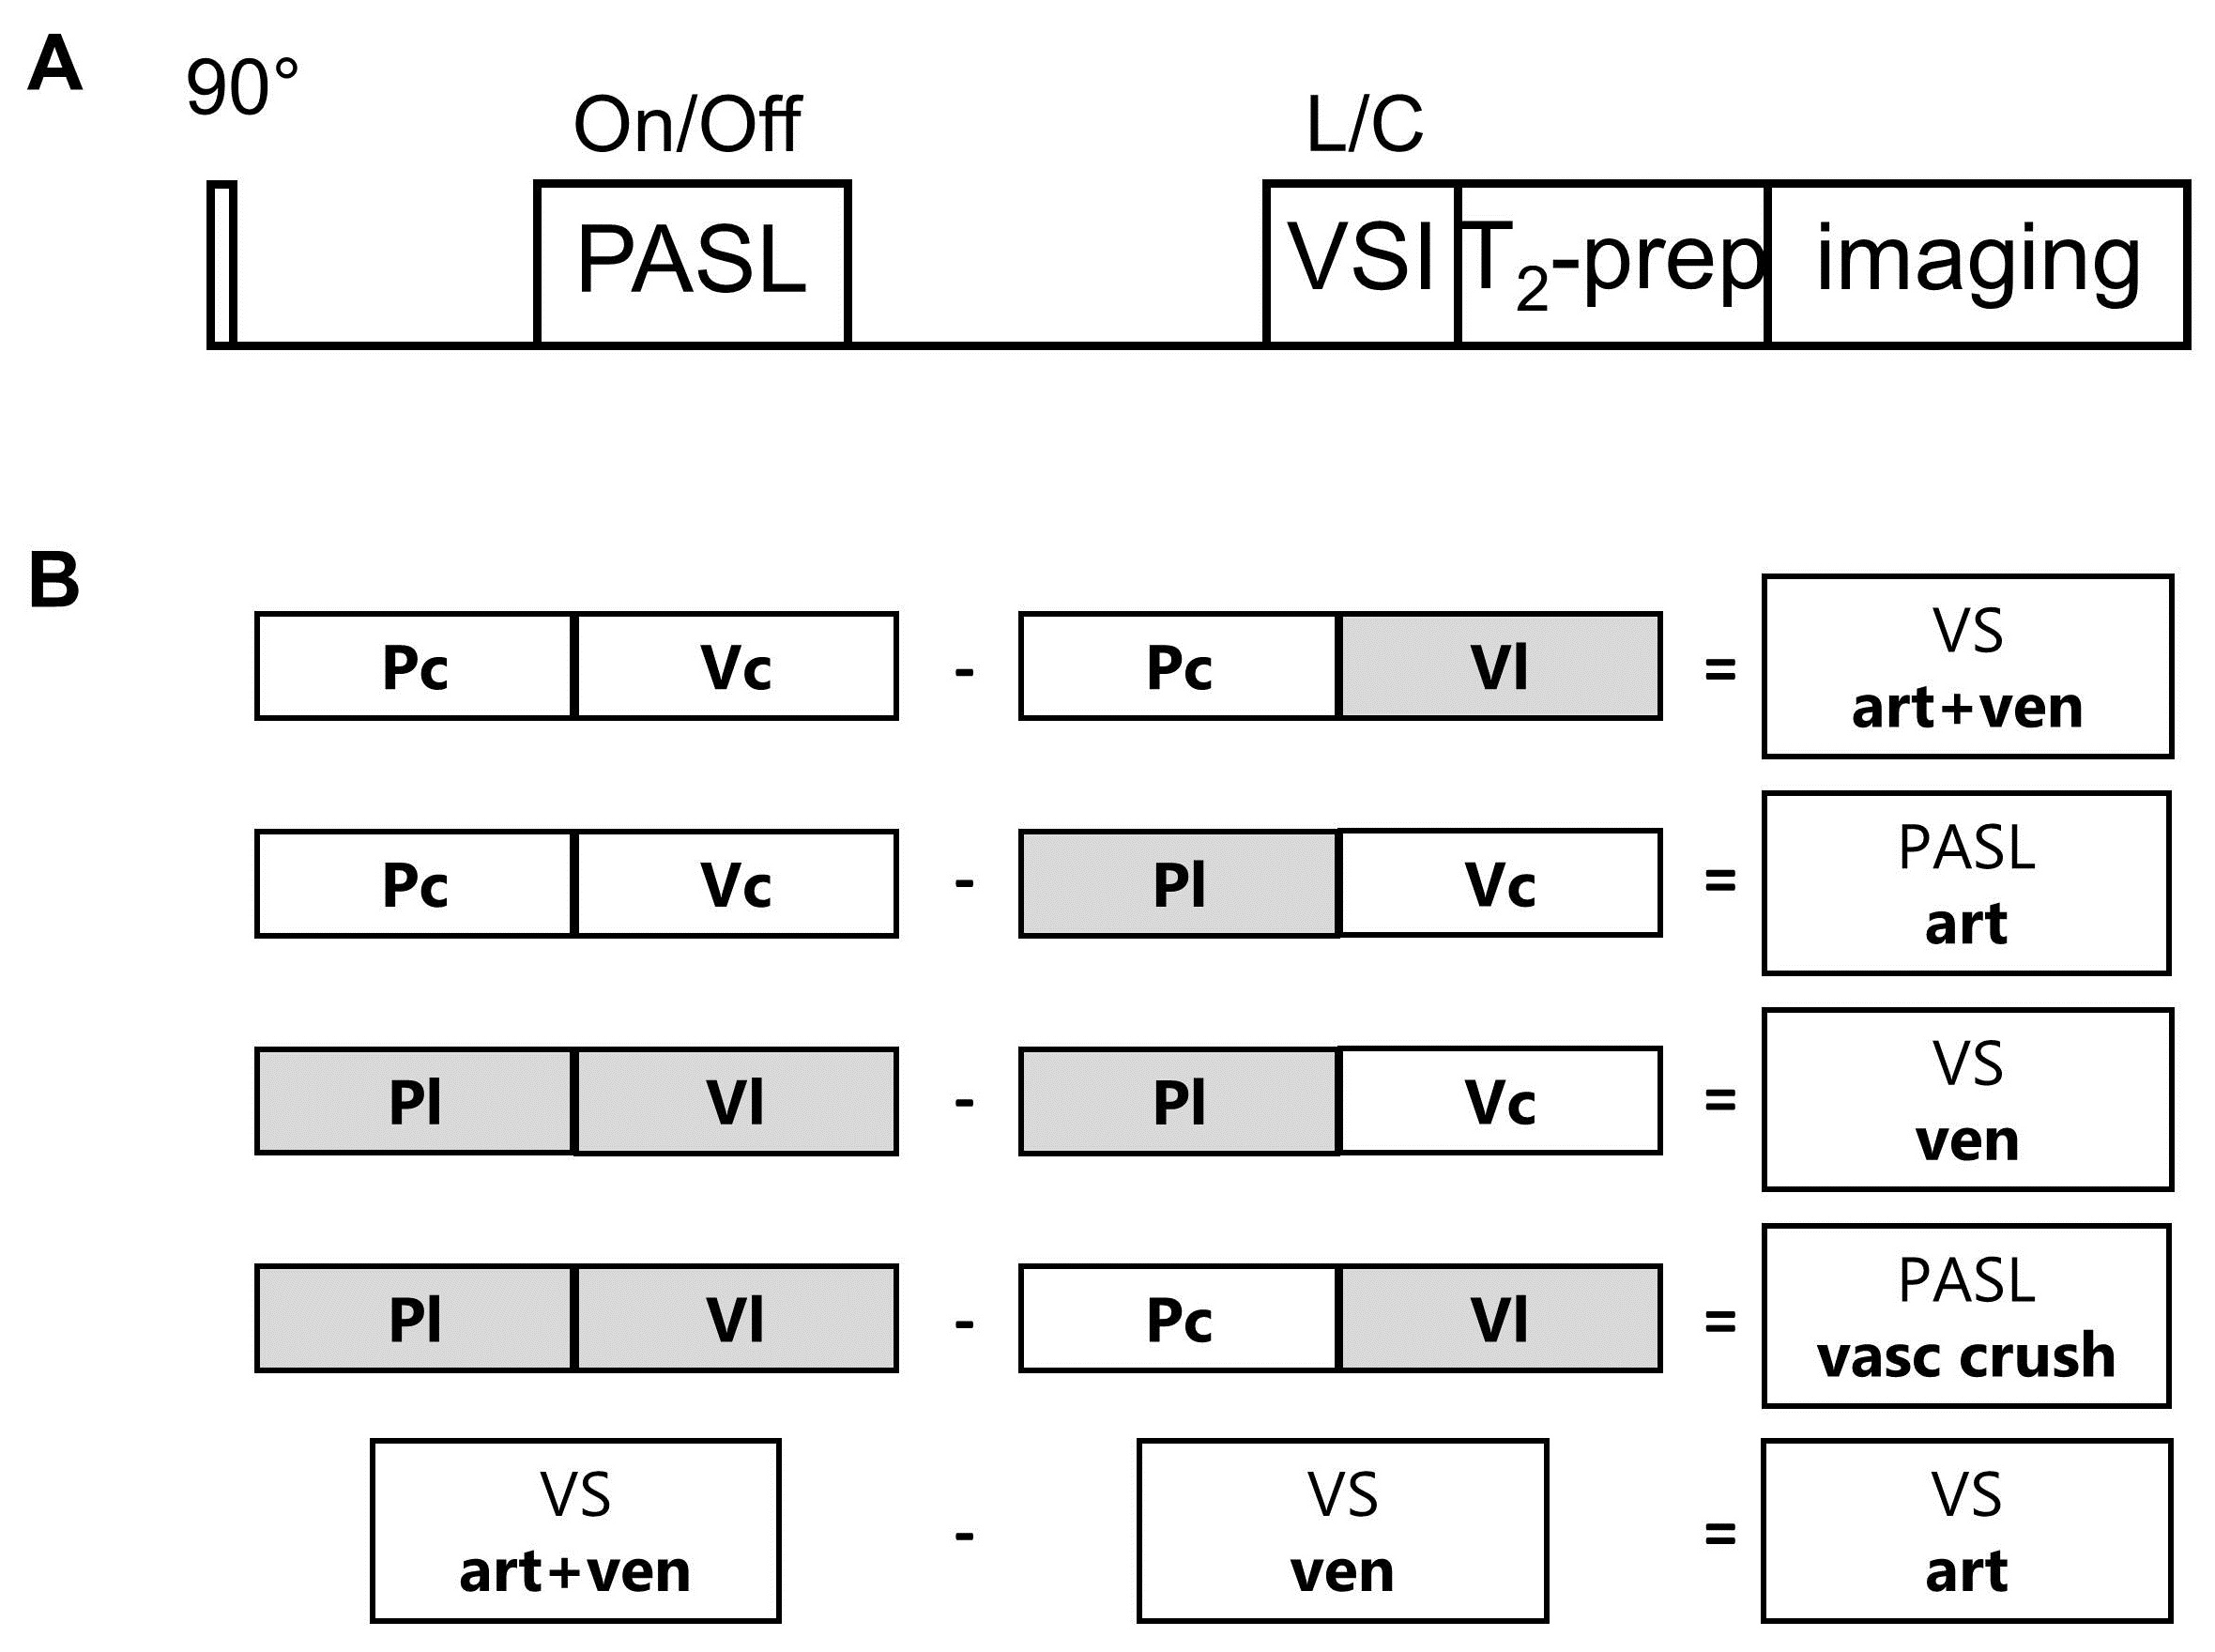
Figure 1.A schematic overview of the venous velocity selective inversion (vVSI) pulse sequence.
A) The spins were inverted by
the pulsed ASL labeling module (STAR, 150mm label thickness) 856ms after the
pre-saturation pulse, followed by a delay of 1144ms before the VSI-labeling
module (vC=1.8cm/s), assuming T1,blood=1664ms. Read out was performed by GE-EPI acquisition
of 17 slices of 7mm thickness at a delay of 500ms. A multi-echo MLEV T2-preparation module (TE=0, 40, 80, 160ms) was added before imaging to estimate the T2-signal to determine the OEF. B) Subtraction scheme to obtain the 5 different images from the 4 labeling conditions.
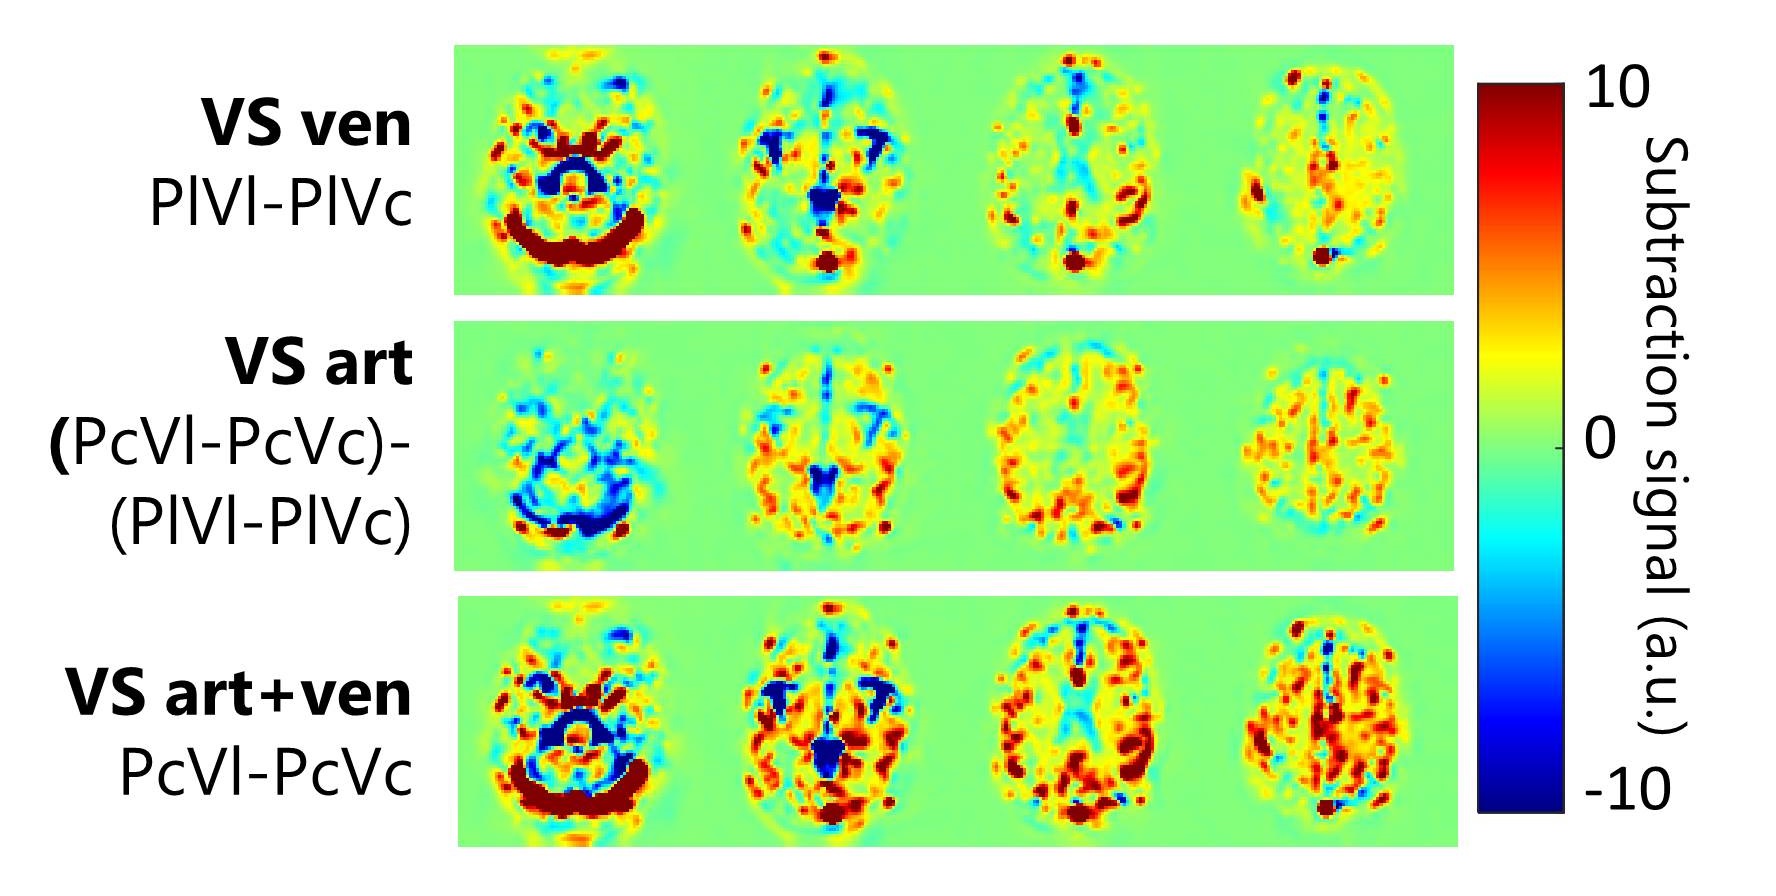
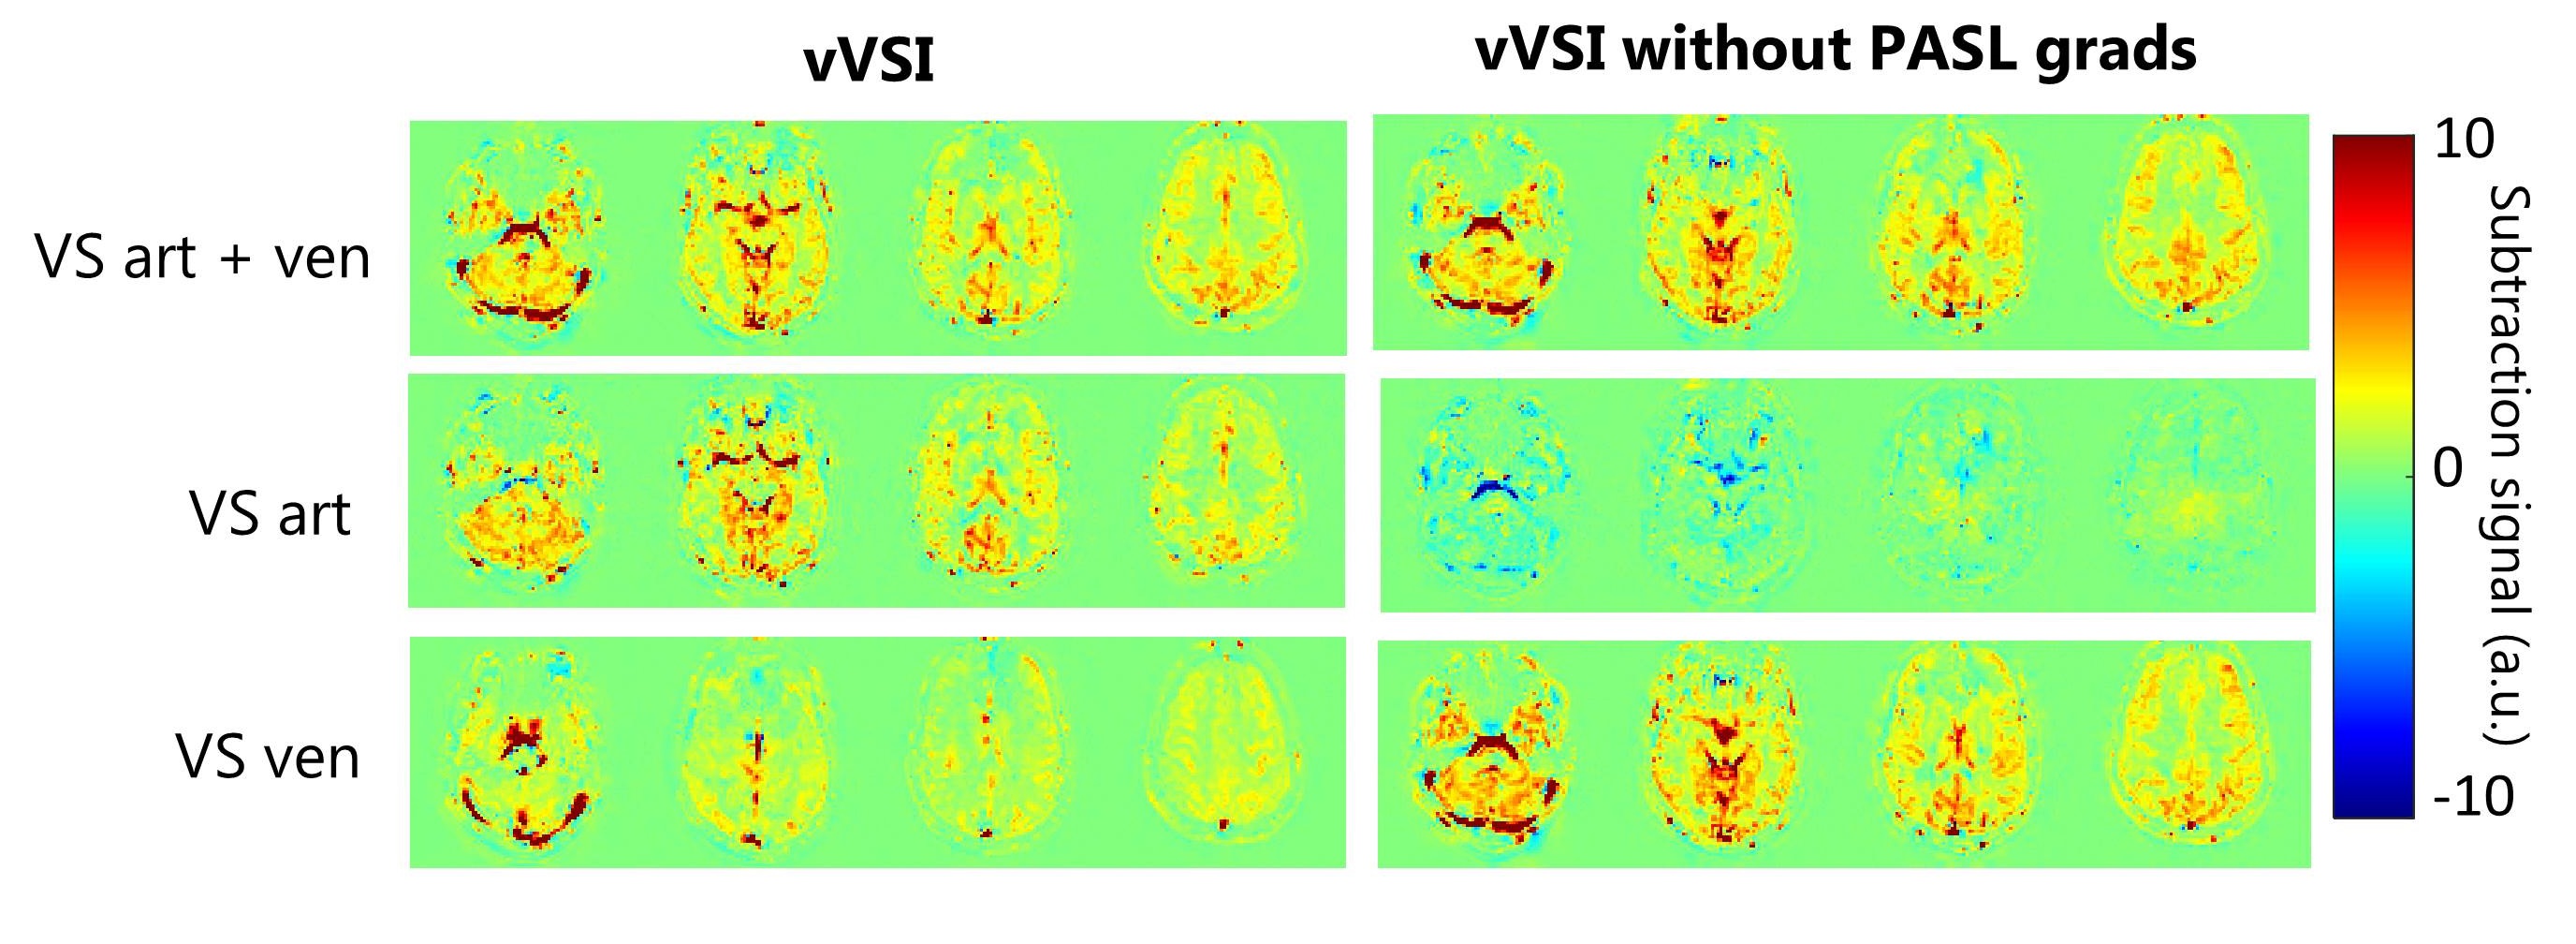
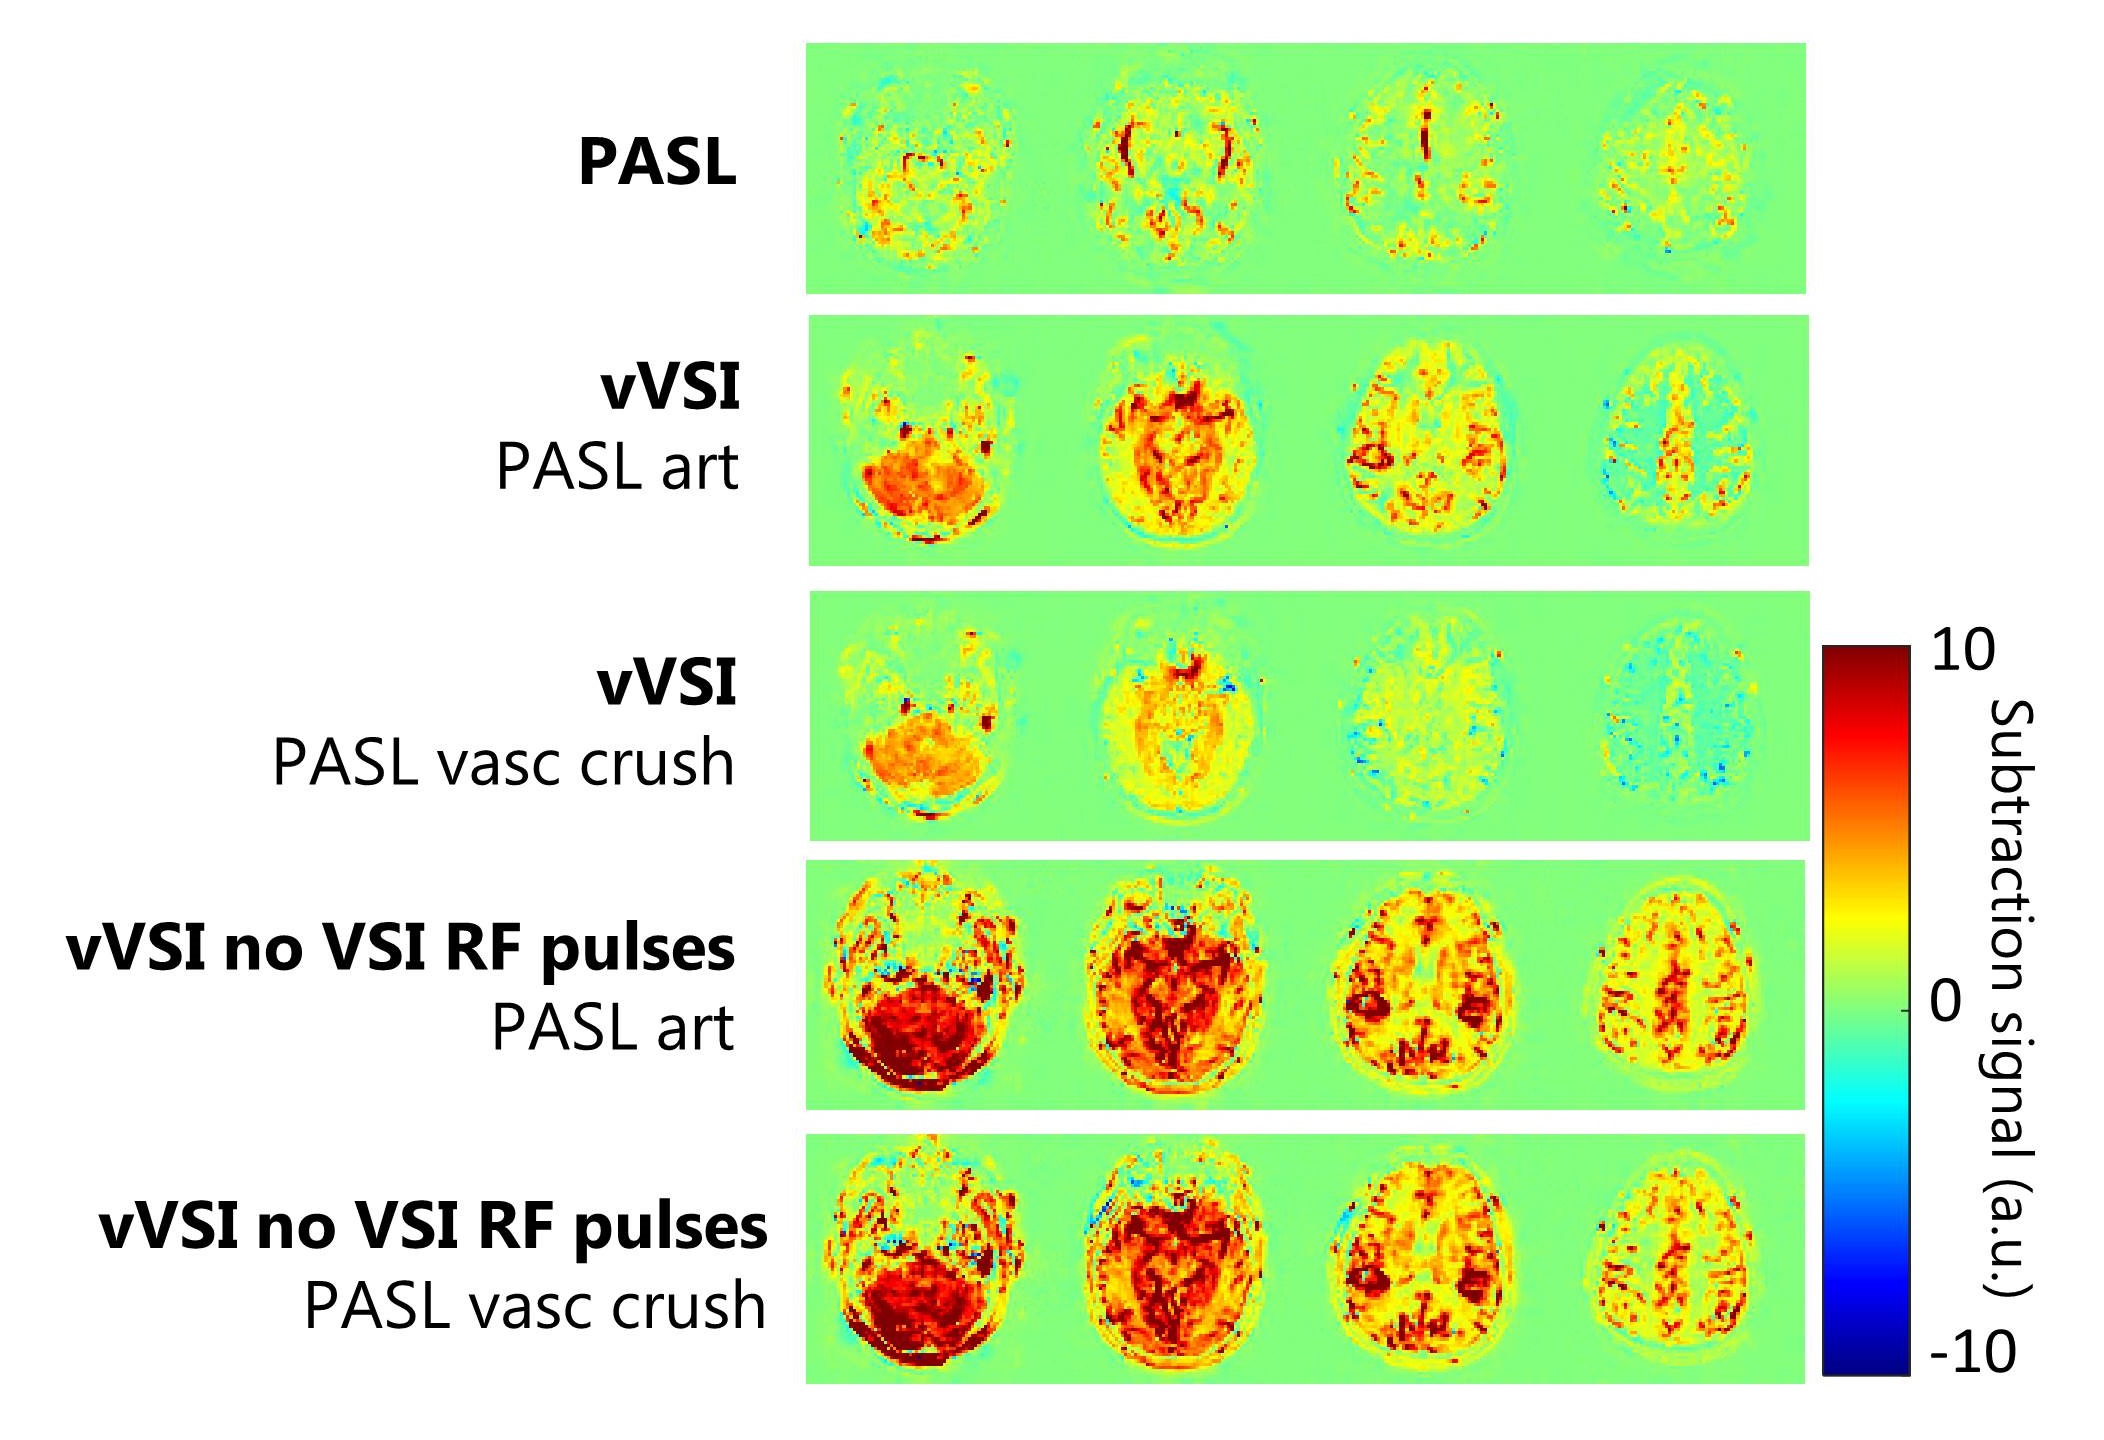
Figure 4. The effect of the VSI-labeling module on the PASL
signal. The PASL image (top) was acquired with a PLD of 1150ms. For the other vVSI images this was 1450ms. The reduction in signal between the second and third image is due to the VSI module as control (Vc) or labeling (Vl) causing vascular crushing. When the RF-pulses from the VSI module are turned off, no difference is found between PASL art (PcVc-PlVc) and PASL vasc crush (PcVL-PLVL).