4966
The influence of the cardiac cycle on Velocity Selective and Acceleration Selective Arterial Spin Labeling, using retrospective triggering.1C.J. Gorter Center for High Field MRI, Department of Radiology, Leiden University Medical Center, Leiden, Netherlands, 2Center of Imaging Sciences, University Medical Center Utrecht, Utrecht, Netherlands
Synopsis
In this study, the influence of the cardiac cycle on the amount of label produced by velocity-selective (VSASL) and acceleration-selective arterial spin labeling (AccASL) was investigated. A sequence combining pCASL and VSASL(AccASL) was developed to isolate the arterial blood pool. Results showed significant arterial signal fluctuations in the amount of label produced by VSASL, AccASL and pCASL over the cardiac cycle. Hence, in order to become independent of the cardiac cycle, sufficient averages need to be taken when applying these techniques. Alternatively, these findings could be highly interesting for the purpose of quantifying pulsatility higher up in the vascular tree.
Introduction
Velocity-selective1 (VSASL) and acceleration-selective arterial spin labeling2 (AccASL) are two ASL methods, that reduce the influence of transit-time by labeling spins based on velocity or acceleration, thereby also labeling within the imaging region. Because of pulsatility of blood flow, variations can be expected in the amount of label created, depending on the cardiac phase during which the VSASL- or AccASL-module is performed. It is important to know whether this effect is significant to allow correct interpretation of these techniques, as well as to maximize temporal SNR, especially when performing fMRI3. In this study, effects of the cardiac cycle on the amount of label produced is investigated for both VSASL and AccASL.Methods
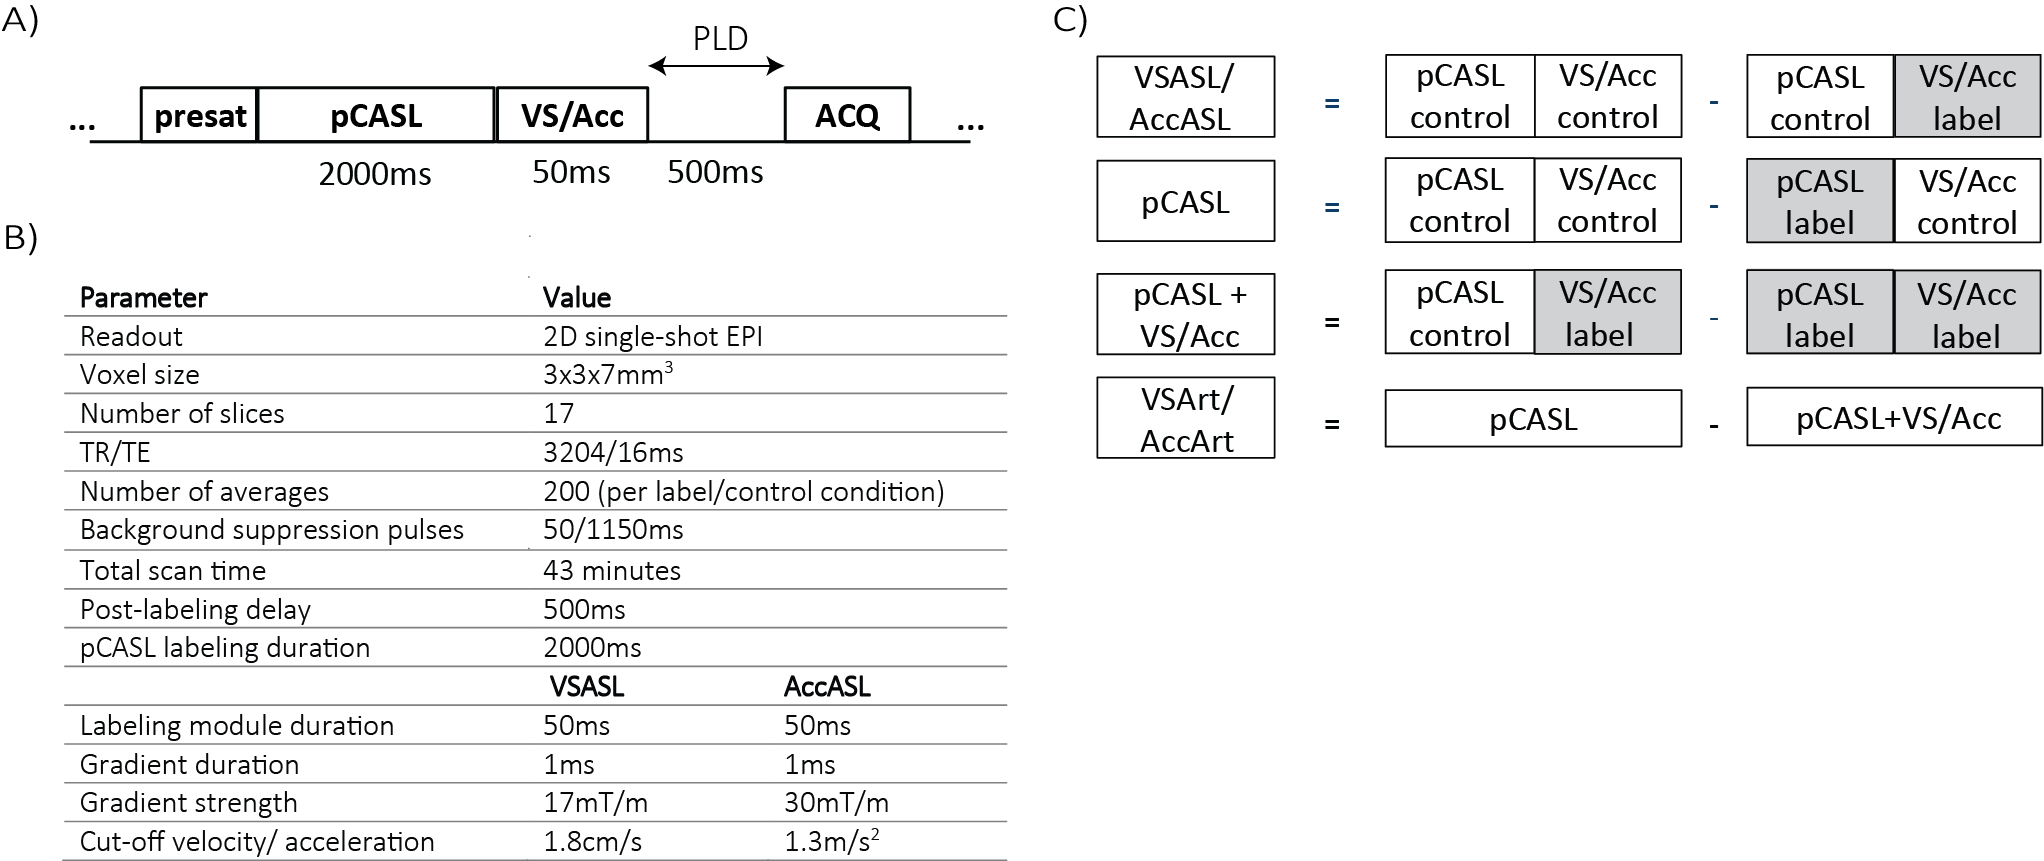
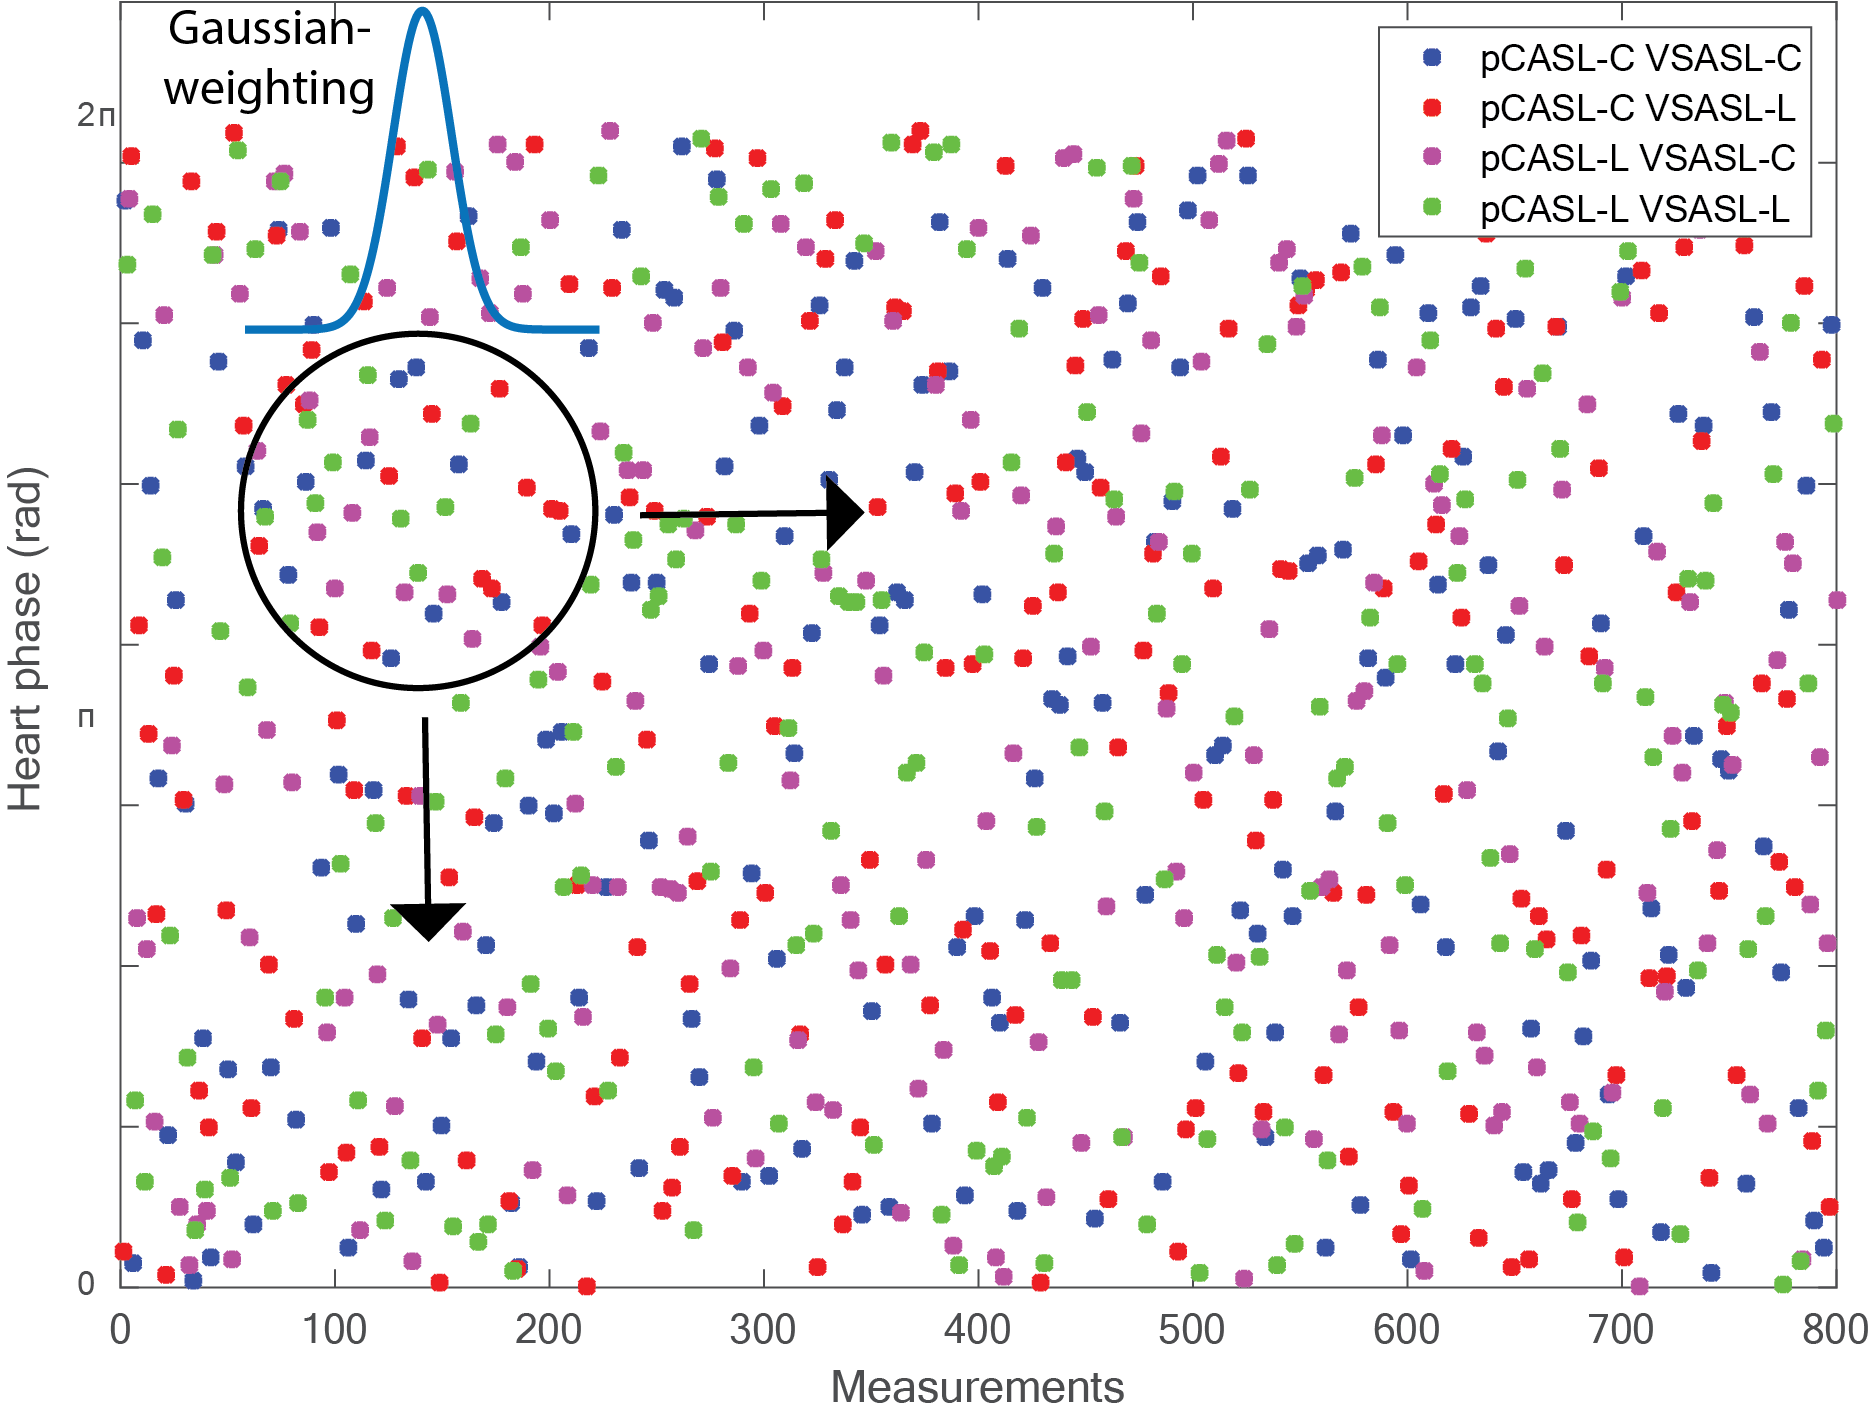
A sequence was developed where pCASL was followed by a single VSASL- or AccASL module to isolate the cardiac effect of these modules on the arterial blood pool, and thereby eliminate potential venous and/or diffusion contributions (Figure 1A). A pulse-oximeter (PPU) was used to register the cardiac phase. Fourteen volunteers were scanned (3T-MRI, Philips), seven for pCASL-VSASL (22–56 years) and seven for pCASL-AccASL (19–59 years), see Figure 1B for scan parameters. All volunteers were screened for MRI contra-indications and provided written informed consent. Furthermore, a cine phase-contrast scan with PPU-triggering, as well as a 3D-T1w-image (for gray-matter mask) and a whole-brain phase-contrast angiography (arterial mask) were acquired. All images were realigned (SPM12) and data analysis was conducted in Matlab. The data yielded four label/control conditions. For subtraction, pairs of label/control conditions needed to be found with similar times of measurement (to correct for scanner-drift) and heart phases, see Figure 2. Subtractions were performed, obtaining four different ASL images; single-VSASL(AccASL), pCASL, a crushed pCASL-image (pCASL followed by VSASL(AccASL) crushing) and VSArt(AccArt) that isolates the effect of VSASL(AccASL)-crushing on the pCASL label (Figure 1C). All ASL-images were binned into ten cardiac phase bins. The percentage signal change was calculated and plotted for each cardiac phase. A permutation test was performed to test whether the observed signal variance over the cardiac cycle is significantly higher than expected from noise. The heart phase of each datapoint was randomly permuted and the resulting variance over the cardiac cycle was calculated. This was repeated 250 times to build a volunteer-specific distribution, in order to test whether the observed variance lay within this distribution (α = 0.05).Results
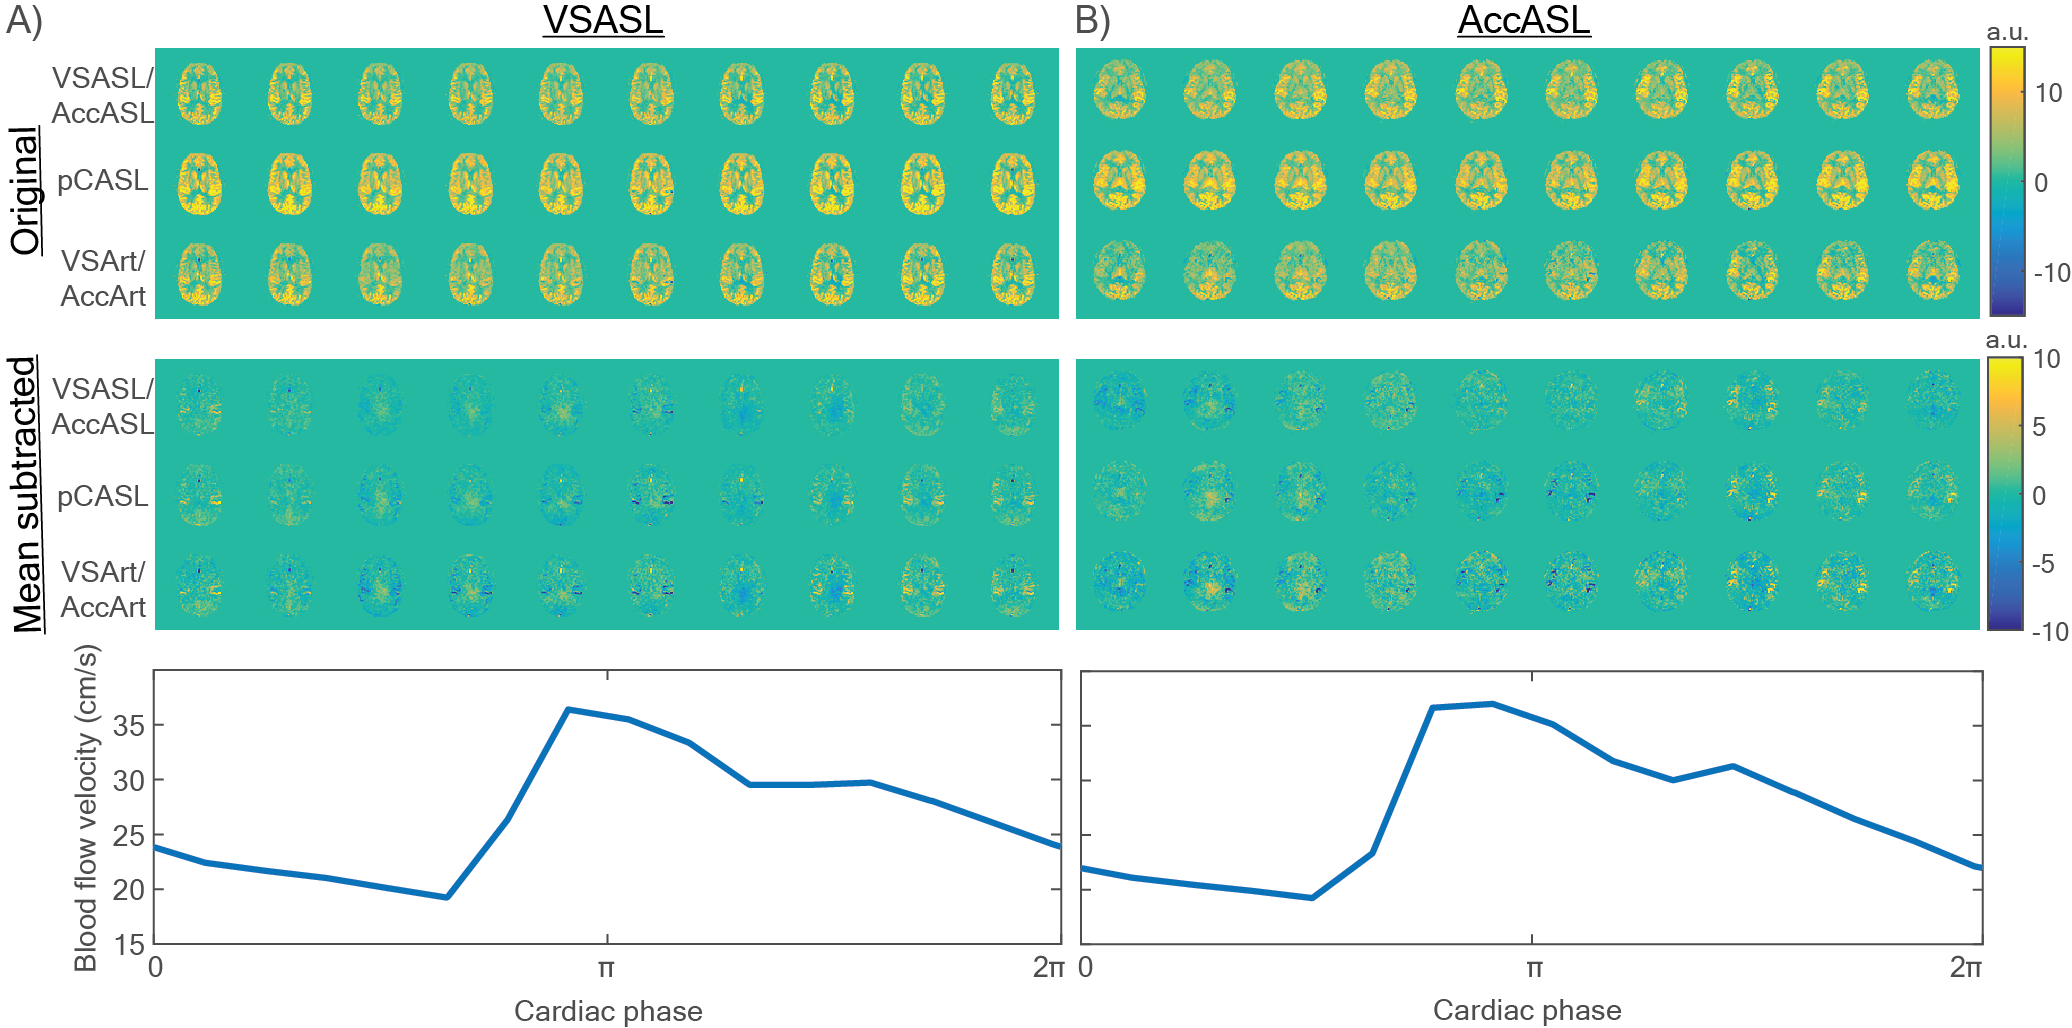
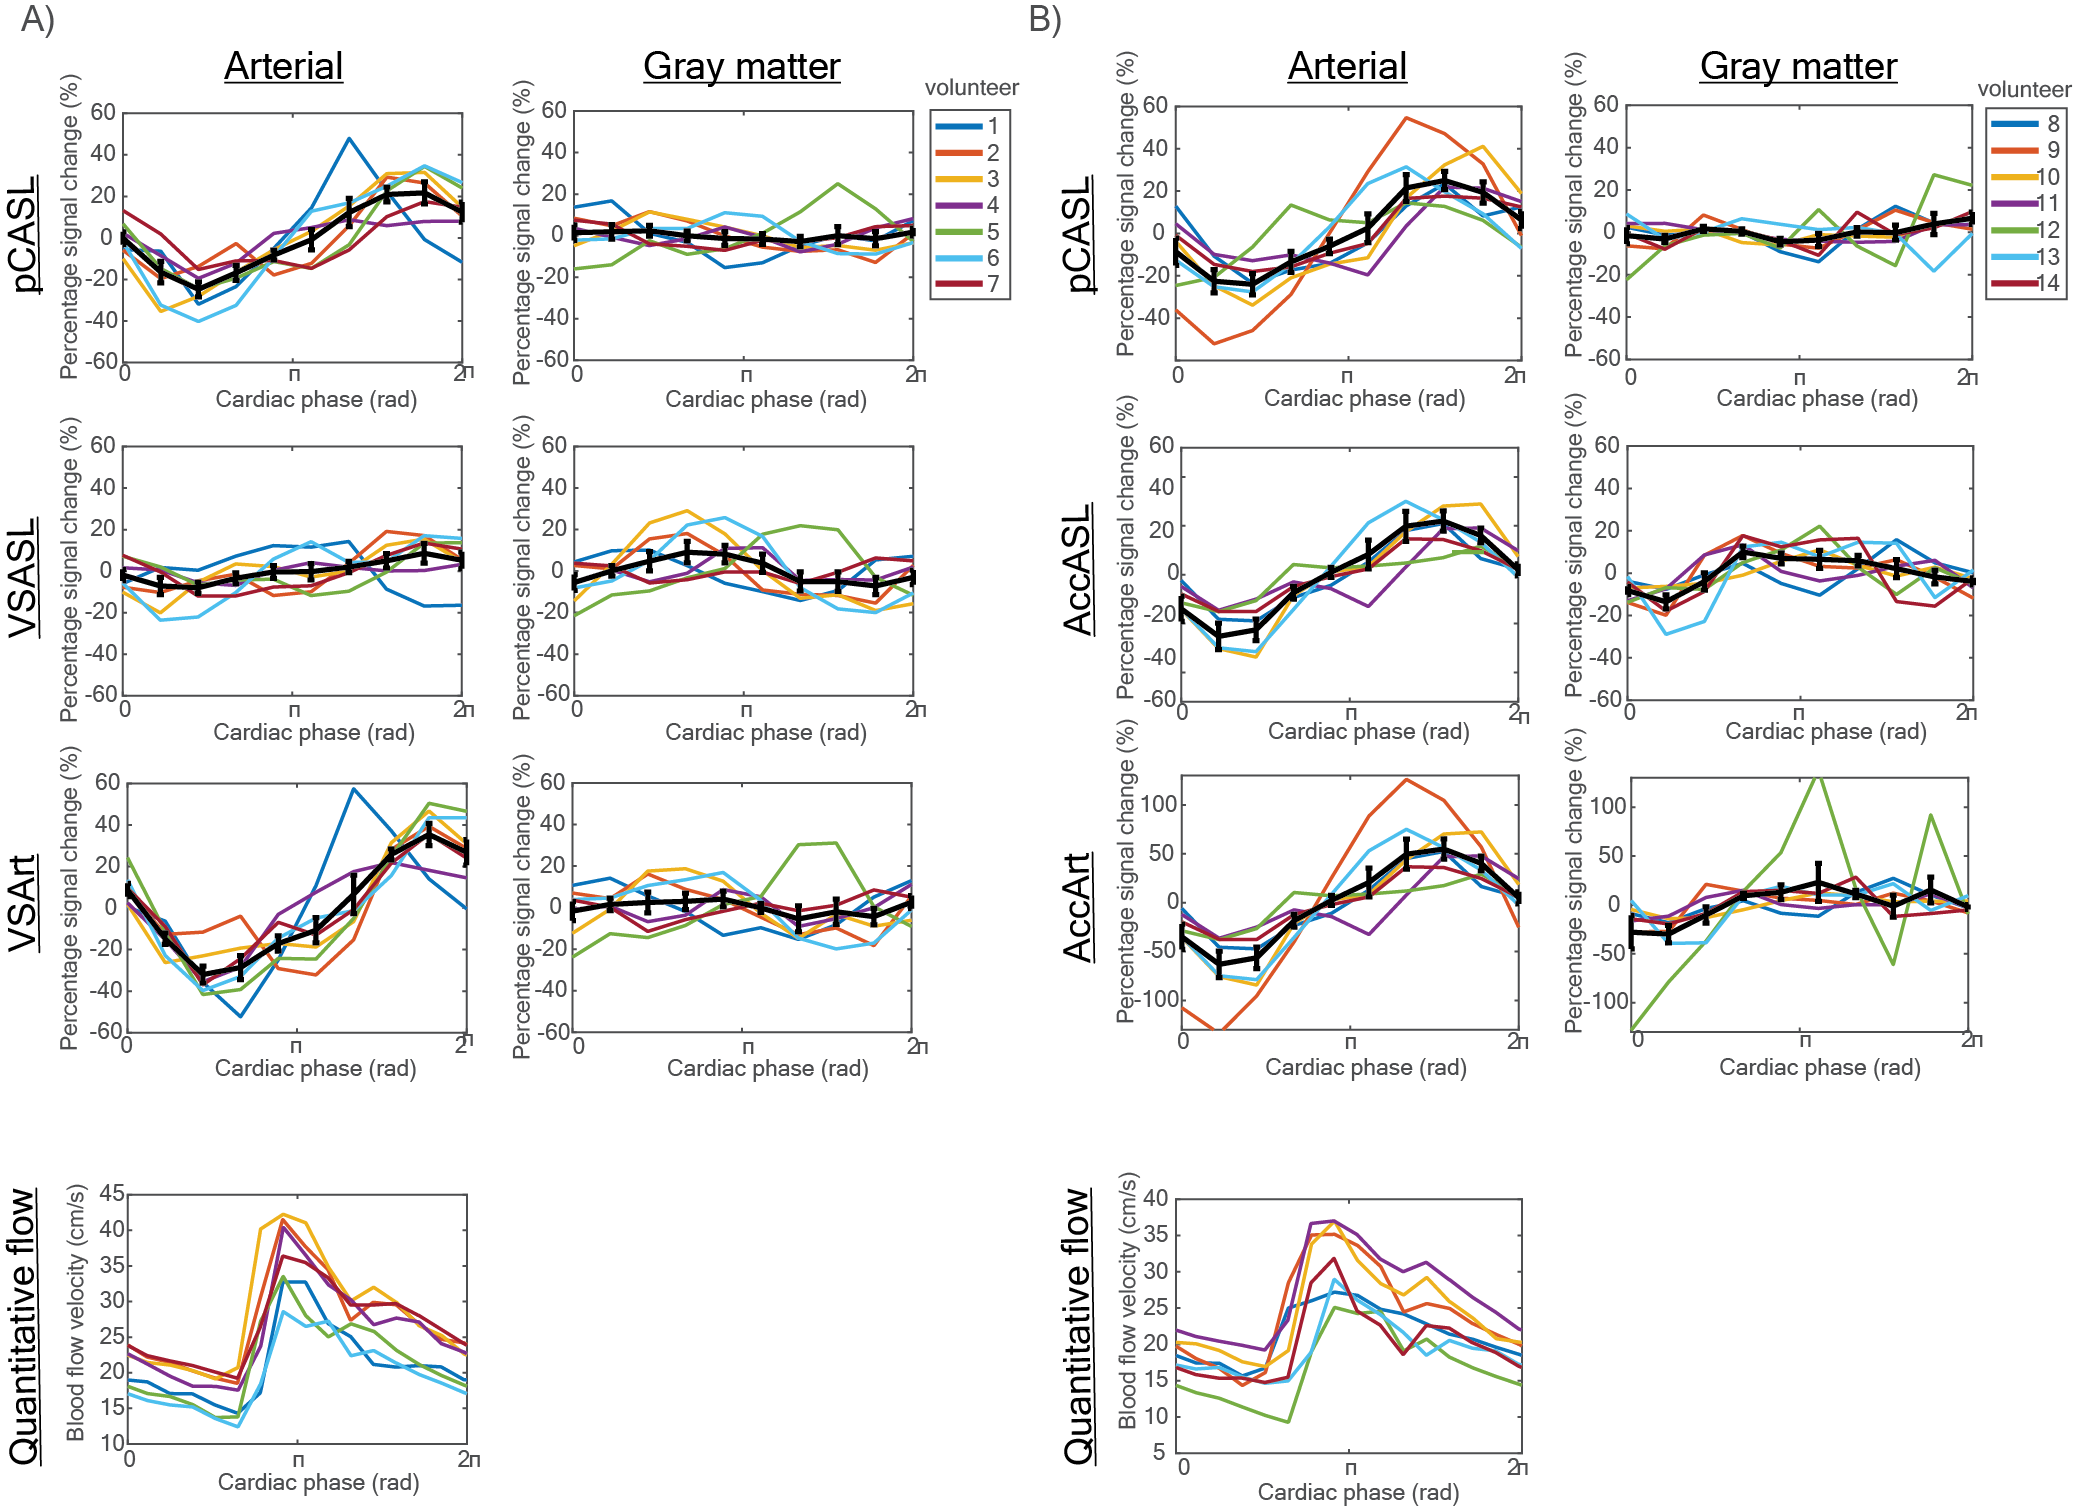
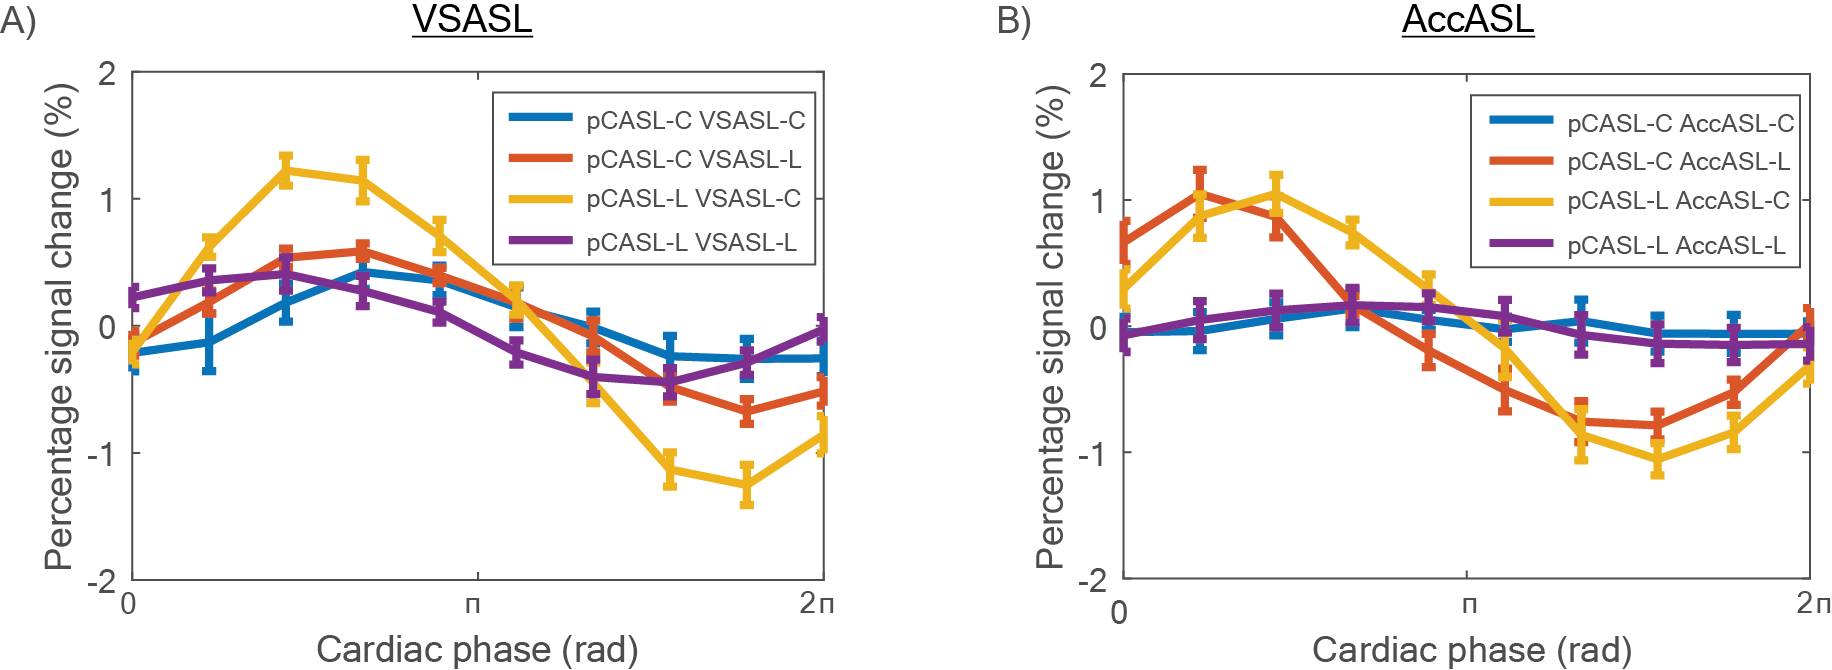
Images of two representative volunteers are shown in Figure 3. Both the VSASL and the AccASL dataset show arterial signal fluctuations over the cardiac cycle, and to a lesser extent also gray matter fluctuations. Averaged for all volunteers, VSArt shows significant arterial signal fluctuations over the cardiac cycle of up to 35%, just as AccArt (63%) and pCASL (25%, both datasets), see Figure 4. Single-VSASL (9%) and single-AccASL (28%) both showed significant fluctuations over the cardiac cycle for 6 out of 7 volunteers. Gray matter signal fluctuations were not consistently significant for any of the ASL-images. Looking at the label/control conditions a clear pattern emerges (Figure 5), averaged over all volunteers, the [pCASL-control VSASL(AccASL)-control] and [pCASL-label VSASL(AccASL)-label] images show less fluctuations than [pCASL-label VSASL(AccASL)-control] and [pCASL-label VSASL(AccASL)-control] images, most prominently for AccASL.Discussion & conclusion
The results showed that the arterial part of the label generated by a single VSASL- and AccASL-module (VSArt and AccArt) fluctuates significantly over the cardiac cycle. pCASL, single-VSASL and single-AccASL images also show significant arterial fluctuations over the cardiac cycle. Single-VSASL showed less fluctuations than VSArt, which could be explained by the fact that single-VSASL also labels venous blood, which will be less dependent on the cardiac cycle. This agrees with the observation that single-AccASL showed similar fluctuations as AccArt, since AccASL has minimal venous blood labeling2. Signal intensity plots of the label/control conditions suggest that the fluctuations over the cardiac cycle are not caused by fresh inflow, which would impact all four images equally. This supports the idea that the fluctuations are indeed caused by the amount of label produced. In previous work, we used a triggered sequence which gave promising, albeit inconclusive results, because the cardiac cycle was sampled in only five phases and less samples could be acquired4. This study has shown that VSASL, AccASL, and pCASL fluctuate significantly over the cardiac cycle. Sufficient averages need to be taken when applying these techniques, in order to become independent of the cardiac cycle. In addition, this shows the potential of VSASL and AccASL to measure pulsatility higher up in the vascular tree.Acknowledgements
This work is part of the research programme Drag ‘n Drop ASL with project number 14951, which is (partly) financed by the Netherlands Organisation for Scientific Research (NWO).References
1. Wong EC, Cronin M, Wu WC, Inglis B, Frank LR, and Liu TT. Velocity-Selective Arterial Spin Labeling. Magnetic Resonance in Medicine 2006; 55:1334-1341.
2. Schmid S, Ghariq E, Teeuwisse WM, Webb A, and Van Osch MJP. Acceleration-selective Arterial Spin Labeling. Magnetic Resonance in Medicine 2014; 71:191-199.
3. Hernandez-Garcia L, Nielson J-F, Noll DC. Improved sensitivity and temporal resolution in perfusion fMRI using velocity selective inversion ASL. Magnetic Resonance in Medicine 2018; 00:1–12.
4. Franklin SL, Schmid S, Bos C, Van Osch MJP. The influence of the cardiac cycle on velocity-selective and acceleration-selective Arterial Spin Labeling. Presented at ISMRM Conference 2018, Paris, France.
Figures