4964
Optimization of Velocity-Selective-Inversion Arterial Spin Labeling (VSI-ASL) with 3D Whole-Brain Coverage1Johns Hopkins University School of Medicine, Department of Radiology, Baltimore, MD, United States, 2Kennedy Krieger Institute, F.M. Kirby Research Center for Functional Brain Imaging, Baltimore, MD, United States
Synopsis
Velocity-selective arterial spin labeling (VSASL) has the advantage of insensitivity to transit time delay compared to the spatially selective method, thus potentially providing more accurate and robust blood flow measurements in cerebrovascular diseases. Fourier-transform based velocity-selective inversion (FT-VSI) prepared ASL has higher sensitivity to perfusion signal than conventional velocity-selective saturation (VSS) prepared methods. To date, VSASL has largely been implemented with 2D EPI acquisitions. However, a 3D readout is preferred for ASL techniques. This study demonstrated the feasibility of FT-VSI prepared VSASL with 3D whole-brain coverage and compared it with conventional VSS ASL and pseudo-continuous ASL (PCASL) at 3T.
Introduction
Advantages of the velocity-selective arterial spin labeling (VSASL)1 include insensitivity to transit delay and no need for prescribing a labeling plane. Both the conventional velocity-selective saturation (VSS) and the Fourier-transform based velocity-selective inversion (FT-VSI) prepared ASL methods have previously been demonstrated with 2D readouts1–7. However, for ASL techniques, a 3D readout is preferred for larger spatial coverage, higher SNR efficiency and more spatially consistent background suppression. In addition, choice of post labeling delay (PLD) of VSASL for maximum perfusion signal can be affected by several factors, including blood velocity, transmit coil coverage and B0/B1 inhomogeneity. In this study, FT-VSI pulse train and PLD were further optimized with 3D readouts. Comparisons with pseudo-continuous ASL (PCASL)8 and VSS were performed.Methods
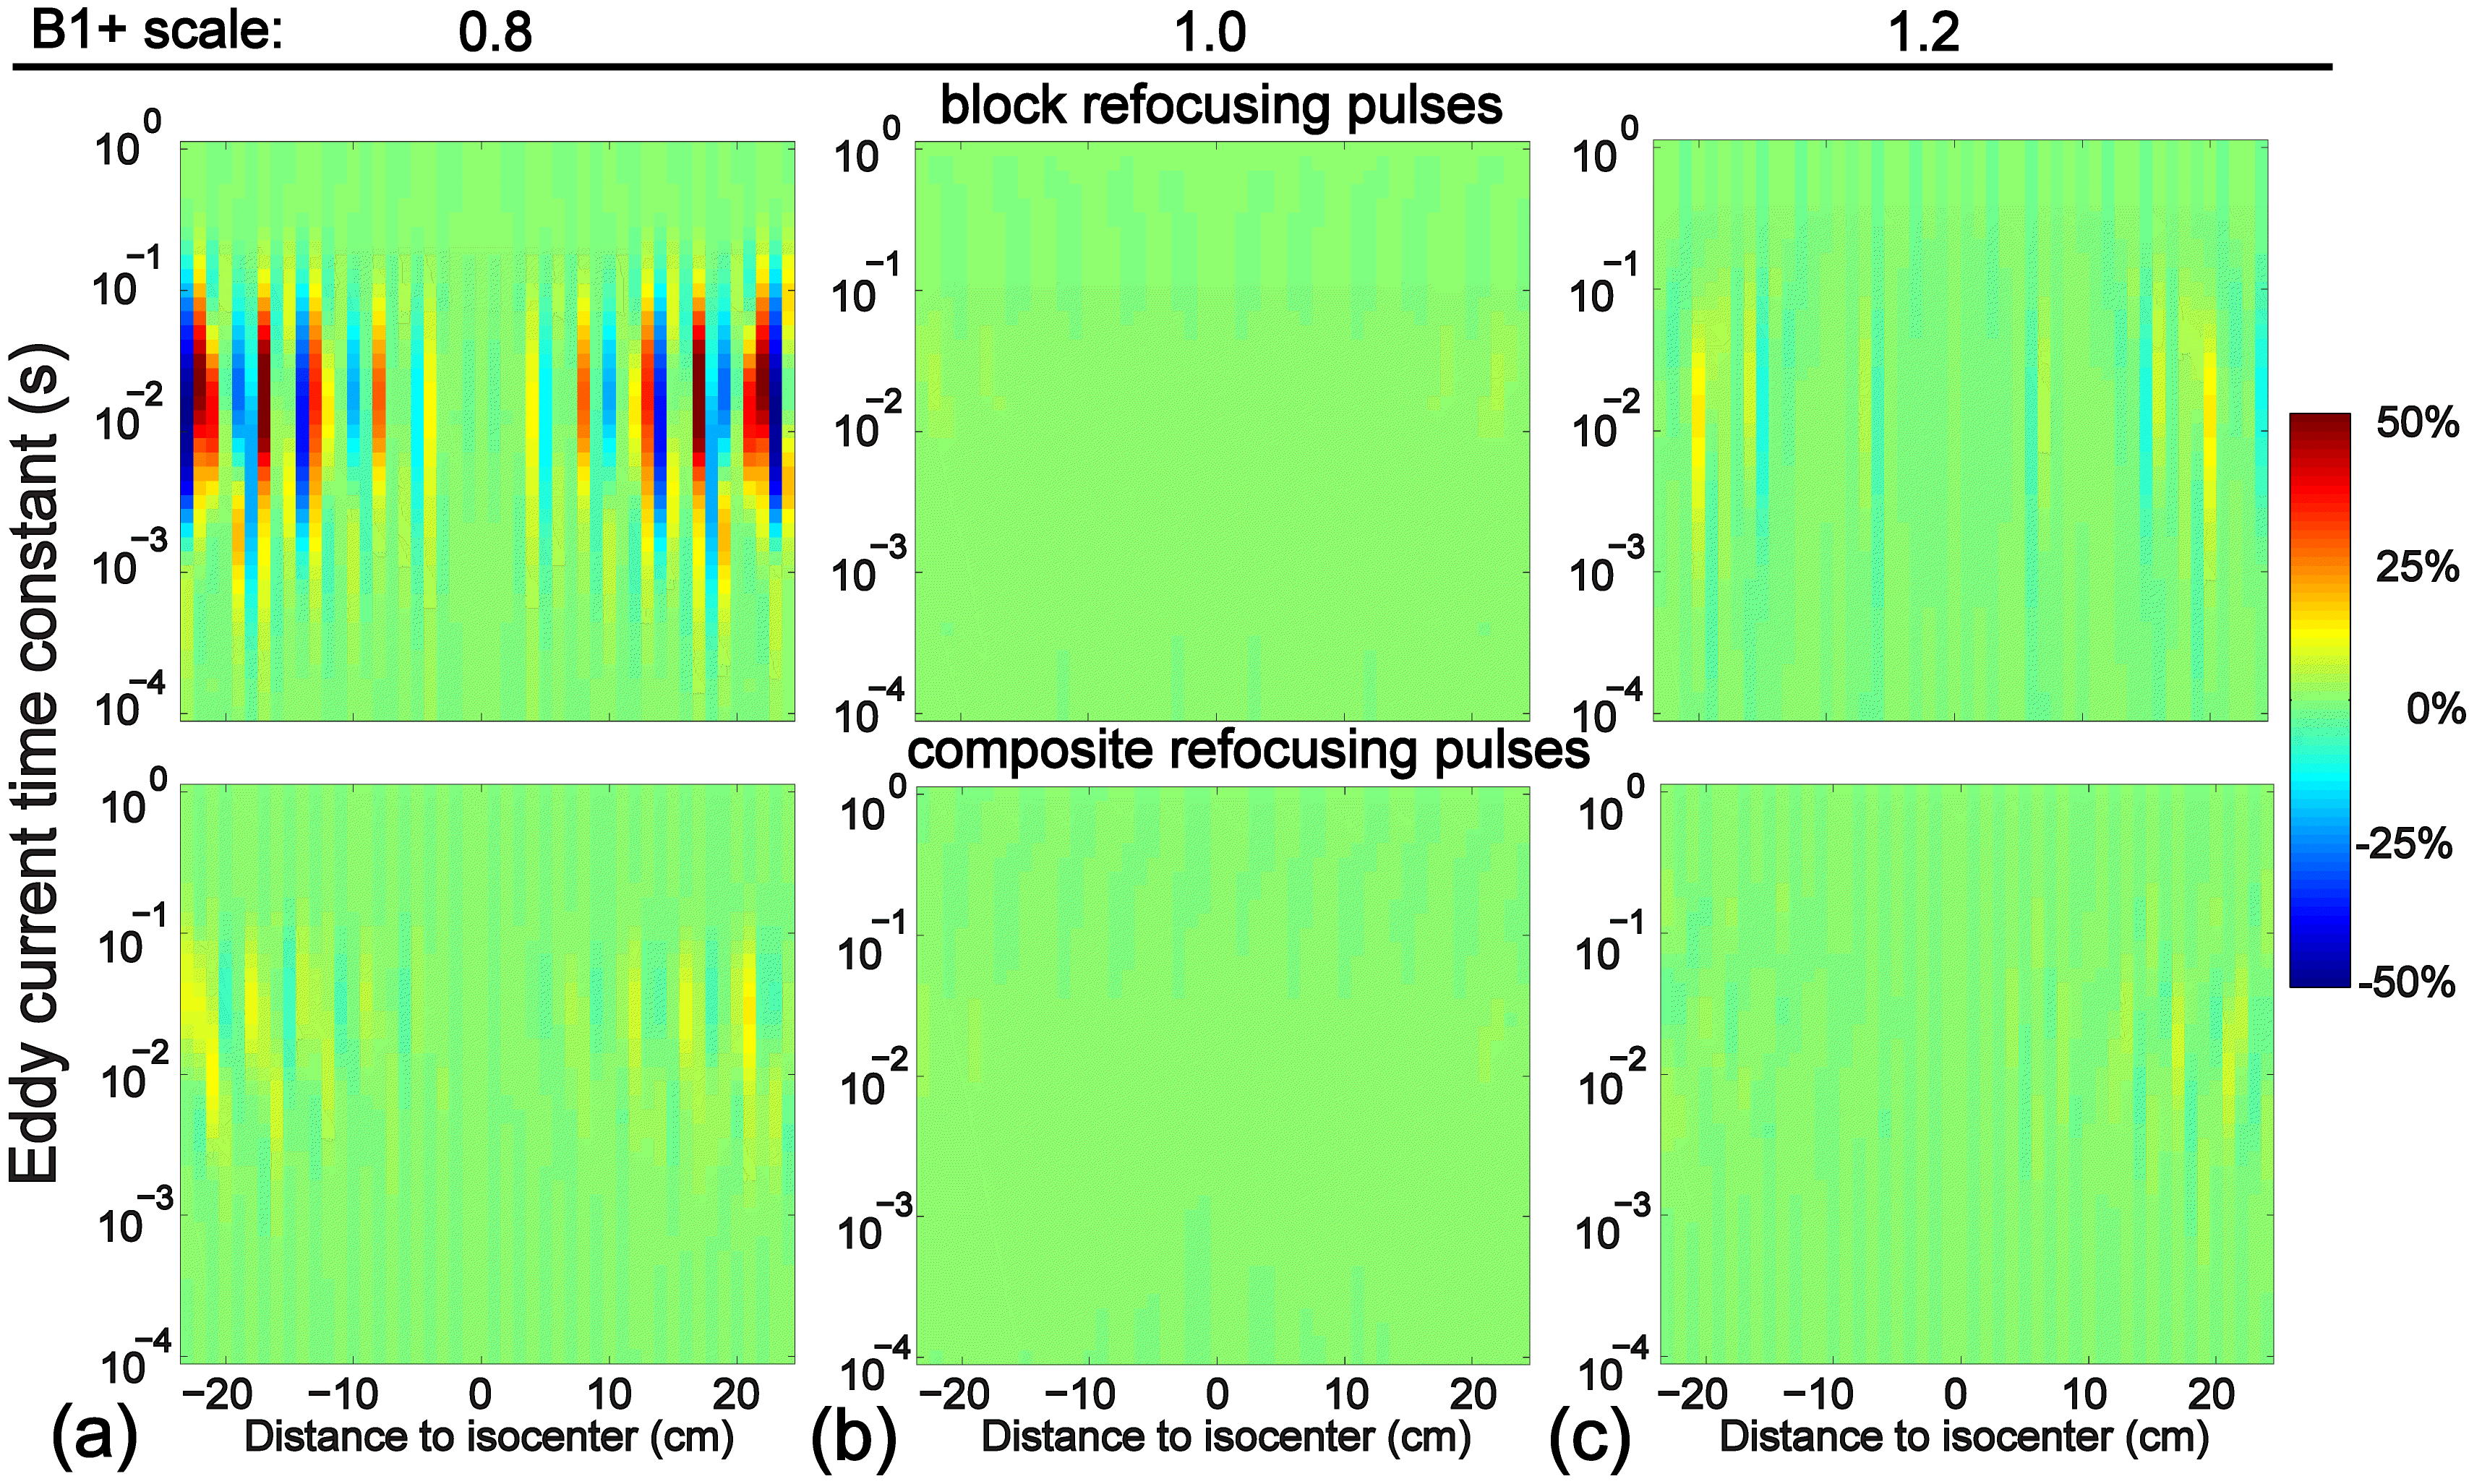
FT-VSI pulse trains utilizing block refocusing pulses are sensitive to eddy currents at incorrect B1+. The effect of eddy currents on the static spins after applying FT-VSI pulse trains with both block and composite refocusing pulses were examined by numerical simulations with eddy-current amplitude of 0.25% and time constants between 10-4-1 sec, at various B1+ scales.
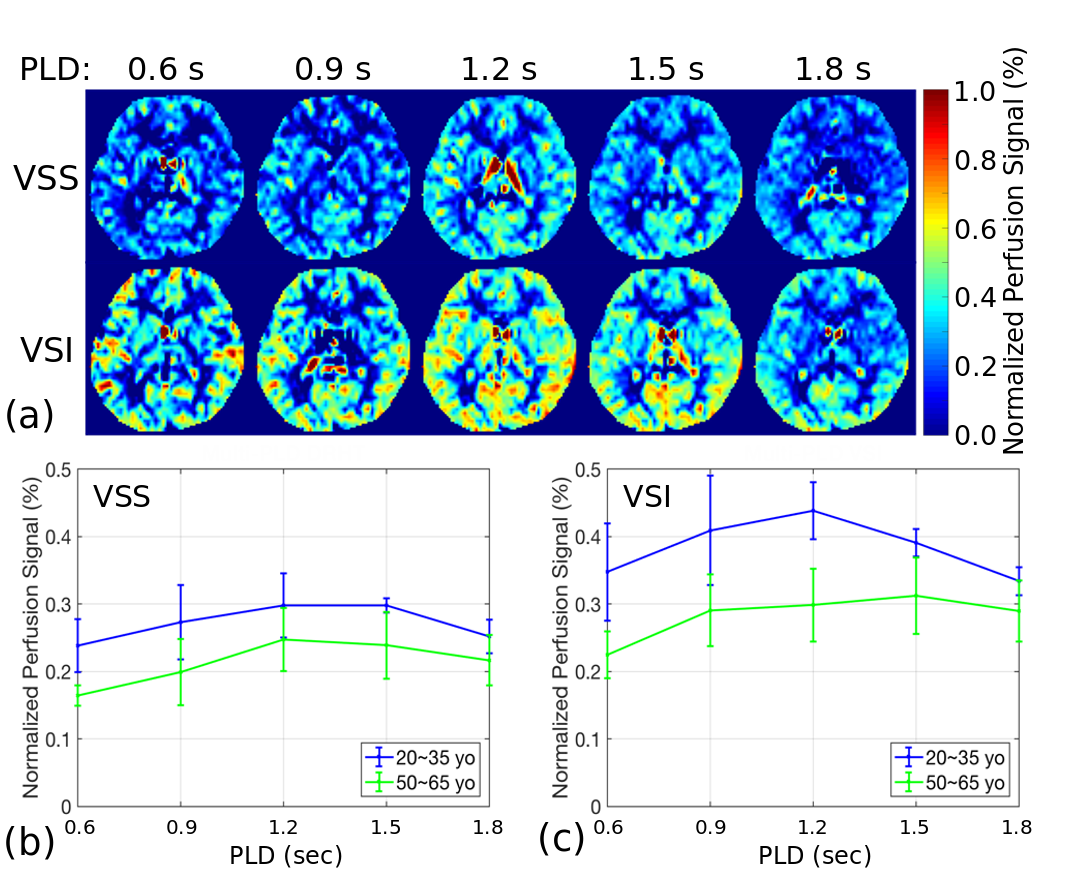
Experiments of PLD optimization and signal comparison were conducted using a 3T Siemens Prisma scanner on healthy adults divided into two age groups: 1) 20-35 years old (n=5, 3 male and 2 female) and 2) 50-65 years old (n=5, 2 male and 3 female). To optimize the PLD of VSASL, five PLDs were tested for both VSS and FT-VSI: 0.6, 0.9, 1.2, 1.5, 1.8 sec. A T2prep module with crusher gradients was applied before readout to suppress large-vessel signals (cutoff velocity Vc=3 cm/sec). A 3D gradient- and spin-echo (GRASE) readout (two-shots) was used to cover eight slices in the middle of the brain. Eight dynamics were acquired for each PLD (1.5-2.5 min each). The PLD that gave the highest normalized perfusion signal in grey matter (GM), defined as the difference between label and control divided by M0, was chosen as the optimized PLD.
With the optimized PLD, VSS and FT-VSI were compared with PCASL. For VSS and FT-VSI, sequence was similar as PLD optimization experiments, except number of dynamics increasing to 20 and the total scan time to about 5 min. For PCASL, the labeling duration was 2 sec and PLD was 2 sec, as recommended for patients9,10, while readout and flow-dephasing module were similar to VSS and FT-VSI, with 16 dynamics also costing about 5 min. Finally, whole brain 3D imaging (12 shots) of PCASL (3 dynamics, 5.5 min), VSS and VSI (3 dynamics, 4.5 min) was performed on a subset of two subjects.
Results
Fig. 1 shows the simulation results for the FT-VSI pulse train: Compared to block refocusing pulses, composite refocusing pulses (90x180y90x) reduced eddy-current related errors most significantly for B1+=0.8.
The normalized perfusion-weighted images of one middle slice from VSS and FT-VSI prepared ASL with 3D GRASE acquisition at different PLDs are demonstrated in Fig. 2. A PLD of 1.2 sec yielded maximal perfusion signal change among most of the subjects and was chosen for the following VSASL scans.
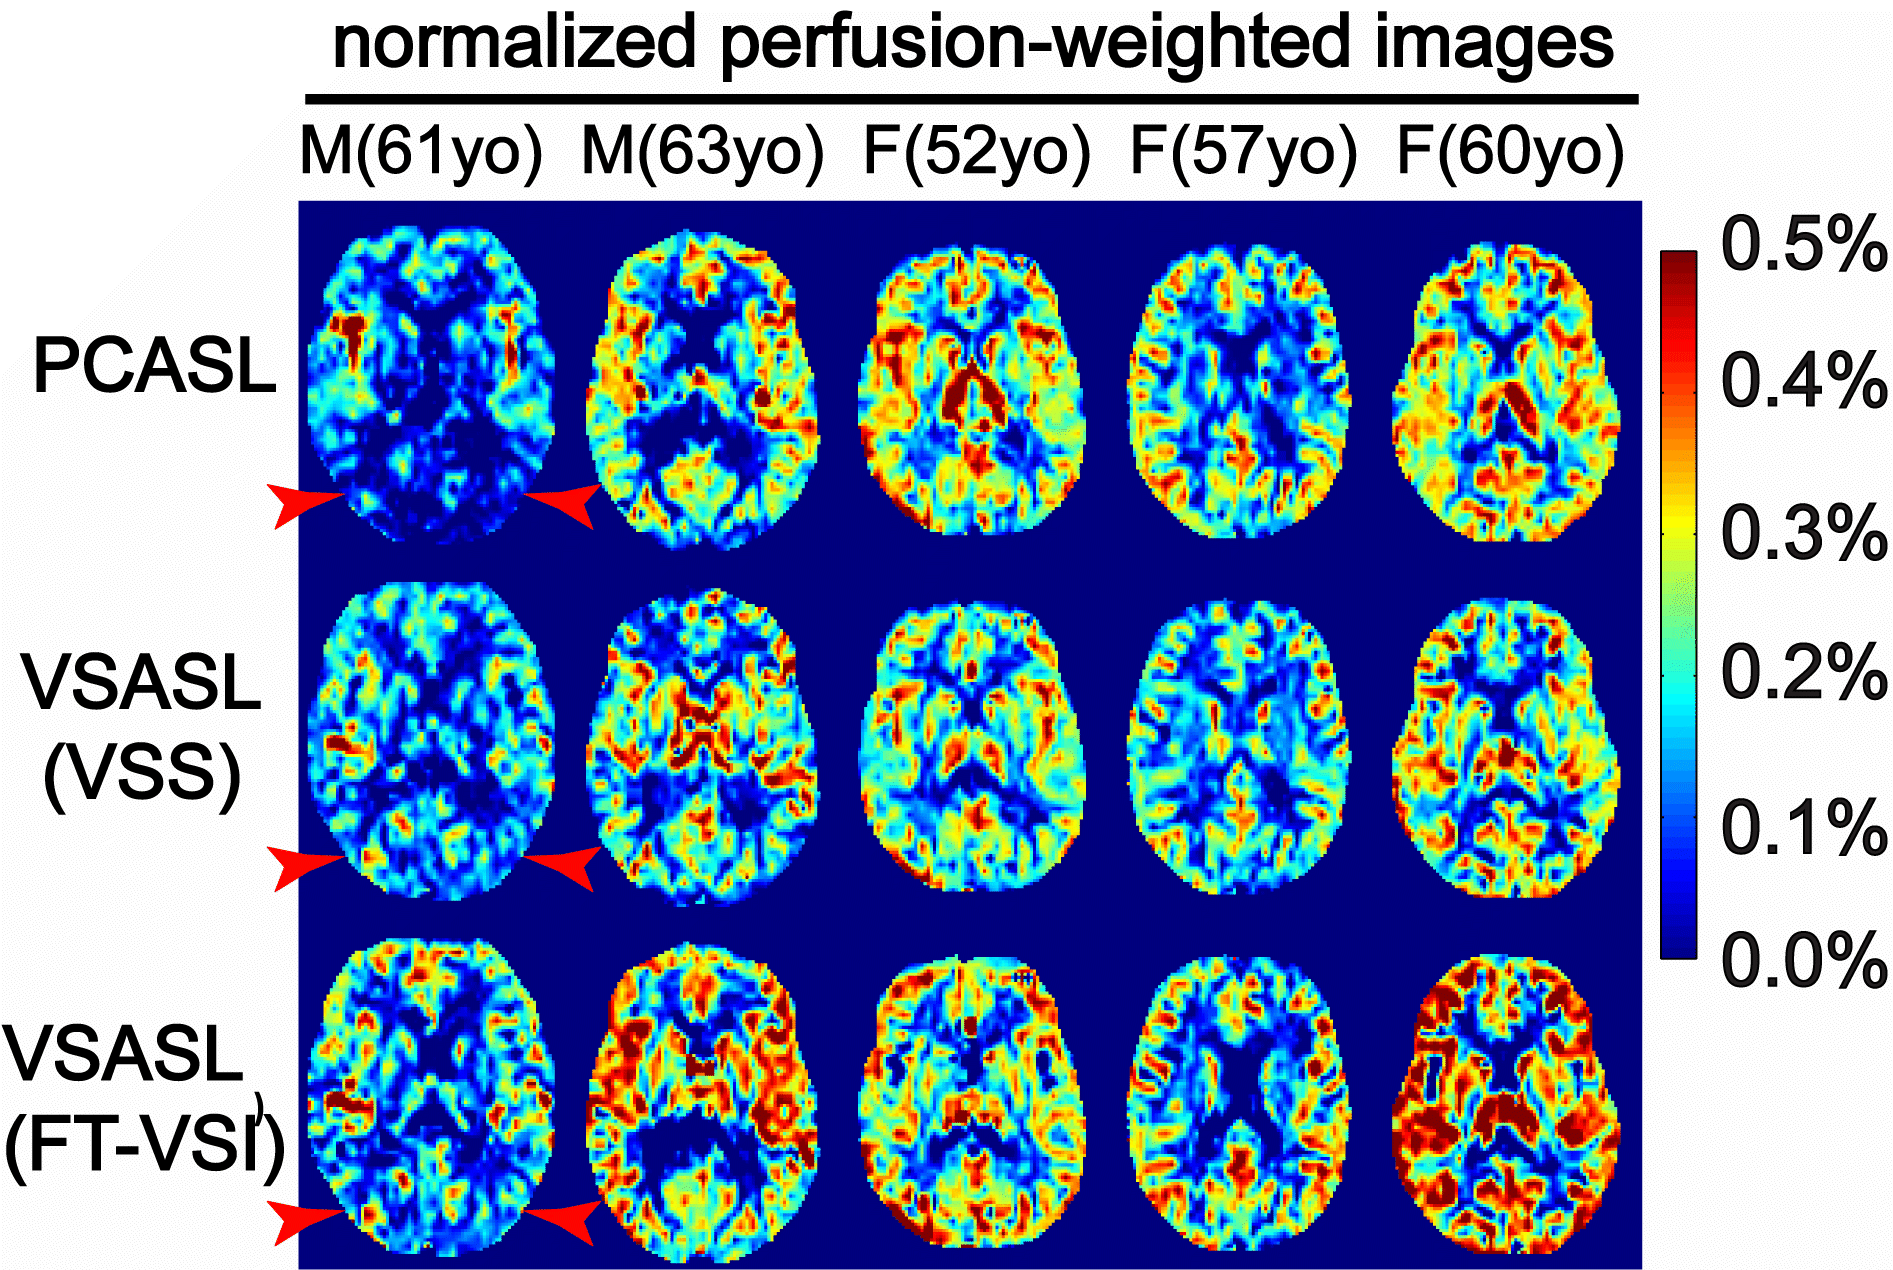
The normalized perfusion-weighted images, (control-label)/M0, from the middle slice of the five older subjects (group 2) are arrayed in Fig. 3. No apparent artifacts related to eddy currents were observed in any FT-VSI images. Note that the PCASL result of the first male subject shows lack of perfusion signal in the occipital lobe (Fig. 3, red arrowhead). This is an example of the sensitivity to transit delay, indicating that the transit time to the posterior brain of this normal subject is longer than the prescribed PLD of 2.0 sec. In contrast, VSASL results do not display such an artifact (Fig. 3).
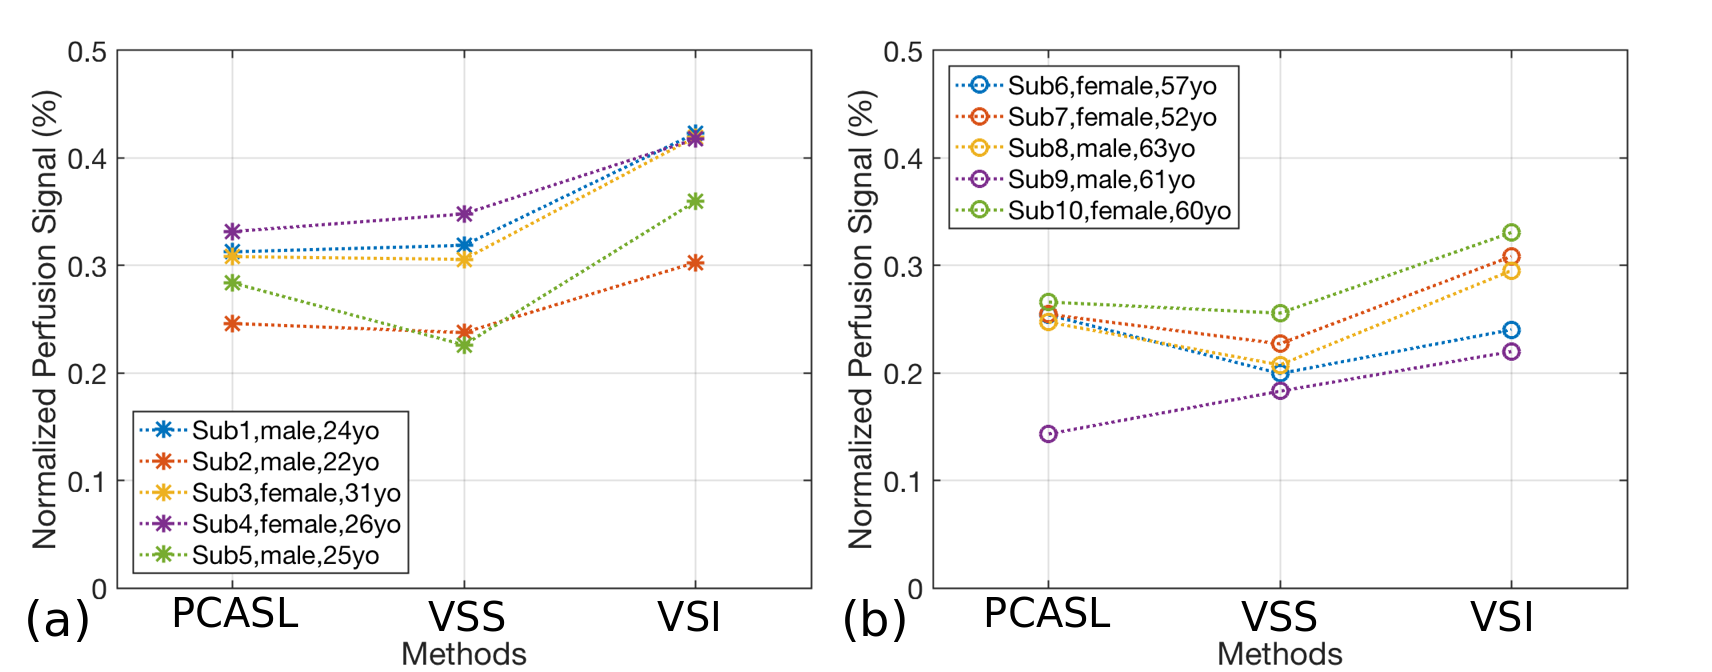
Fig. 4 shows the signal comparison in GM between PCASL, VSS and VSI, in both groups. Signal for VSI-ASL is consistently higher than PCASL and VSS-ASL for most of the subjects. The averaged perfusion signal in GM of FT-VSI based VSASL are 29.7% and 19.7% higher than PCASL and 33.9% and 30.0% higher than VSS-based VSASL, respectively, in the young and older groups. Even though between-subject variations of CBF are large due to either their hematocrit differences11 or other circulation properties, all ASL techniques showed correlated perfusion signals within each subject in GM (Pearson r = 0.89, p = 0.0006 between PCASL and VSI; Pearson r = 0.92, p = 0.0001 between VSS and VSI). Comparisons of perfusion signal from PCASL, VSS and VSI results with 3D whole-brain coverage are shown in Fig. 5.
Conclusion
FT-VSI with 3D-GRASE readout was optimized and successfully implemented. The feasibility of VSASL with a 3D whole-brain coverage was demonstrated. FT-VSI based VSASL shows higher perfusion signal than both PCASL and VSS based VSASL among healthy volunteers.Acknowledgements
No acknowledgement found.References
1. Wong EC, Cronin M, Wu W-C, Inglis B, Frank LR, Liu TT. Velocity-selective arterial spin labeling. Magn. Reson. Med. 2006;55:1334–1341
2. Duhamel G, de Bazelaire C, Alsop DC. Evaluation of systematic quantification errors in velocity-selective arterial spin labeling of the brain. Magn. Reson. Med. 2003;50:145–153
3. Wu W-C, Wong EC. Intravascular effect in velocity-selective arterial spin labeling: The choice of inflow time and cutoff velocity. Neuroimage 2006;32:122–128
4. Qiu D, Straka M, Zun Z, Bammer R, Moseley ME, Zaharchuk G. CBF measurements using multidelay pseudocontinuous and velocity-selective arterial spin labeling in patients with long arterial transit delays: Comparison with xenon CT CBF. J. Magn. Reson. Imaging 2012;36:110–119
5. Meakin JA, Jezzard P. An Optimized Velocity Selective Arterial Spin Labeling Module with Reduced Eddy Current Sensitivity for Improved Perfusion Quantification. Magn. Reson. Med. 2013;69:832–838
6. Guo J, Meakin JA, Jezzard P, Wong EC. An optimized design to reduce eddy current sensitivity in velocity-selective arterial spin labeling using symmetric BIR-8 pulses. Magn. Reson. Med. 2015;73:1085–1094
7. Qin Q, van Zijl PCM. Velocity-selective-inversion prepared arterial spin labeling. Magn. Reson. Med. 2016;76:1136–1148
8. Dai W, Garcia D, de Bazelaire C, Alsop DC. Continuous flow-driven inversion for arterial spin labeling using pulsed radio frequency and gradient fields. Magn Reson Med 2008;60:1488–1497.
9. Alsop DC, Detre JA, Golay X, et al. Recommended implementation of arterial spin-labeled perfusion MRI for clinical applications: A consensus of the ISMRM perfusion study group and the European consortium for ASL in dementia. Magn. Reson. Med. 2015;73:102–116
10. Zhao L, Vidorreta M, Soman S, Detre JA, Alsop DC. Improving the robustness of pseudo-continuous arterial spin labeling to off-resonance and pulsatile flow velocity. Magn. Reson. Med. 2016;78:1342–1351
11. Xu F, Li W, Liu P, et al. Accounting for the role of hematocrit in between-subject variations of MRI-derived baseline cerebral hemodynamic parameters and functional BOLD responses. Hum. Brain Mapp. 2018;39:344–353
Figures