4961
Assessing Morphology of Cerebral Macro- and Microvasculature Using Dynamic Perfusion Tensor Imaging ASL1C.J. Gorter Center for High Field MRI, Radiology, Leiden University Medical Center, Leiden, Netherlands, 2Center for Image Sciences, University Medical Center Utrecht, Utrecht, Netherlands
Synopsis
Time-encoded pseudo-continuous ASL was combined with bipolar crusher gradients to measure a time-resolved perfusion tensor of the brain vasculature. Gradients provided a high degree of attenuation of the intravascular signal which increased with greater gradient strength and decreased (down to 25%) at long post-labeling delays (PLDs). Perfusion tensor images showed correspondence with known structures such as the anterior cerebral artery and the circle of Willis. Fractional anisotropy of perfusion remained elevated and increased with longer PLDs. Adjustments in gradient strength and time-encoding scheme may permit the imaging of microvascular structure.
Introduction
Histological evidence has shown a link between several brain diseases and vascular structure: tortuosity of the macro- and microvasculature correlates with early signs of Alzheimer’s, stroke and tumours1,2. To better understand the mechanisms by which vessel structure is altered in disease, there is a need for a method to image these characteristics in vivo. A study combining arterial spin labeling (ASL) with bipolar gradients has shown promise for the estimation of the directional components of perfusion in rats3. Moreover, perfusion tensors can be extracted from multidirectional velocity-selective ASL4 . Both these papers focus on one or two timepoints in the transit of blood, whereas an assessment over the complete vascular tree would be beneficial. In this study, we aim to combine time-encoded pseudo-continuous ASL (te-pCASL)5 with six-directional crushers to measure a time-resolved perfusion tensor. To validate this approach, we compare the results of this perfusion tensor imaging with the known orientations of large vessels and expected time course of fractional anisotropy (FA) as blood travels from large arteries (highly anisotropic) to the microvasculature (lower FA).Methodology
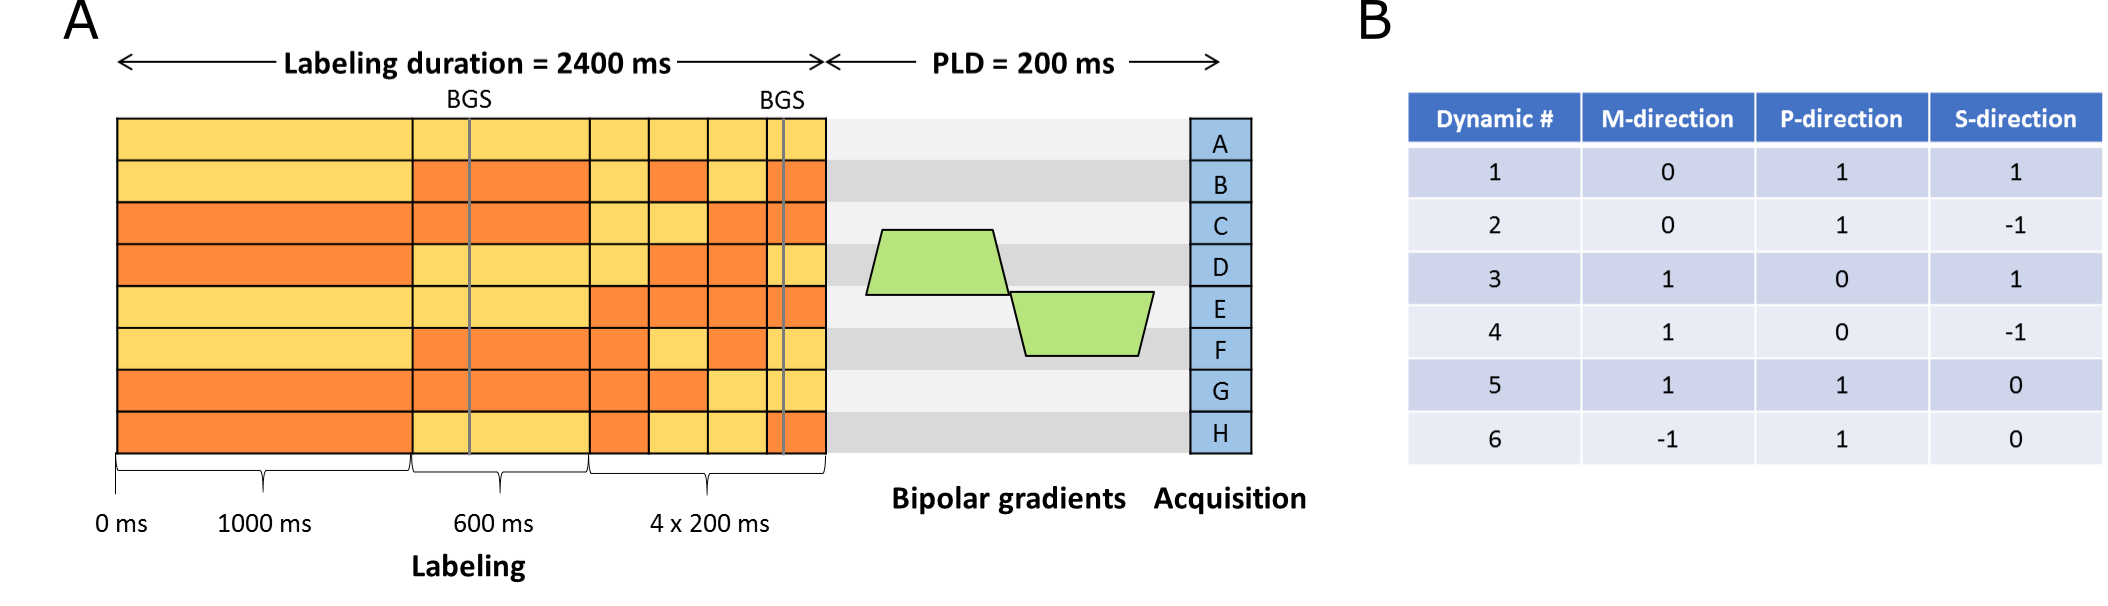
All data was acquired on a Philips Achieva system (Philips, Best, the Netherlands) with a 32-channel head coil. Written informed consent was obtained from all participants. A total of 9 healthy volunteers (4 male, ages 22-64) were examined with the te-pCASL scheme (figure 1a). Bipolar crusher gradients were applied during the post-labeling delay (PLD) in two directions simultaneously (see figure 1b). In addition, a scan without crushers was acquired separately. Two crusher Venc (5cm/s and 10cm/s) were employed in six of those subjects. One other subject was scanned with Venc 1cm/s and 5cm/s for comparison. Finally, two subjects were scanned with a single Venc of 10cm/s and twice the number of averages.
Image analysis was implemented in MATLAB (The Mathworks, MA). Perfusion images were calculated through Hadamard-decoding, followed by thresholding at early and late time points to create arterial and gray matter masks, respectively. Average signal and crusher attenuation (as a fraction of the non-crushed signal) were calculated. Perfusion tensor analysis was performed combining the multi-directional images with those without gradients (equivalent to the diffusion b0)6. This allowed the calculation of a perfusion tensor at every spatial and temporal point as well as fractional anisotropy (FA) and main direction of perfusion.
Results
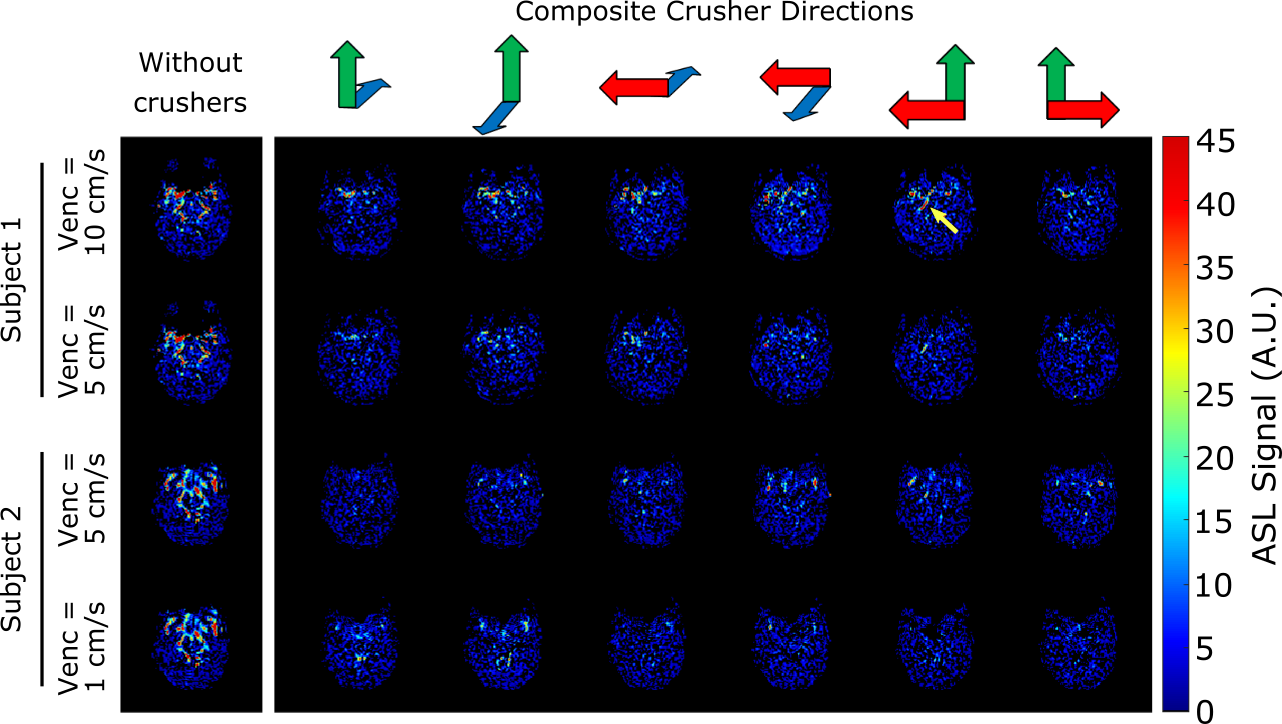
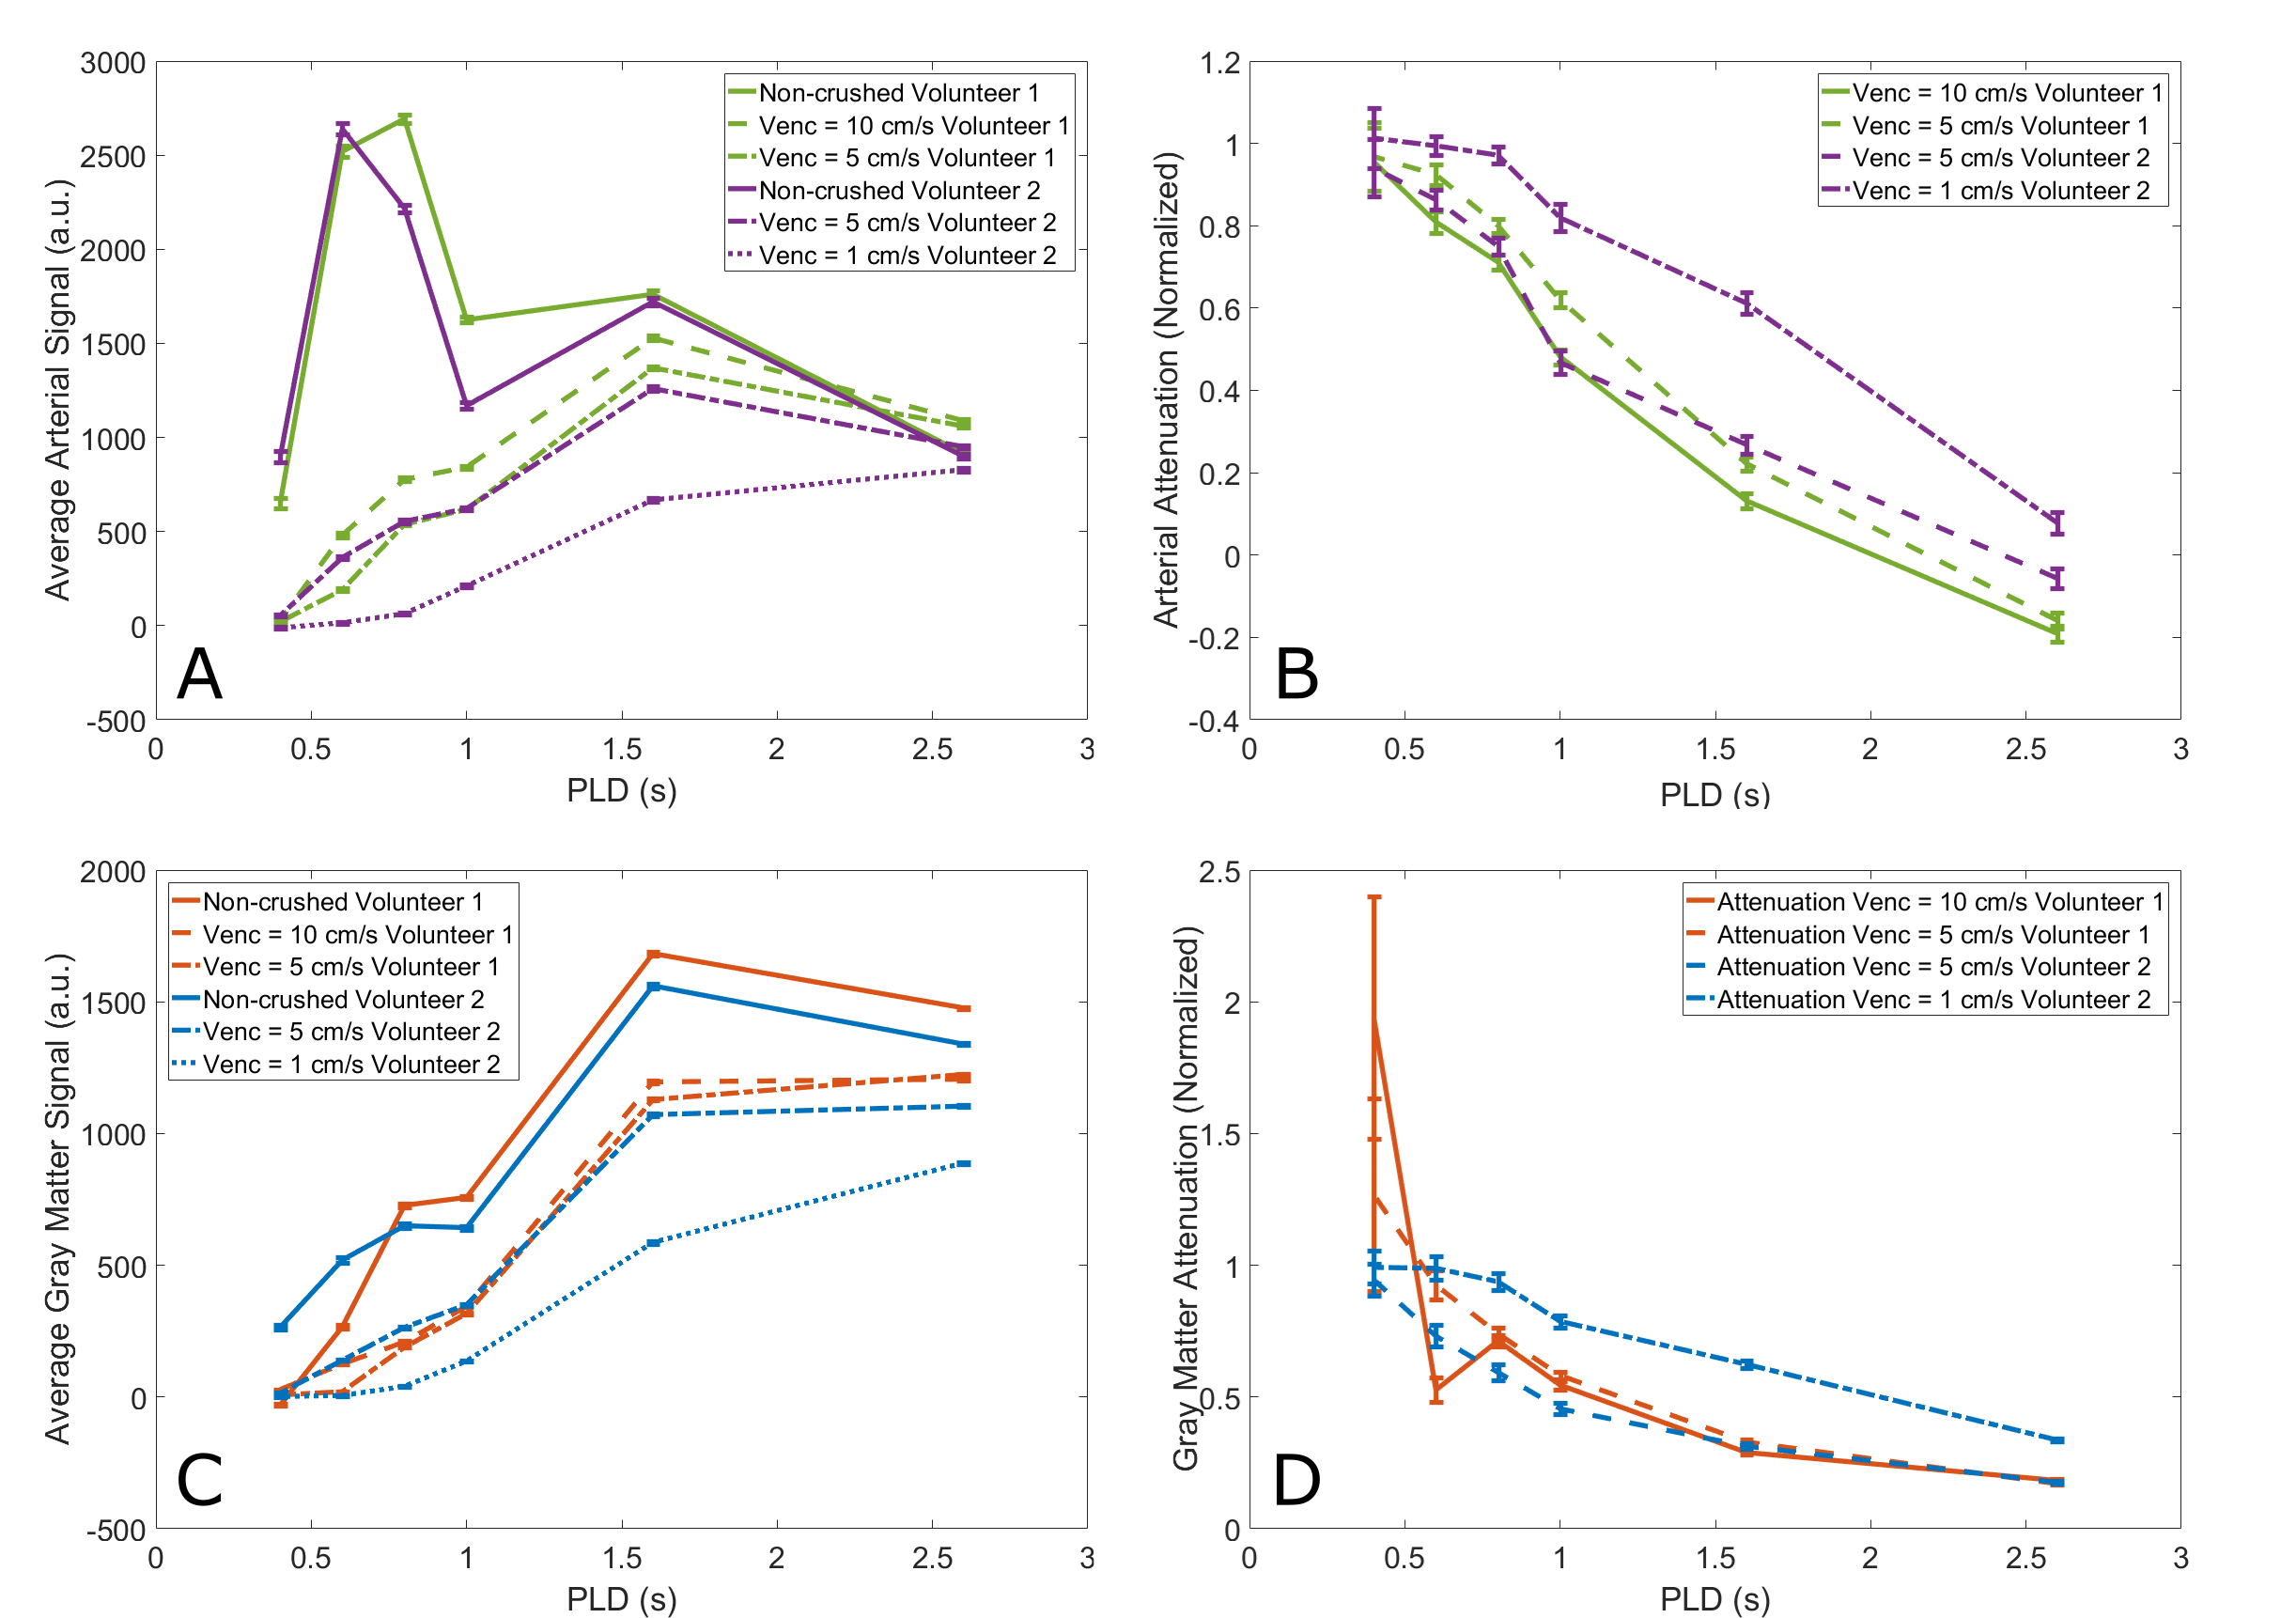
Figure 2 shows ASL perfusion images at a single time point for two subjects. With increasing gradient strength (i.e. decreasing Venc), the signal became more attenuated. Vessels perpendicular to the crushing direction (yellow arrow) were mostly unaffected. In figure 3, the effect of crusher gradients on the arterial and gray matter signal can be appreciated. In both cases, the maximum attenuation occurs in early time points where the signal is contained in larger arteries.
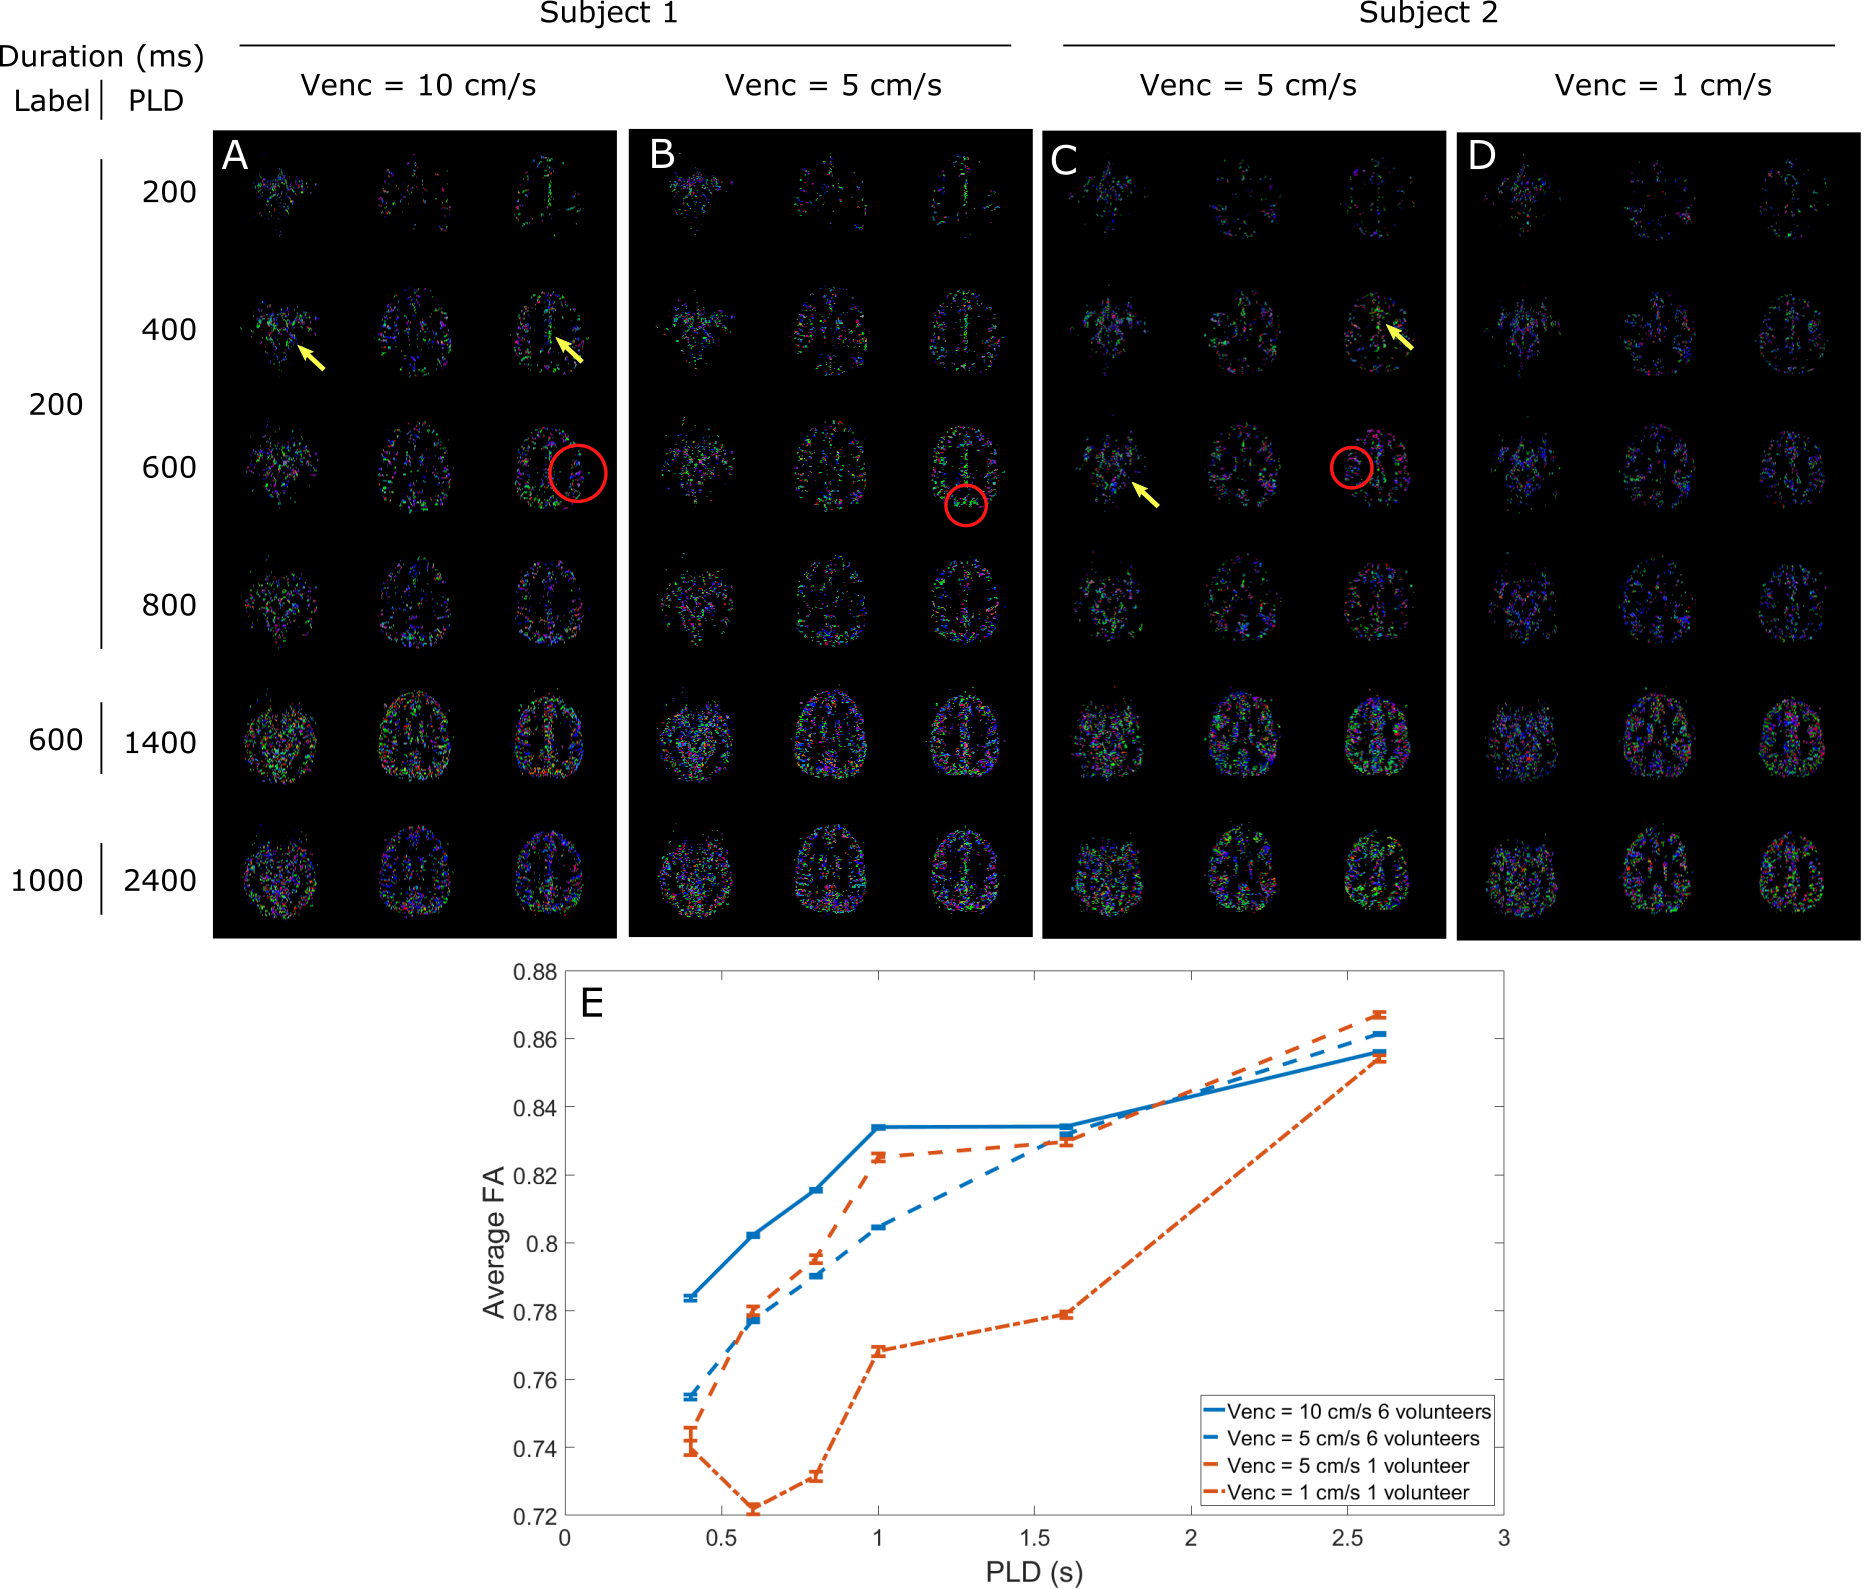
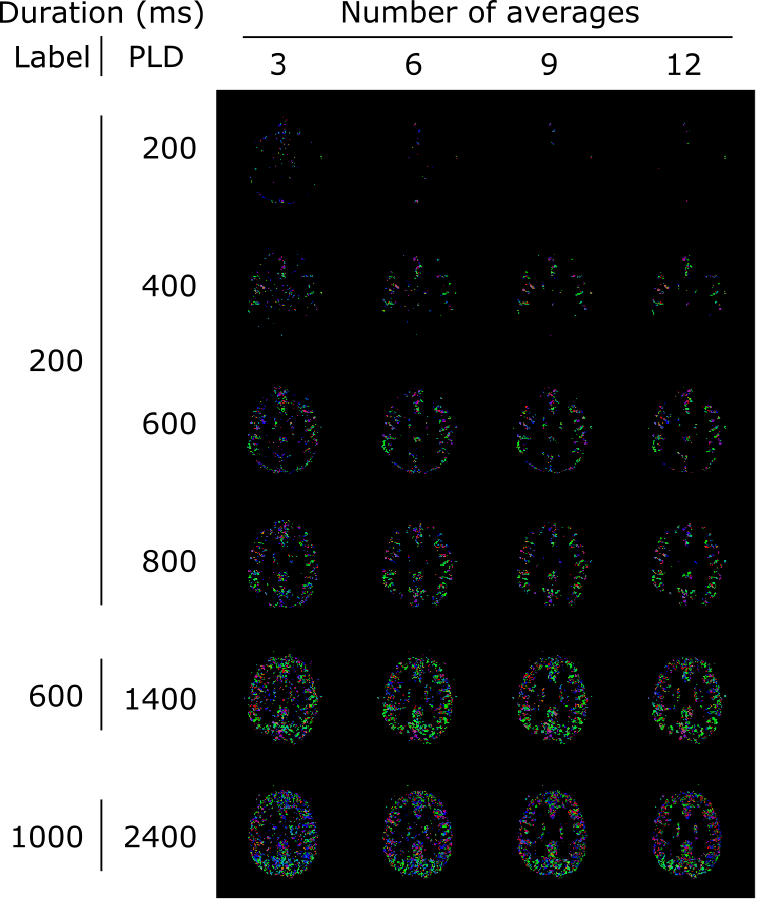
Figure 4a-d exhibits the results of the tensor analysis for the same subjects. Structures such as the anterior cerebral artery and the circle of Willis are visible (arrows) and the main direction of perfusion corresponds to the architecture of the vasculature in several areas (circles). In figure 4e, the average FA for all subjects is shown to increase as a function of PLD, as well as to decrease for stronger crushers. Figure 5 demonstrates the effect of increasing the number of averages (and hence the SNR) on the perfusion tensor maps. Higher SNR resulted in better-defined features, but overall comparable directionality.
Discussion and Conclusion
From figures 2&3 it can be concluded that a very large amount of arterial signal is cancelled, even at modest gradient strengths. The strongest gradient resulted in the removal of almost all intravascular signal, regardless of the direction of application.
Perfusion tensor analysis results are compatible with the architecture of some visible large vessels. Comparison of gradient strengths (figure 4 a/b and c/d) reveals different tensor maps, indicating that distinct areas of the vasculature may be targeted when gradient strength is varied. Contrary to our hypothesis, the FA was seen to increase with PLD. This may be due to the high velocity of blood in early time points, resulting in complete crushing for gradients applied along the flow-direction with also significant crushing in the other directions (note that the averaged attenuation of arterial signal over all 6 directions gets only smaller than 80% at PLD>700ms). The differences between gradient directions may therefore appear more isotropic. For the gray matter, Venc=5cm/s still resulted in a mean attenuation of 25% for the longest PLD (1600ms), suggesting sufficient SNR; a Venc of 1cm/s resulted in 45% attenuation for this PLD. This result may indicate a need for focusing the te-pCASL on PLDs of 1000ms and longer and/or to acquire multiple scans with different timings and gradient strengths.
Acknowledgements
This work is part of the research programme Innovational Research Incentives Scheme Vici with project number 016.160.351, which is financed by the Netherlands Organisation for Scientific Research (NWO).References
1. De La Torre, J. C., & Stefano, G. B. (2000). Evidence that Alzheimer’s disease is a microvascular disorder: The role of constitutive nitric oxide. Brain Research Reviews, 34(3), 119–136.
2. Bullitt, E., Zeng, D., Gerig, G., Aylward, S., Joshi, S., Smith, J. K., … Ewend, M. G. (2005). Vessel tortuosity and brain tumor malignancy: A blinded study. Academic Radiology, 12(10), 1232–1240.
3. Wells, J. A., Thomas, D. L., Saga, T., Kershaw, J., & Aoki, I. (2016). MRI of cerebral micro-vascular flow patterns: A multi-direction diffusion-weighted ASL approach. Journal of Cerebral Blood Flow and Metabolism : Official Journal of the International Society of Cerebral Blood Flow and Metabolism, Jun;37(6):2076-2083.
4. Frank, L. R., Lu, K., & Wong, E. C. (2008). Perfusion tensor imaging. Magnetic Resonance in Medicine, 60(6), 1284–1291.
5. Teeuwisse, W. M., Schmid, S., Ghariq, E., Veer, I. M., & Van Osch, M. J. P. (2014). Time-encoded pseudocontinuous arterial spin labeling: Basic properties and timing strategies for human applications. Magnetic Resonance in Medicine, 72(6), 1712–1722.
6. Kroon, D.-J., (2008). DTI and Fiber Tracking. [online] Available at: https://www.mathworks.com/matlabcentral/fileexchange/21130-dti-and-fiber-tracking [Accessed 07/11/2018]
Figures