4960
Convolutional Neural Network based Automatic Planning for Pseudo-Continuous Arterial Spin LabelingMichael Helle1, Thomas Lindner2, and Karsten Sommer1
1Philips Research, Hamburg, Germany, 2Department of Radiology and Neuroradiology, University Hospital Schleswig-Holstein Campus Kiel, Kiel, Germany
Synopsis
Pseudo-continuous arterial spin labeling (pCASL) requires careful planning of the labeling plane to achieve high labeling efficiency, which makes the quality of the imaging results dependent on the experience of the operator. Here we demonstrate the feasibility of using a convolutional neural network to automatically predict an appropriate labeling position based on angiography images, thereby allowing for fully automatic pCASL perfusion scans.
Introduction
Pseudo-continuous arterial spin labeling (pCASL) is recommended for non-contrast enhanced perfusion measurements in many clinical applications1. Careful planning of the labeling plane is required – ideally in regions where relevant feeding vessels are straight and cross the labeling plane perpendicularly to achieve high labeling efficiency. However, operator-induced variability may alter the imaging results. Here, we demonstrate the feasibility of using a convolutional neural network (CNN) to automatically predict an appropriate labeling position based on given angiography images of the neck.Methods
The training dataset of 112 clinical angiography scans (time-of-flight: FOV 200x200x96mm3, voxel size 1.5x1.5x1.5mm3, 3D fast-field echo acquisition, FA 18°, TR/TE 23/2.3ms) plus a separate test dataset of 5 additional scans were acquired on a 3T Achieva Scanner (Philips, Best, The Netherlands) under the general protocol for sequence development, approved by the local ethics committee. Only the coronal maximum intensity projections (MIPs) were selected for planning. Each angiogram was repeatedly stretched by a random factor between 0% and 20% to create 10x more images. Appropriate locations for the labeling plane were selected by an experienced operator. Importantly, several possible labeling plane positions for a single image were allowed. Additional data augmentation was realized by random horizontal shifts applied to all images. Finally, Gaussian noise was added to all images, resulting in a training dataset of 11.200 images. A CNN was then trained to predict suitable labeling positions based on the angiographic coronal MIPs. Two convolutional layers with a kernel size of k=3, 32 channels, and a Rectified Linear Unit (ReLU) were employed, each followed by a max-pooling layer. This was followed by a fully connected layer with 500 neurons and a ReLU activation function. The dropout technique (probability p=0.5) was used for the fully connected layer. To account for the fact that multiple suitable labeling positions could be selected by the operator, a tailored loss function was employed that yielded the mean-squared error between the network output and the reference labeling position closest to the network’s output. Training was then realized using the Adam optimizer with a learning rate schedule of (1·10-5,3·10-6,1·10-6), each applied for 20.000 minibatches. Once the network was trained, an in vivo validation of the method was carried out in a healthy volunteer by positioning the labeling plane for a pCASL scan by the network and by an experienced operator (without knowledge of the network’s output). Moreover, intra-observer error of the operator was assessed by performing a single positioning of the labeling plane in the images of the initial training dataset.Results
Figure 1 shows a plot of the loss functions for the training and test dataset throughout the training, as well as the mean and maximum deviation on the test dataset between the network’s output and the reference labeling position closest to the network’s output. A substantial decrease in all curves can be seen after ~15.000 minibatches. At the end of training, mean/maximum deviations between network output and ground truth of 4.23/13.67px were obtained. No overfitting was observed. Intra-observer errors demonstrated similar results of 2.2/15.5px. Figure 2 shows the network’s performance on example images from the test dataset. For the first four images, the network’s output is reasonably close to one of the reference labeling positions, indicating that the network successfully generalized from the training data. The bottom image presents one of the largest observed deviations (9.43px), where the network suggested a more proximal location. The results of the in vivo validation are shown in Figure 3. The network’s suggested labeling plane was almost identical to the one chosen by the operator. The high quality of resulting ASL images underline the suitability of this selected labeling plane.Discussion
While the neural network suggested labeling positions that were close to the ground truth in most cases, relatively large deviations were observed in some cases, such as the bottom image in Fig. 2. Careful inspection of this MIP, however, shows the inherent difficulty of the task, which is often a trade-off: while the labeling plane suggested by the network would lead to non-optimal labeling of the smaller vertebral arteries, it is almost ideal (i.e. perpendicular) for labeling of the carotid arteries. As seen in this example, large deviations from the ground truth may in some cases simply be caused by operator-specific preferences. Consequently, the presented method should be further evaluated on larger datasets with annotations from multiple operators. Moreover, clinical data collection would also include cases with vascular alterations and pathologies that might influence the positioning of the labeling plane.Conclusion
In this study, we demonstrate the feasibility of a CNN based fully automatic planning approach of pCASL scans, which is the most frequently used ASL technique in clinical settings.Acknowledgements
No acknowledgement found.References
1. Alsop DC et al. Recommended implementation of arterial spin-labeled perfusion MRI for clinical applications: A consensus of the ISMRM perfusion study group and the European consortium for ASL in dementia. Magn Reson Med. 2015;73:102-16.Figures
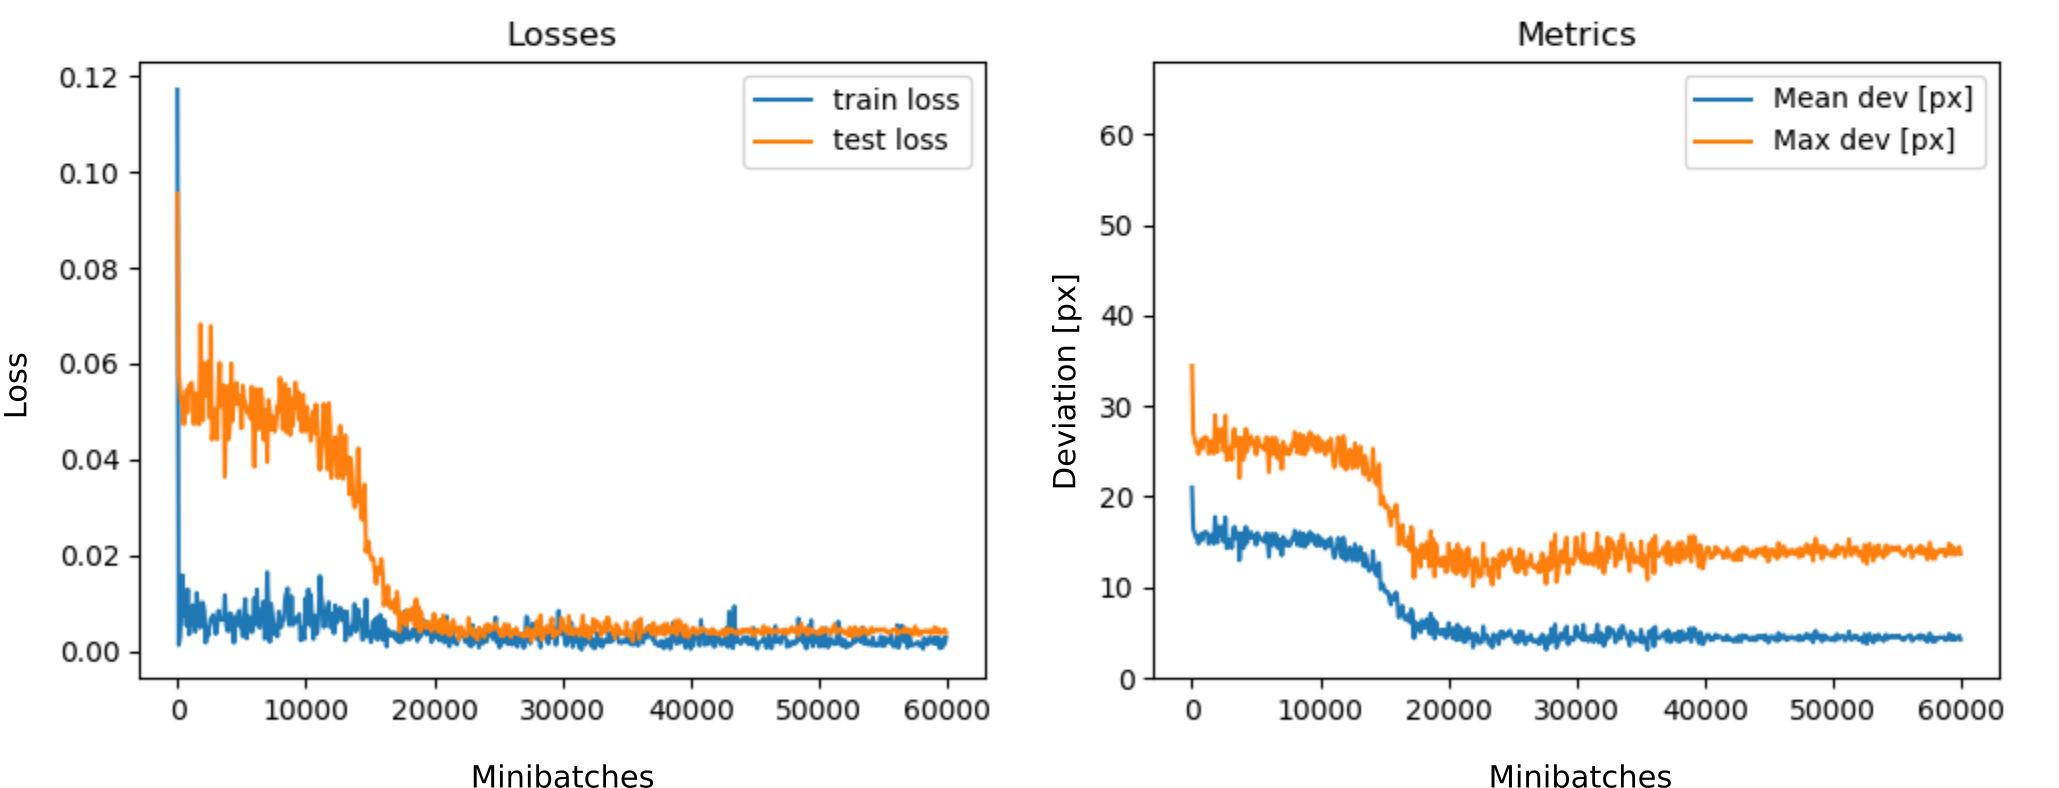
Fig. 1: The loss curves for training and test datasets (left)
as well as the mean and maximum deviation on the test dataset between the
network’s output and the reference labeling position closest to the network’s
output (right).
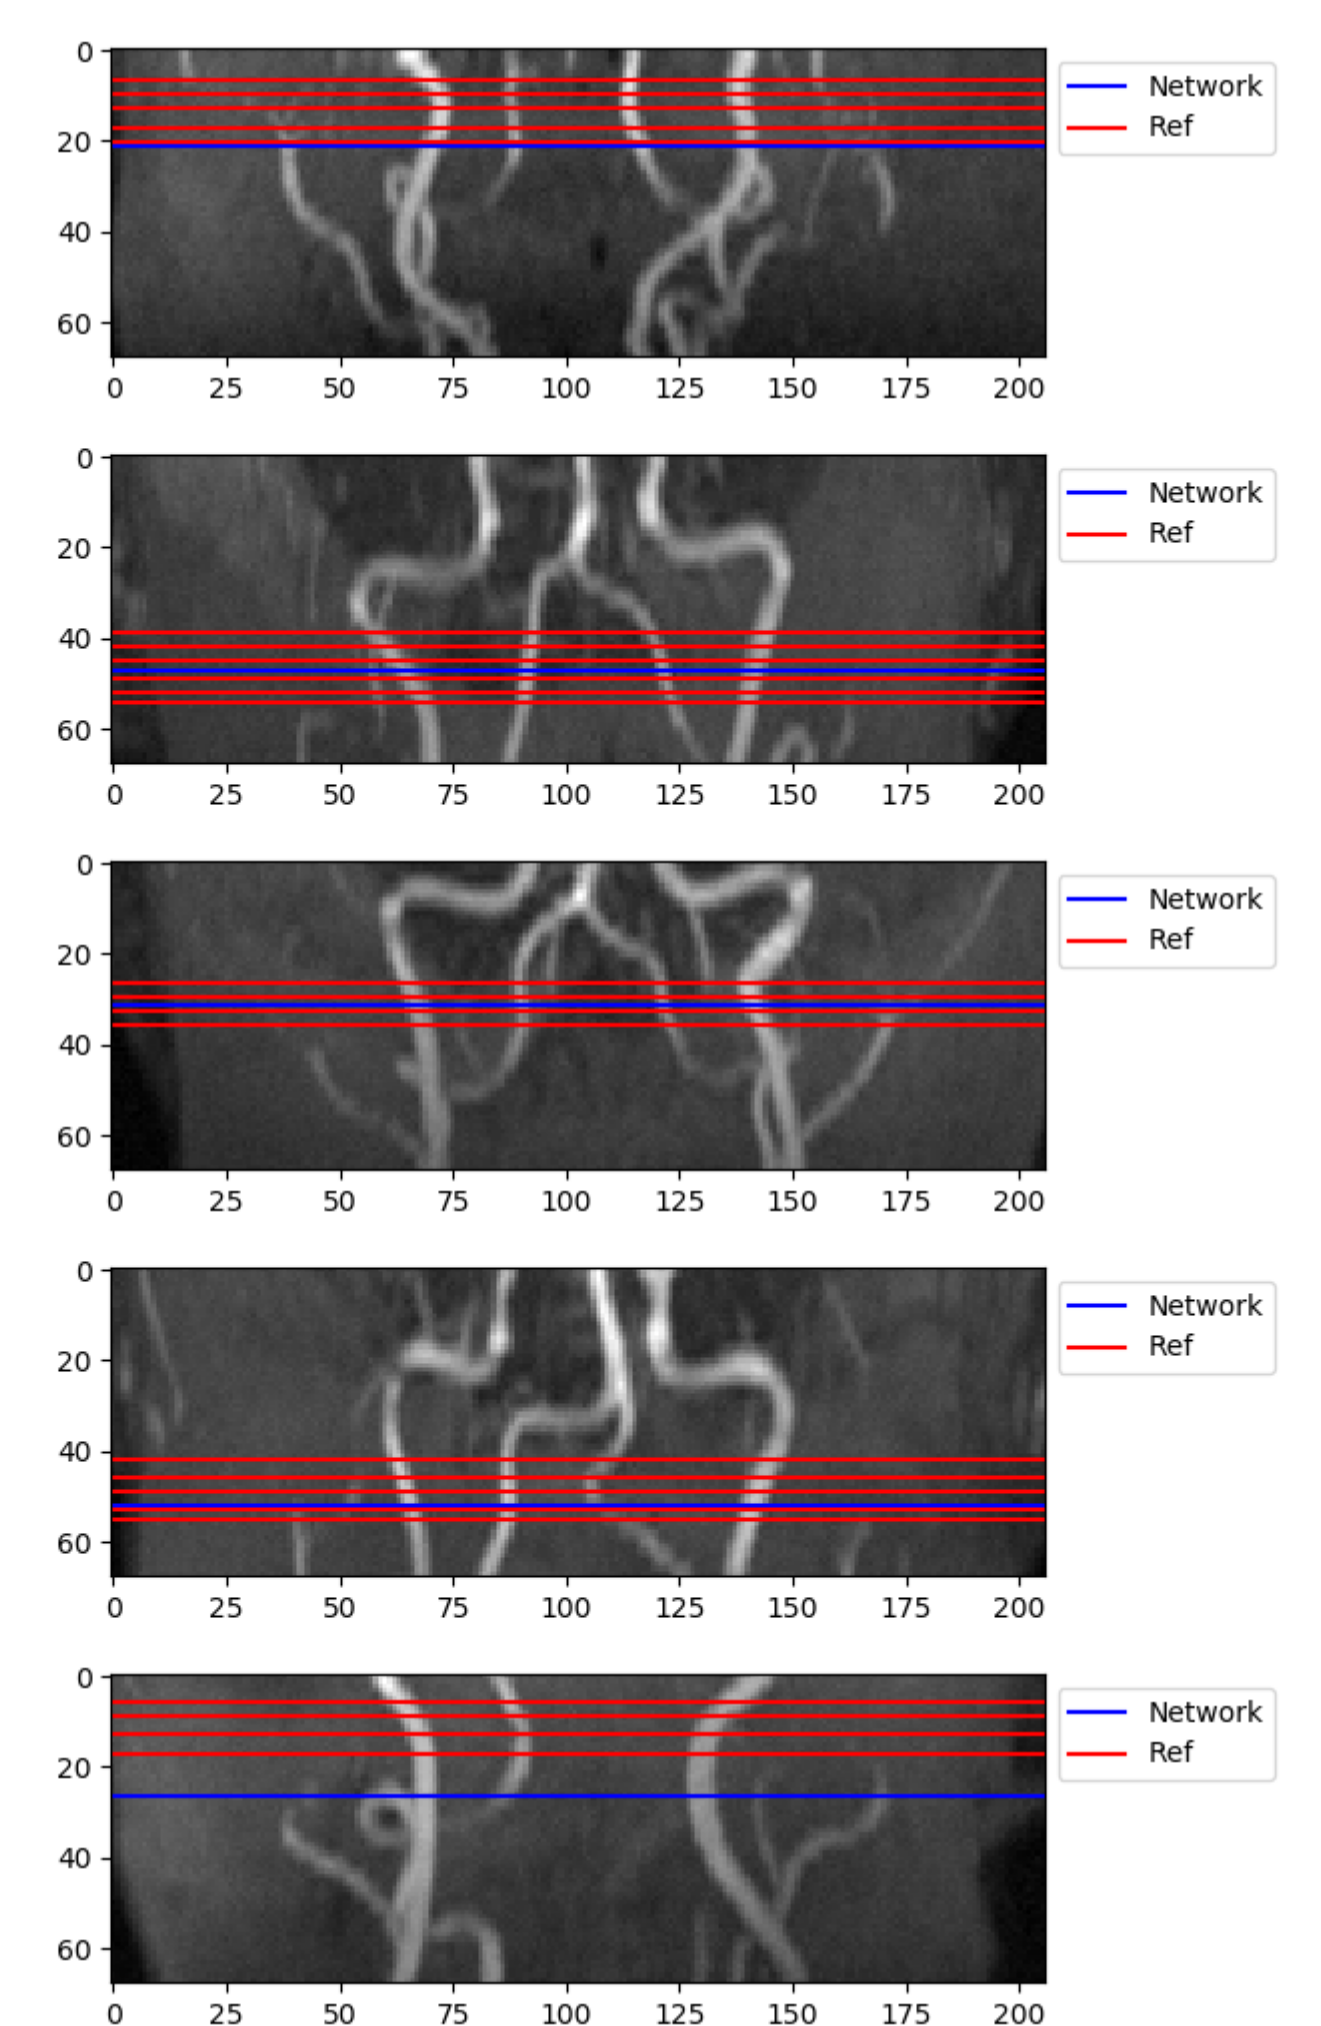
Fig. 2: Visualization
of the network performance on the test dataset. The labeling positions provided
by the network and the ground truth annotations (Ref) are displayed as blue and red
horizontal lines, respectively. Largest deviation appears in the bottom image
(9.43px).
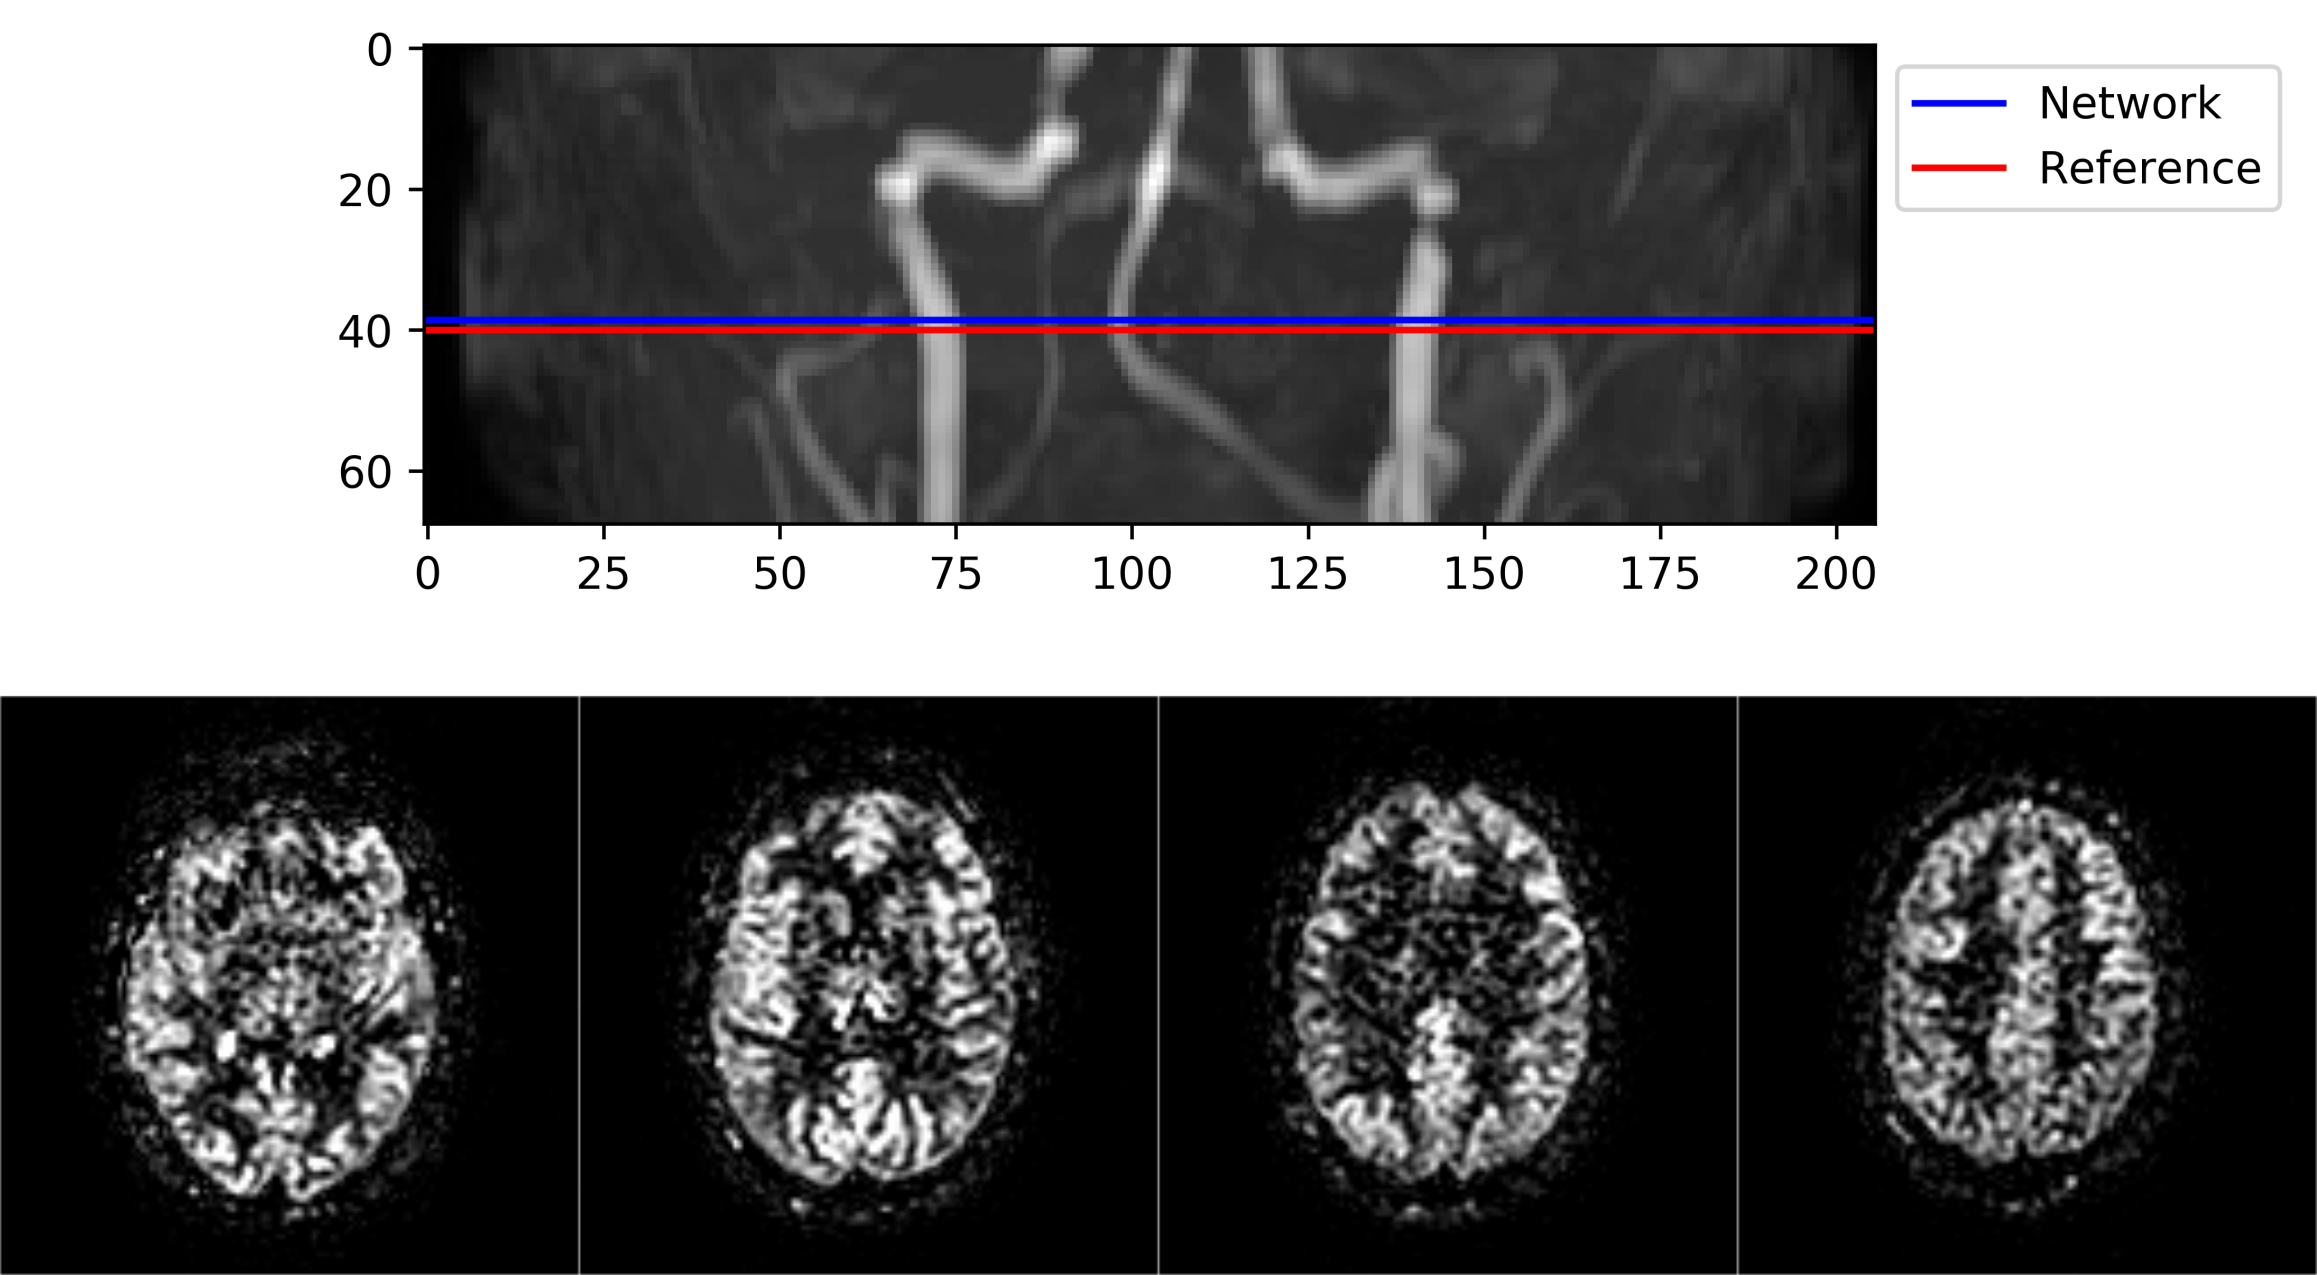
Fig. 3: In vivo validation of the network’s performance. Top
row: given the planning angiogram, the network suggests a labeling plane
virtually identical to the operator. Bottom row: example slices of the ASL data
acquired using the labeling plane suggested by the network and according to the
pCASL parameter recommendations given in reference 1.