4959
Pseudo-continuous arterial spin labeled renal perfusion imaging at 3T with improved robustness to off-resonance1Pediatrics, UT Southwestern Medical Center, Dallas, TX, United States, 2Radiology, UT Southwestern Medical Center, Dallas, TX, United States, 3Advanced Imaging Research Center, UT Southwestern Medical Center, Dallas, TX, United States
Synopsis
Pseudo-continuous arterial spin labeling (pCASL) has been applied for renal perfusion imaging, where inflowing blood is labeled in the descending aorta, just above the kidneys. However, in some cases when the labeling plane is positioned close to the lungs, significant decreases in SNR have been observed. We hypothesized that this was due to decreased labeling efficiency caused by the off-resonance effects near the lungs. In this study, an unbalanced pCASL gradient scheme that was optimized to be more robust to B0 inhomogeneities was compared with default implementations of pCASL at different labeling locations along the descending aorta.
Introduction
Pseudo-continuous arterial spin labeling (pCASL) has been applied for renal perfusion imaging, where the inflowing blood is labeled in the descending aorta, just above the kidneys [1-3]. While this achieved robust renal perfusion images at 1.5T, we have observed significant decrease in signal to noise ratio (SNR) in some cases at 3T. This is pronounced when normal variations in subject anatomy required labeling to be applied near the lungs to avoid creating the labeling artifacts through the kidneys. We hypothesized that this low SNR was due to the decreased labeling efficiency caused by the off-resonance effects near the lungs [5], which are more pronounced at 3T. Recent studies have shown improved robustness to B0 inhomogeneities by the unbalanced scheme of the pCASL labeling compared to the balanced scheme for brain perfusion imaging [6, 7]. Therefore, the purpose of this study was to implement an optimized unbalanced pCASL gradient scheme, and to compare perfusion-weighted images acquired with balanced and unbalanced labeling in the presence of increased B0 inhomogeneities near the lungs.Methods
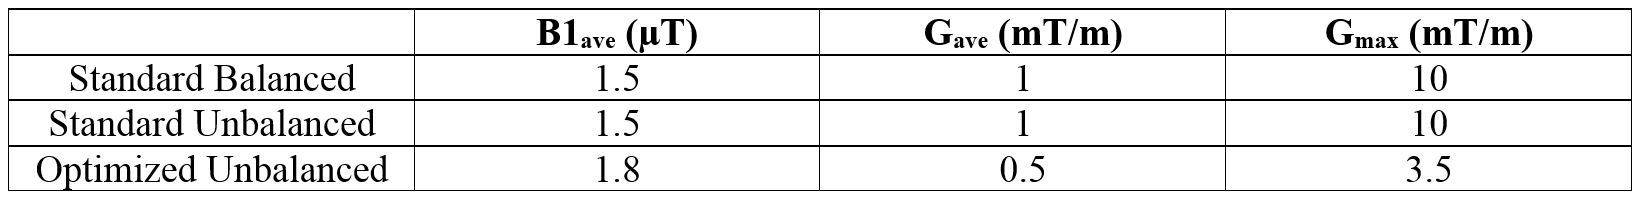
Two healthy subjects were scanned on a 3T Philips Ingenia scanner with IRB approval and informed consent. pCASL labeling was applied axially over the descending aorta for 1500 ms with a 1500 ms post-labeling delay. pCASL was implemented with two gradient schemes: 1) balanced (default), where both the control and label sequences have a net average gradient (Gave) over the labeling duration, and 2) unbalanced, such that the control sequence has Gave = 0 [6]. pCASL gradient schemes for this study were selected according to previous simulations that have been validated in the brain (Figure 1, Table) [7]. Perfusion images were acquired for each gradient scheme in two labeling locations: 1) As low as possible without overlapping the kidneys, and 2.5-3 cm superior to the first labeling plane, near the lungs. Background suppression was applied using four non-selective inversion pulses with optimized times for unconstrained labeling [8]. FOCI inversion pulses were used for improved suppression in regions of B0 and B1 inhomogeneities [9, 10]. Images were acquired with a 2D SShTSE with 2.5 mm in-plane resolution and 10 mm slice thickness. 8-16 signal averages were acquired in 2-4 minutes using a guided-breathing approach to minimize motion artifacts [2]. A separate M0 image was acquired in each subject for perfusion quantification. Finally, a B0 map was acquired using mDixon-Quant and the frequency offset at each labeling location was recorded.Results
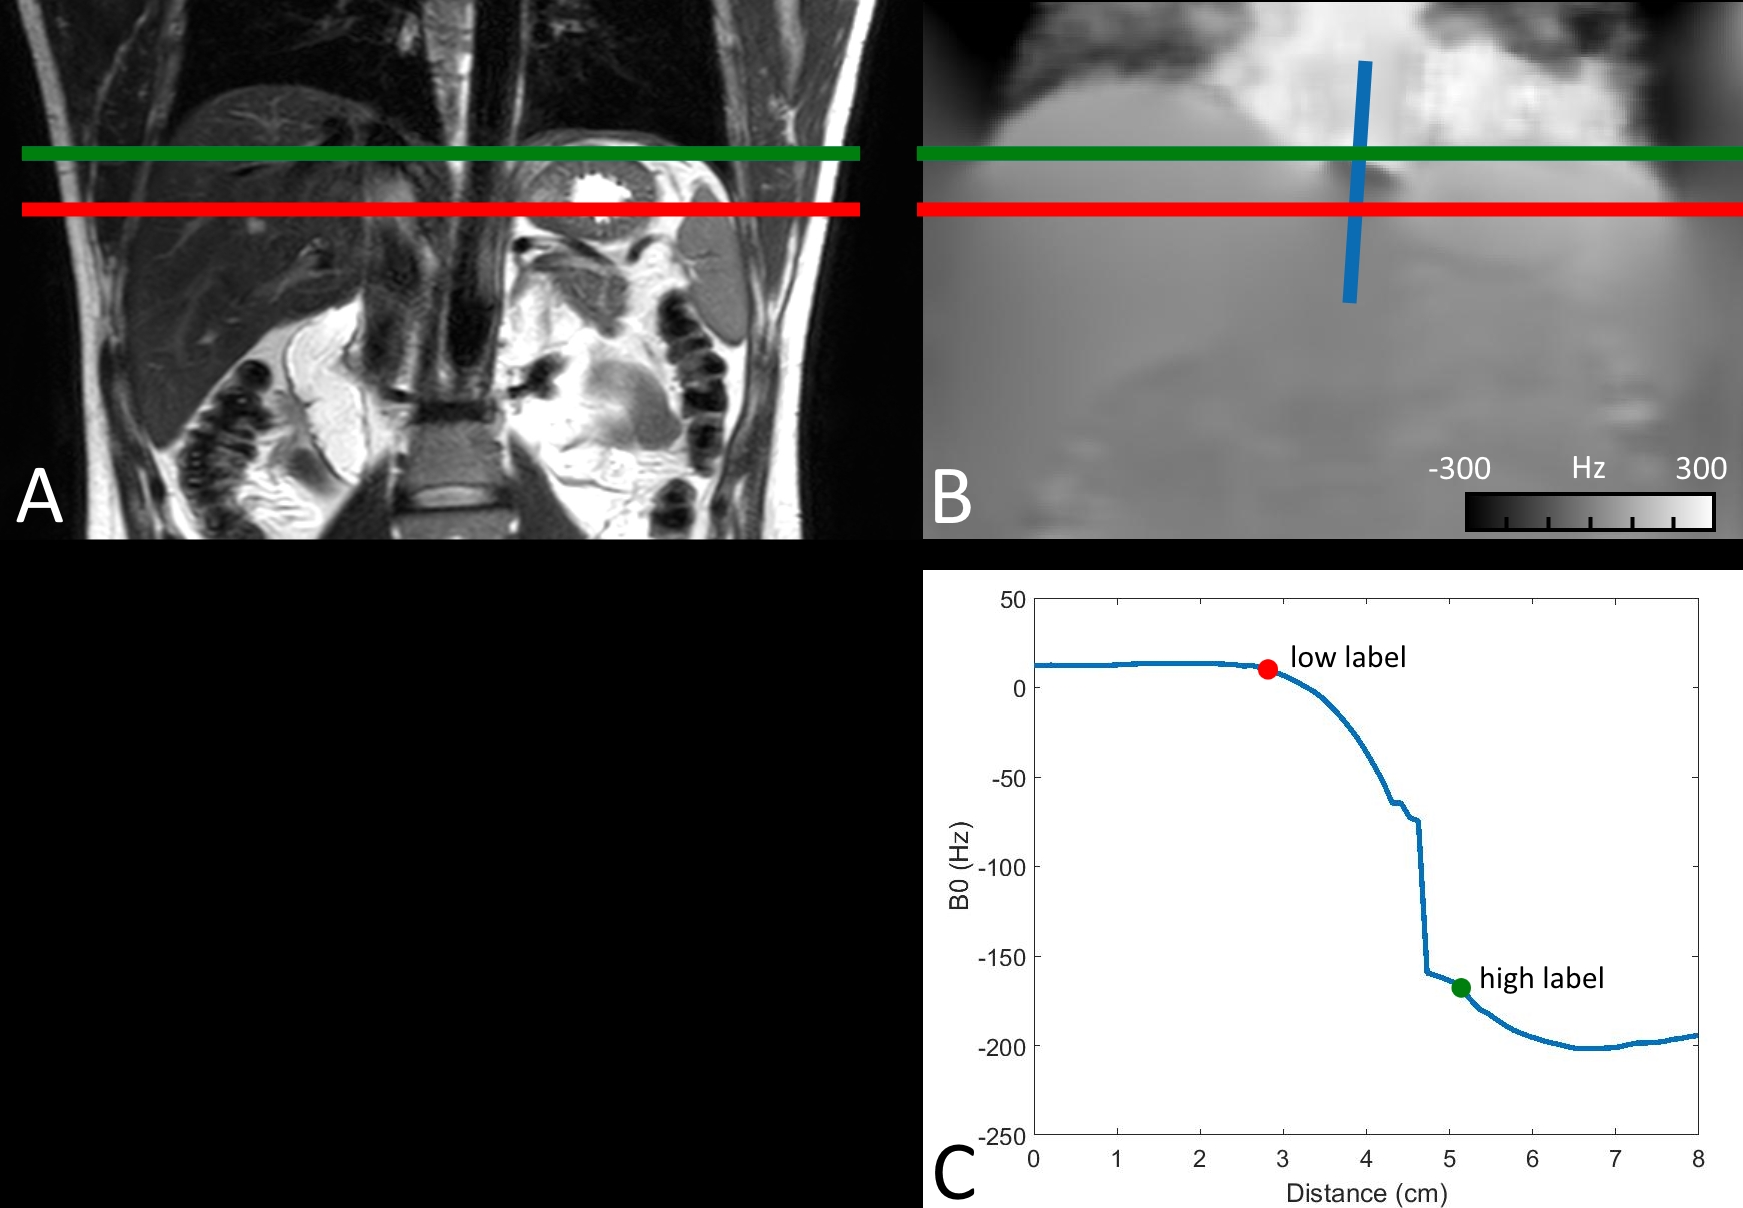
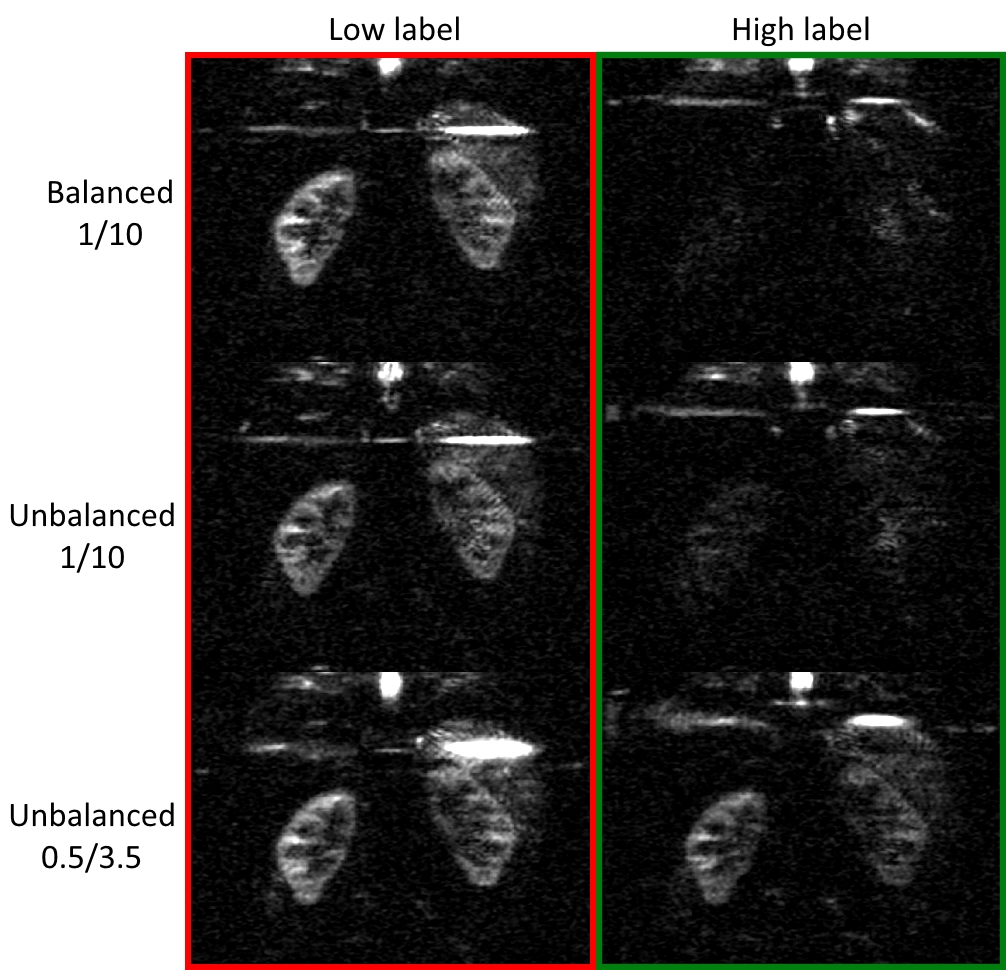
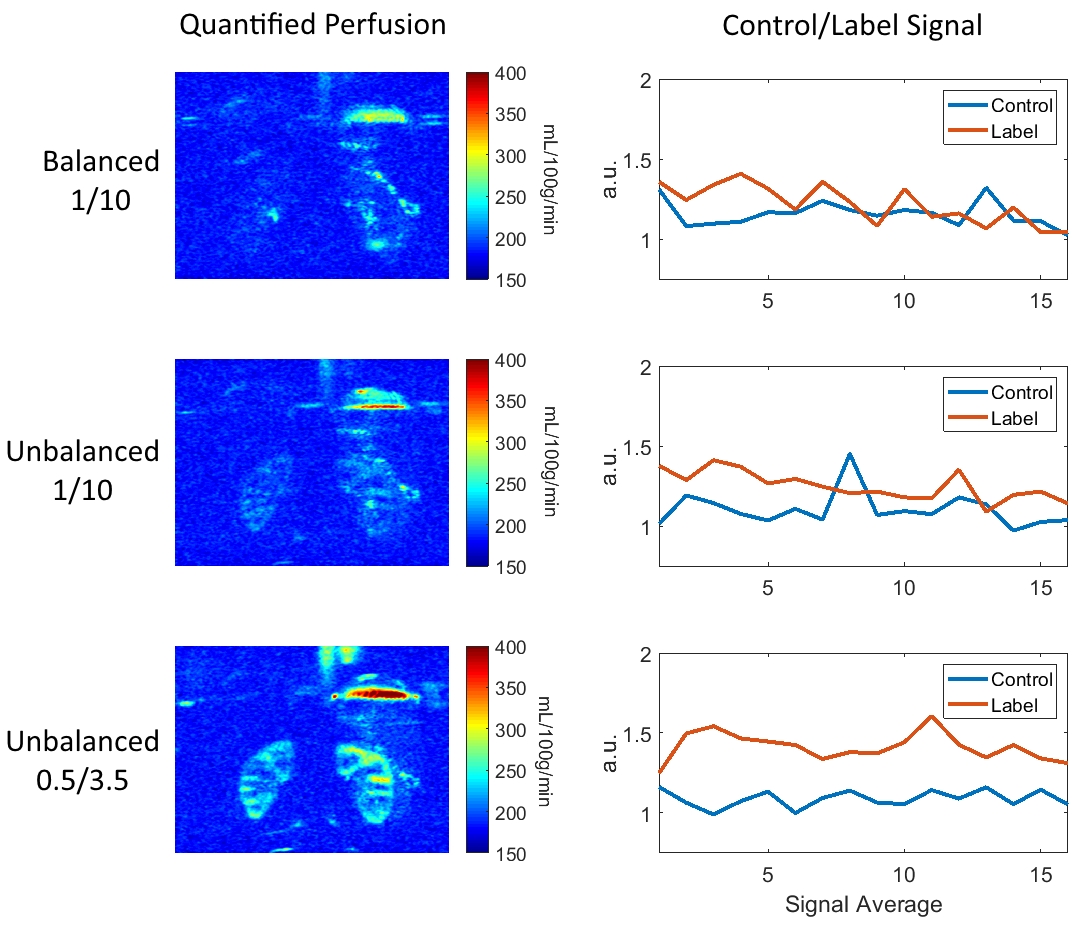
Figure 2 (A) shows the two labeling plane locations in the first volunteer, positioned axially across the descending aorta. The corresponding B0 map (B) shows the shift away from the center frequency that occurs near the lungs. The blue profile along the aorta is plotted in (C), showing the frequency offsets at each labeling plane location. Figure 3 shows perfusion-weighted images in the volunteer from Figure 2. The lower labeling plane (red) achieved high labeling efficiency for all gradient schemes, while labeling at the higher location (green) failed with standard gradients schemes. The optimized unbalanced labeling scheme was more robust to off-resonance at the higher location (-175 Hz), and provided comparable perfusion images to the on-resonance labeling planes. Figure 4 shows quantified perfusion images in a second volunteer at a higher labeling location (frequency offset = -104 Hz), with optimized unbalanced labeling providing the highest SNR. Mean perfusion of the renal cortex in the optimized unbalanced scheme was 223 mL/100g/min, matching the values that were previously reported [2].The corresponding graphs show average magnitude signal of the renal cortex in the control and the label source images, showing improved signal stability with the optimized unbalanced scheme.Discussion
The optimized unbalanced pCASL gradient scheme was more robust to off-resonance in agreement with previous simulations. The gradient scheme used in this study was optimized for brain perfusion imaging, and assumed blood velocities found in the carotid arteries [7], below the velocities in the descending aorta. Future simulations tailored for the abdominal aorta may further improve labeling efficiency to make renal perfusion imaging more consistent across subjects, regardless of the proximity of the labeling plane to the lungs. Previous simulations have also shown that balanced labeling can be made more robust to off-resonance [11]. Future comparison of the two optimized approaches may provide the most robust labeling strategy for abdominal labeling. Finally, applying optimized unbalanced labeling in combination with a 3D CASPR TSE should enable robust perfusion imaging across the entire kidneys in comparable scan times [4].Acknowledgements
NIH/NCI U01CA207091References
[1] P. M. Robson et al., "Volumetric arterial spin-labeled perfusion imaging of the kidneys with a three-dimensional fast spin echo acquisition," Academic radiology, vol. 23, no. 2, pp. 144-154, 2016.
[2] P. M. Robson, A. J. Madhuranthakam, W. Dai, I. Pedrosa, N. M. Rofsky, and D. C. Alsop, "Strategies for reducing respiratory motion artifacts in renal perfusion imaging with arterial spin labeling," Magn Reson Med, vol. 61, no. 6, pp. 1374-87, Jun 2009.
[3] W.-C. Wu, M.-Y. Su, C.-C. Chang, W.-Y. I. Tseng, and K.-L. Liu, "Renal perfusion 3-T MR imaging: a comparative study of arterial spin labeling and dynamic contrast-enhanced techniques," Radiology, vol. 261, no. 3, pp. 845-853, 2011.
[4] J. S. Greer, X. Wang, M. C. Pinho, I. Pedrosa, and A. J. Madhuranthakam, "Robust 3D pCASL perfusion using a Cartesian Acquisition with Spiral Reordering (CASPR)," in International Society for Magnetic Resonance in Medicine, Honolulu, HI, 2017, p. 3628.
[5] H. Jahanian, D. C. Noll, and L. Hernandez-Garcia, "B0 field inhomogeneity considerations in pseudo-continuous arterial spin labeling (pCASL): effects on tagging efficiency and correction strategy," NMR Biomed, vol. 24, no. 10, pp. 1202-9, Dec 2011.
[6] W. C. Wu, M. Fernandez-Seara, J. A. Detre, F. W. Wehrli, and J. Wang, "A theoretical and experimental investigation of the tagging efficiency of pseudocontinuous arterial spin labeling," Magn Reson Med, vol. 58, no. 5, pp. 1020-7, Nov 2007.
[7] L. Zhao, M. Vidorreta, S. Soman, J. A. Detre, and D. C. Alsop, "Improving the robustness of pseudo-continuous arterial spin labeling to off-resonance and pulsatile flow velocity," Magn Reson Med, vol. 78, no. 4, pp. 1342-1351, Oct 2017.
[8] N. Maleki, W. Dai, and D. C. Alsop, "Optimization of background suppression for arterial spin labeling perfusion imaging," MAGMA, vol. 25, no. 2, pp. 127-33, Apr 2012.
[9] J. S. Greer, X. Wang, and A. J. Madhuranthakam, "Robust non-contrast perfusion imaging of whole-lungs using multi-slice FAIR at 3T," in International Society for Magnetic Resonance in Medicine, Paris, France, 2018, p. 2178.
[10] X. Wang, J. S. Greer, I. E. Dimitrov, P. Pezeshk, A. Chhabra, and A. J. Madhuranthakam, "Frequency Offset Corrected Inversion Pulse for B0 and B1 Insensitive Fat Suppression at 3T: Application to MR Neurography of Brachial Plexus," Journal of Magnetic Resonance Imaging, vol. 48, no. 4, pp. 1104-1111, 2018.
[11] K. Lorenz, T. Mildner, T. Schlumm, and H. E. Möller, "Characterization of pseudo‐continuous arterial spin labeling: Simulations and experimental validation," Magnetic resonance in medicine, vol. 79, no. 3, pp. 1638-1649, 2018.
Figures