4958
Arterial spin labeling reveals altered cerebral vascular reactivity to carbon dioxide challenge in Q175 mouse model of Huntington's disease1Bio-Imaging lab,University of Antwerp, Antwerp, Belgium, 2CHDI Foundation, Princeton, NJ, United States
Synopsis
CVR deficits can cause a negative effect on neurovascular coupling leading to blood delivery impairment in activated brain regions. As such, impaired CVR may lead to neural degeneration over a period of time. We measured CBF and CVR using pCASL in Q175 mouse model of Huntington’s disease (11 transgenic and 10 wild-type at 15 month). In order to measure CVR, we measured changes in CBF during a 10% CO2 vascular challenge. The results indicated an overall decreased CVR in transgenic compared to wild-type mice.
Introduction
Cerebral blood flow (CBF) supplies oxygen and nutrients to the brain and has therefore an important role in maintaining brain function. Cerebrovascular reactivity (CVR), an indicator of the vascular reserve, enables the control of CBF distribution during neuronal task and resting state, and consequently brain and vascular function. CVR refers to the response of the cerebral vasculature (dilation or constriction) to vasoactive stimuli, e.g. a CO2-challenge increases blood flow via vasodilation. Altered CVR could lead to impaired blood delivery to brain regions which over time leads to neural degeneration. Diminished CVR has been implicated in neurodegenerative diseases (ND) such as Alzheimer [1].
Huntington’s disease (HD) is a congenital ND which is caused by CAG (cytosine-adenine-guanine) repeat expansion in the huntingtin gene (HTT). The mechanisms underlying HD are not yet fully understood and need further investigations. Animal models of HD allow to elucidate the HD pathogenesis and to translate findings to clinical studies. The Q175 Heterozygous mouse model mimics HD in human closely. Mutant HTT (mHTT) accumulation has been observed in striatum and cortex as early as 4 and 6 months of age, respectively. Furthermore, mHTT accumulation increases in size and density with age [2-4]. In this study, we seek to investigate CVR deficit in HD using pseudo Continuous Arterial spin labeling (pCASL) MRI. To the best of our knowledge, this is the first study in which CVR in HD is evaluated.
Methods
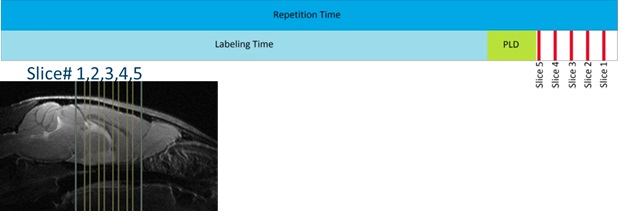
pCASL data was acquired in 21 15-month Q175 male mice (transgenic, N=11; wild-type (WT), N=10) using a 7T Bruker scanner. Mice were anesthetized using a mixture of medetomidine (0.05mg/kg s.c. bolus; 0.01mg/kg/h s.c. infusion) and 0.4% isoflurane. Physiological parameters were continuously monitored and kept stable throughout the procedures. pCASL scans were acquired 30 minutes post-bolus and continuously for 17.5 minutes i.e. 7 minutes of baseline (O2), 7 minutes of CO2 challenge (90% O2 and 10% CO2) and 3.5 minutes of recovery (O2). PCASL scans are acquired using a SE-EPI sequence (TR/TE 3450/19.5ms, 5 coronal slices (see Fig.1), 120 label/control images (60/60/30 baseline/challenge/recovery), spatial resolution (0.26 x 0.39 x 0.8) mm³), Post label delay (PLD) 200ms, and 3000ms labeling-time [5]. Prior to acquiring pCASL data, additional scans are acquired to optimize pCASL sequence: a Time of Flight angiogram to determine the position of the label plane, and pCASL scans to define the phase increment for both the labeling and control RF pulses. To absolutely quantify CBF, a T1 map (slice-selective Inversion Recovery sequence) and a labeling efficiency map were obtained. The realignment of the images within a pCASL scan and the co-registration of the T1-map to the pCASL images were performed in SPM12 software. Absolute CBF was calculated based on the single compartment model [6]. CBF data was spatially normalized to a study template generated in ANTs. In-plane smoothing of CBF maps was performed in SPM12. All statistical analyses were performed in SPM12 using voxel-based analysis (VBA) with FDR correction (p-value 0.05).Results and Discussion
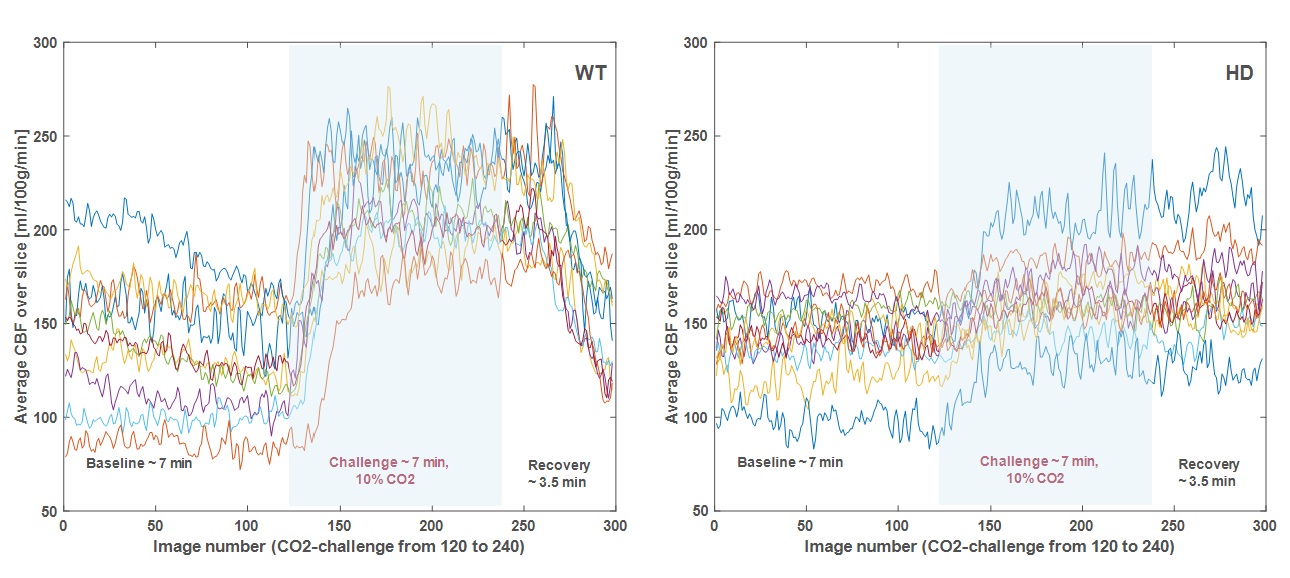
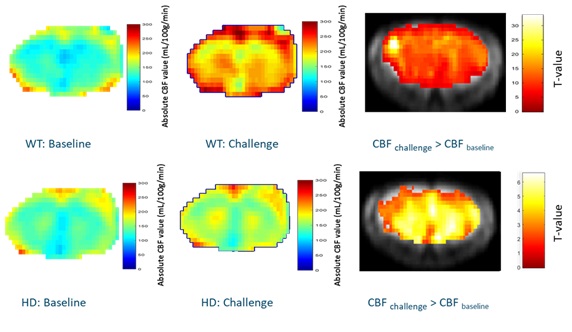
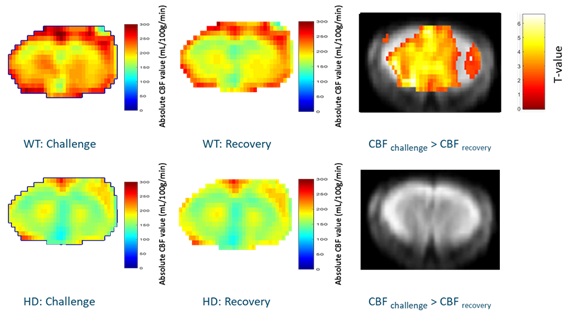
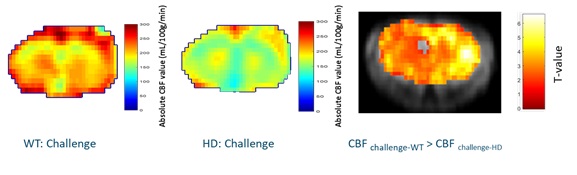
Fig.2 shows the dynamic CBF profile for slice 3 (similar results were obtained for all slices), before, during, and after CO2-challenge. The profiles indicate that (1) the CO2-challenge induces smaller increase in CBF with respect to baseline for HD (~15 % CBF increase upon challenge) compared to WT (~57 % CBF increase upon challenge) mice, and (2) there is a large and fast decrease in CBF value in WT mice after challenge, whereas CBF values remain elevated for HD mice. Fig.3 displays a statistical map of CBF differences between baseline and CO2 challenge within group. According to Fig.3 (1) hippocampus has a low CBF response and cortical regions and striatum have high CBF responses to the vascular challenge in WT, and (2) cortical regions have low response and Globus Pallidus has high response to the vascular challenge in HD mice. The statistical maps of CBF differences between CO2 challenge and recovery are presented in Fig.4. The results indicate that there is no significant recovery from the vascular challenge in HD mice. We found no significant CBF difference between the HD and WT in baseline condition. Testing for CVR differences (CO2 challenge) between groups (Fig. 5) revealed diminished CVR in all regions in HD compared to WT.Conclusion
Our results suggest significant deficits in vascular reactivity in HD raising the possibility that mHtt pathology is involved in impairing CVR. In future studies, we want to link the change in vascular reactivity to changes in functional connectivity and altered quasi-periodic patterns of brain activity.Acknowledgements
No acknowledgement found.References
1. Yezhuvath US, Uh J, Cheng Y, Martin-Cook K, et al. Forebrain-dominant deficit in cerebrovascular reactivity in Alzheimer's disease. Neurobiol Aging. 2012;33(1):75-82
2. Menalled L., Kudwa AE, Miller S, et al. Comprehensive behavioral and molecular characterization of a new knock-in mouse model of Huntington's disease: zQ175. PLoS One. 2012;7(12),e49838.
3. Heikkinen T, Lehtimaki K, Vartiainen N, et al. Characterization of neurophysiological and behavioral changes, MRI brain volumetry and 1H MRS in zQ175 knock-in mouse model of Huntington's disease. PLoS One. 2012;7(12),e50717.
4. Carty N, Berson N, Tillack K, et al. Characterization of HTT inclusion size, location, and timing in the zQ175 mouse model of Huntington's disease: an in vivo high-content imaging study. PLoS One. 2015;10 (4),e0123527.
5. Hirschler L, Debacker CS, Voiron J, et al. Interpulse phase corrections for unbalanced pseudo-continuous arterial spin labeling at high magnetic field. Magn Reson Med. 2018;79(3):1314-1324
6. Buxton, R. B. Quantifying CBF with arterial spin labeling. J Magn Reson Imaging. 2005;22:723-726
Figures