4956
Implementation and validation of ASL perfusion measurements for population-based imaging1Radiology & Nuclear Medicine, Erasmus Medical Centre, Rotterdam, Netherlands, 2Epidemiology, Erasmus MC, Rotterdam, Netherlands, 3Global Research, General Electric, Munich, Germany
Synopsis
Pseudocontinuous ASL (pCASL) is an ideal tool for non-invasive perfusion measurements in population-based imaging studies, which require longitudinal scanning with an unchanging MRI hardware and software set-up. Herein we present the results of the implementation and validation of a 3D pCASL sequence for use in the Rotterdam Study, running since 2005.
Introduction
Non-invasive measurement of cerebral blood flow (CBF) with pseudocontinuous arterial spin labelling (pCASL) is a cost-effective and safe option for repeated assessment of cerebral perfusion. This technique is especially attractive for large population-based studies in which healthy participants undergo longitudinal MRI scans. The Rotterdam Study1 started in 2005 with a designated scanner and in view of longitudinal follow-up of the same healthy participants the MRI setup (hardware and software) has not changed since. We are now extending the MRI protocol of the Rotterdam Study with pCASL, for which we needed to implement a pCASL sequence on an MRI system from 2005 and validate the quantification of this in-house implementation.Methods
Acquisition
Imaging was performed on two different 1.5T MRI systems (GE Healthcare, Milwaukee, WI, USA); (I) the population imaging scanner, a Signa EXCITE with software version 11; (II) an Optima MR450w 1.5T with the current software version DV26, which includes the GE-product version of pCASL2. The implementation of pCASL at scanner I was done in-house, converting the product pCASL sequence from software version DV26 to 11. Acquisition parameters were the same for both pCASL implementations; 3D spiral gradient echo read-out with background suppression, 512 points per arm, 8 arms, reconstruction diameter = 200mm, reconstruction matrix 128 x 128 x 30, slice thickness 4 mm, post label delay 1.525s, label duration 1.45s, NEX = 3 ,TE = 0.011s, TR = 4.6s. Each pCASL acquisition included a proton density weighted image for normalisation (the same acquisition parameters, but no labelling applied3).
A perfusion phantom (beta test version of QASPER, Gold Standard Phantoms, London, UK), which allows for setting variable continuous flow rates, was used. Measurements were done at two different days (one per scanner), two weeks apart. During each scan pCASL scans were made for 12 different flow rates (200 – 475 ml/min, steps of 25 ml/min) in random order. In addition, 3 young healthy volunteers (all female, <27 years) underwent pCASL scanning on both MR systems on the same day. Four elderly participants (2 males, > 80 years) of the Rotterdam Study underwent scanning on scanner I only, which included pCASL scans and single slice phase contrast measurements through the major brain feeding arteries.
Analysis
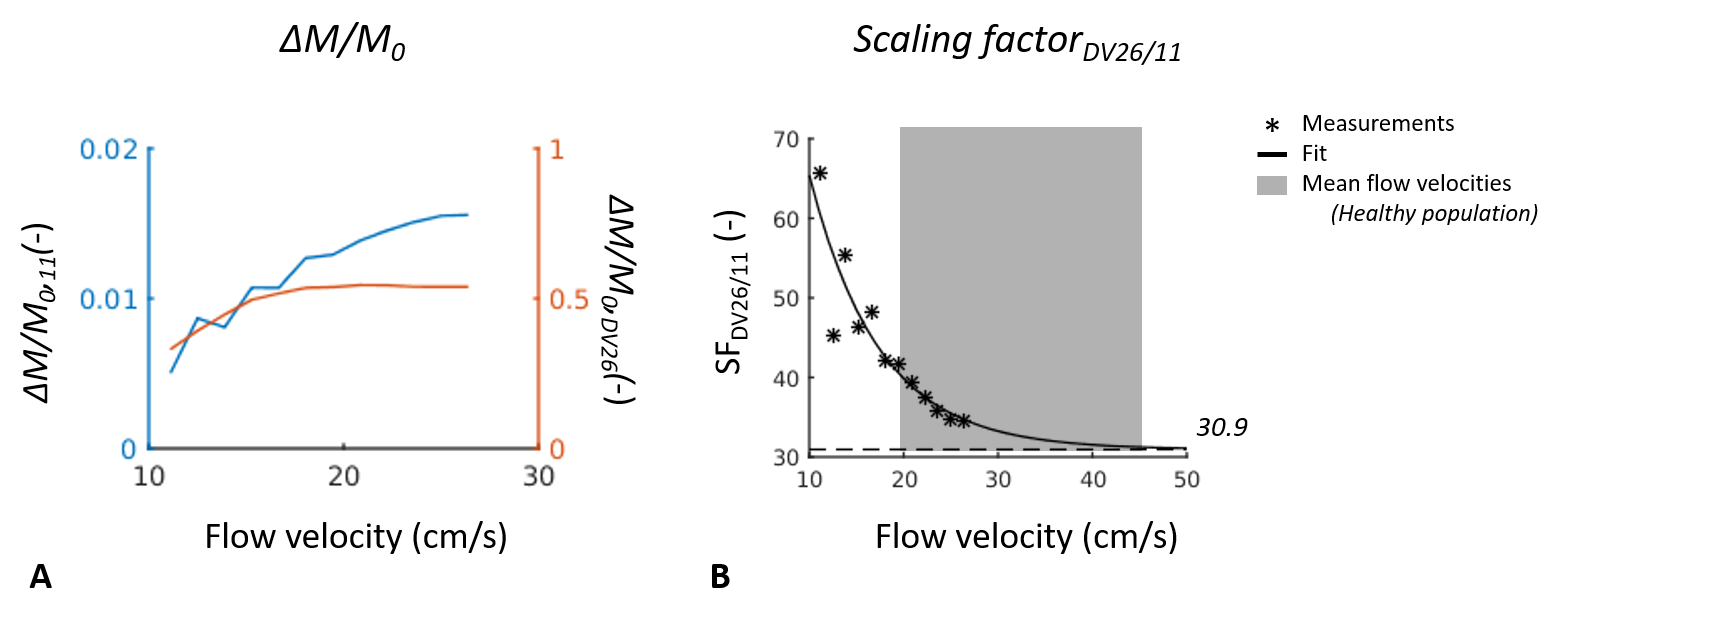
For the phantom, voxelwise perfusion-weighted images (ΔM/M0) were calculated for each pCASL scan3. Median values were calculated over a circular region of interest, which was placed over the perfusion region of the phantom via visual inspection. A scaling factor between the two sequences was calculated by dividing the ROI median ΔM/M0,DV26 by the ROI median ΔM/M0,11. The volunteer CBF maps were quantified with oxford_asl (FSL, version 5.0.9, Oxford, UK)4 and whole brain grey matter CBF was calculated via segmentation of grey matter from T1–weighted structural scans, which were linearly registered to the CBF maps (flirt in FSL).
Results
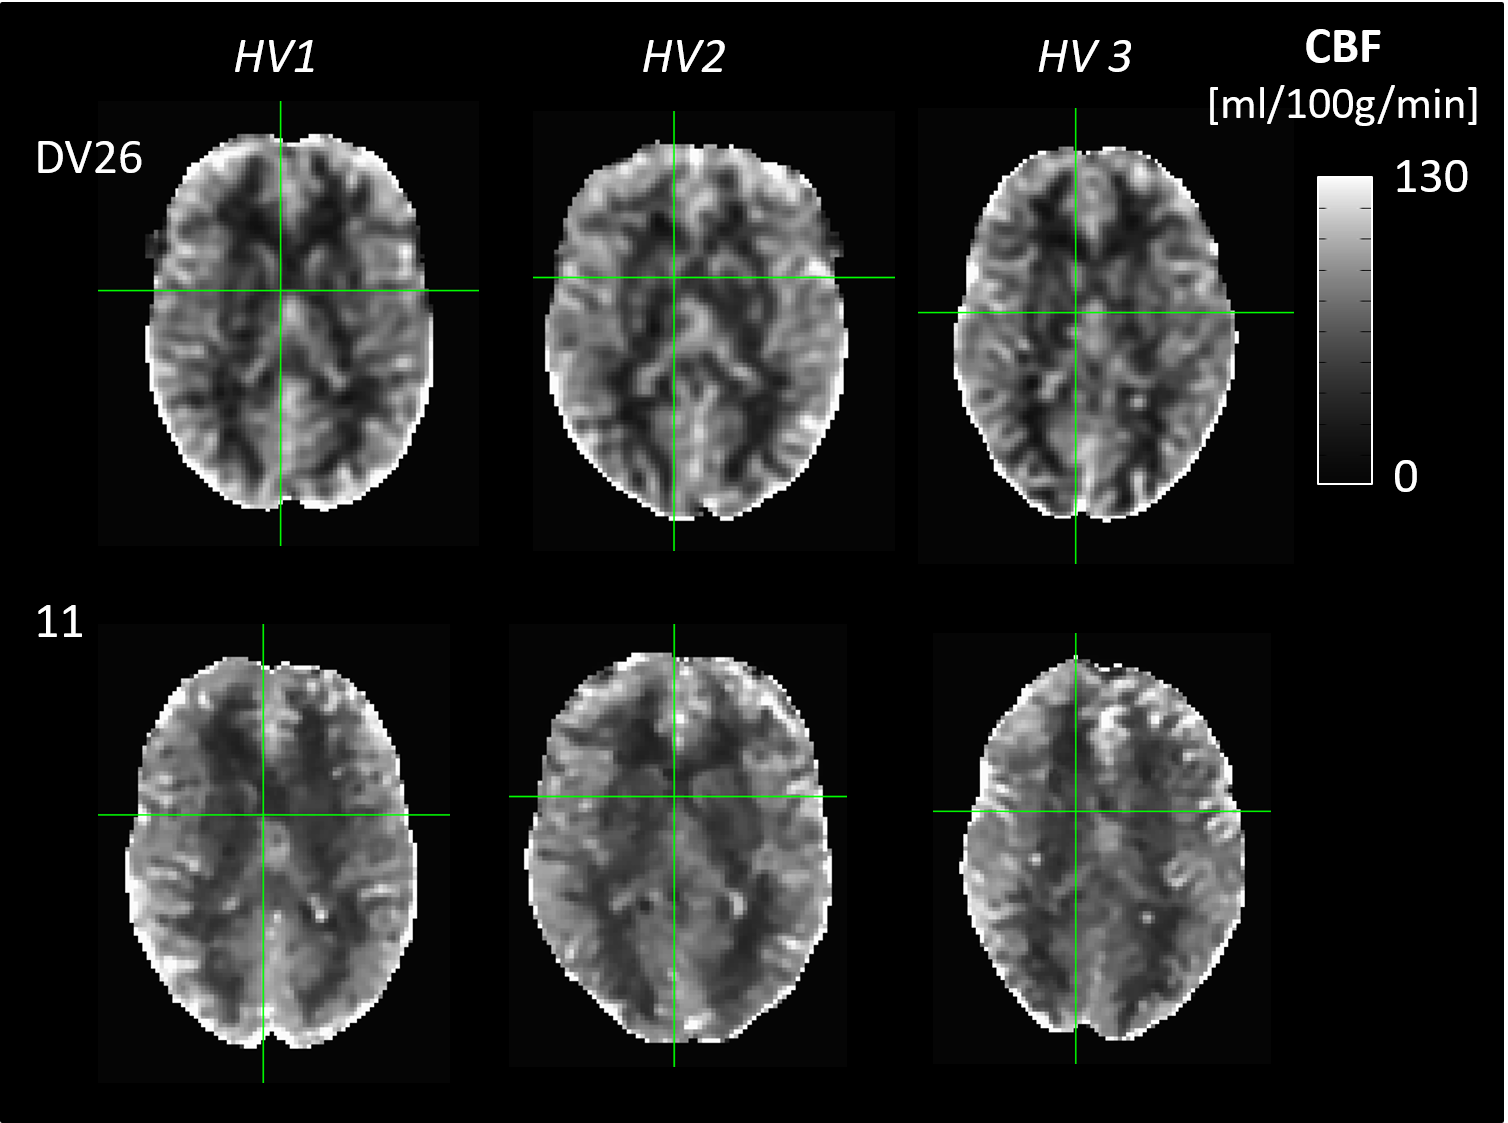
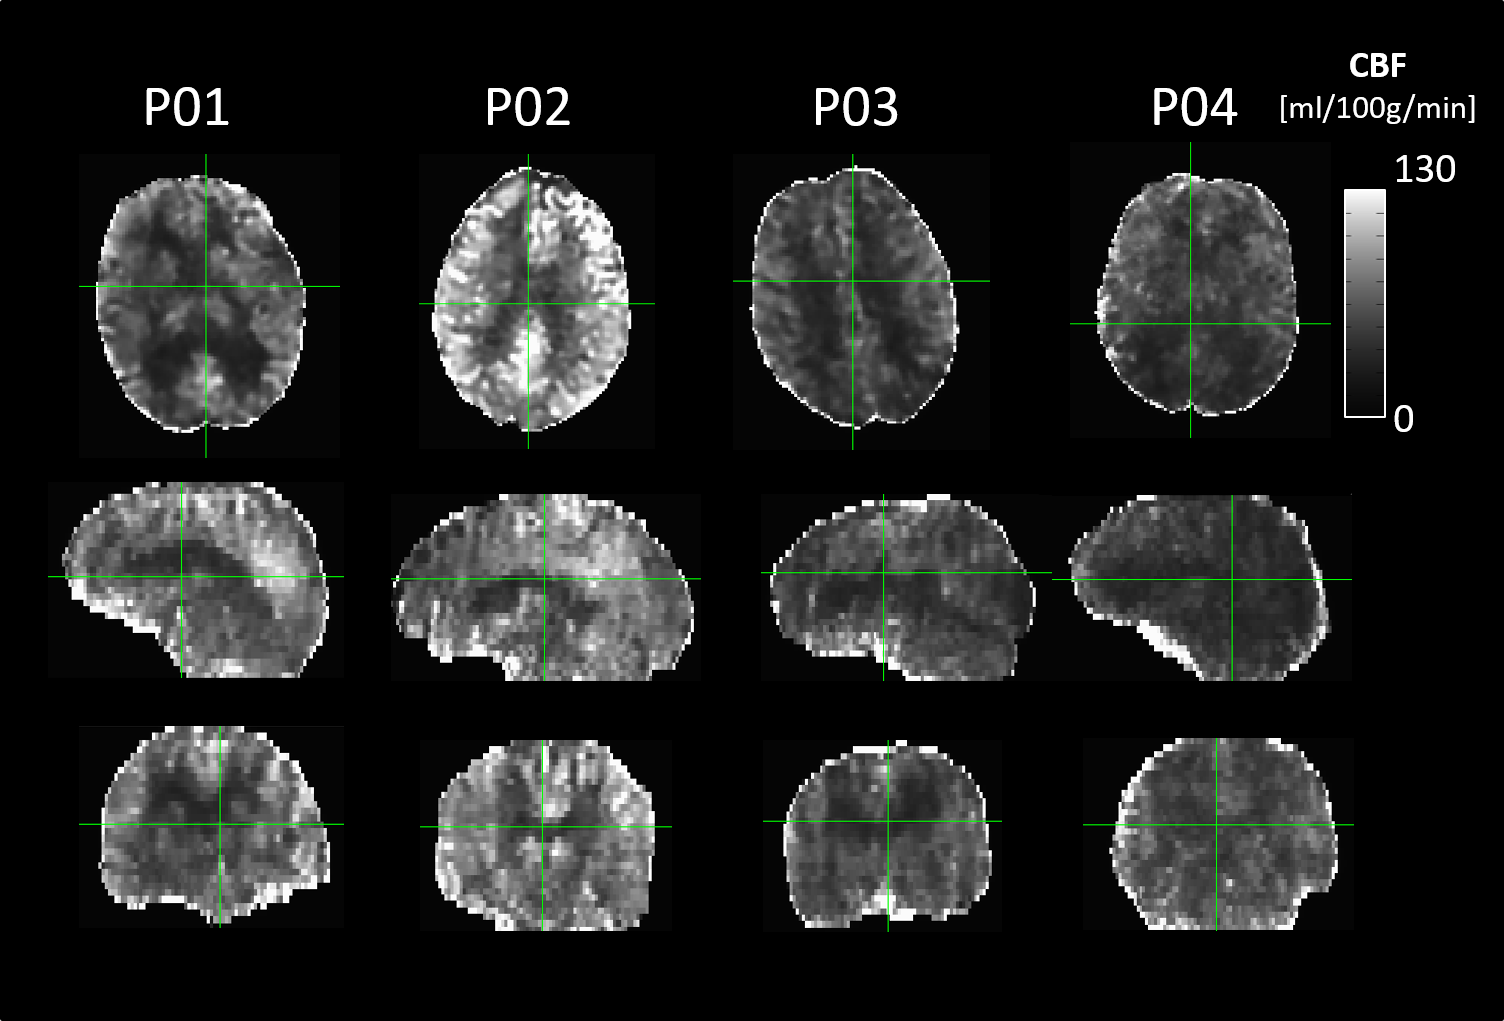
The flow phantom results suggest that there is a difference in flow sensitivity of ΔM/M0 between the two pCASL implementations, with the pCASLDV26 being less sensitive to increasing flow velocities (Figure 1). The scaling factor between the two pCASL implementations has an exponential relationship, with an asymptote at 30.9 (Figure 1B). Grey matter CBF values in healthy young volunteers are similar for both implementations (Figure 2, Table 1). Grey matter CBF in elderly participants is lower than in young volunteers (Figure 3) and coincides with blood flow velocities through major brain feeding arteries (Table 1).Discussion
These results highlight initial validation of an in-house implementation of 3D pCASL on a population MRI system in use in the Rotterdam Study. Comparing the in-house implementation of pCASL (11) to the current product pCASL sequence (DV26) in healthy and young volunteers shows limited differences between the resulting quantified CBF maps. However, the flow phantom results indicate that labelling efficiency decreases more rigorously at lower blood flow velocities (<30 cm/s) in our in-house implementation of pCASL. This is likely due to hardware components of different performance, and due to difference in software features, such as image reconstruction, image processing, and image data representation between the two scanners.
As expected, the grey matter CBF in elderly participant tends to be lower than in young participants and seems to coincide with blood flow velocities in major brain feeding arteries, suggesting that the in-house implementation of pCASL can be used in the Rotterdam Study. Future work includes further investigation of the effect of blood flow velocity on quantification of CBF in (elderly) participants with slow blood flow (<30cm/s). This will be done via measurements of labelling efficiency in the flow phantom.
Acknowledgements
No acknowledgement found.References
1. Ikram, M. A. et al. The Rotterdam Study: 2018 update on objectives, design and main results. Eur. J. Epidemiol. (2017). doi:10.1007/s10654-017-0321-4
2. Maleki, N., Dai, W. & Alsop, D. C. Optimization of background suppression for arterial spin labeling perfusion imaging. Magn. Reson. Mater. Physics, Biol. Med. (2012). doi:10.1007/s10334-011-0286-3
3. Dai, W., Shankaranarayanan, A. & Alsop, D. C. Volumetric measurement of perfusion and arterial transit delay using hadamard encoded continuous arterial spin labeling. Magn. Reson. Med. 69, 1014–1022 (2013).
4. Alsop, D. C. et al. Recommended implementation of arterial spin-labeled Perfusion mri for clinical applications: A consensus of the ISMRM Perfusion Study group and the European consortium for ASL in dementia. Magn. Reson. Med. (2015). doi:10.1002/mrm.25197
5. Albayrak, R. et al. Doppler sonography evaluation of flow velocity and volume of the extracranial internal carotid and vertebral arteries in healthy adults. J. Clin. Ultrasound (2007). doi:10.1002/jcu.20301
Figures