4953
Beyond the consensus: what to include when 5 minutes are available for perfusion imaging by PCASL?1imec - Vision Lab, Department of Physics, University of Antwerp, Antwerp, Belgium, 2Department of Radiology, Leiden University Medical Center, Leiden, Netherlands, 3Leiden Institute of Brain and Cognition, Leiden University, Leiden, Netherlands, 4Department of Radiology and Nuclear Medicine, Ghent University, Ghent, Belgium, 5Delft Center for Systems and Control, Delft University of Technology, Delft, Netherlands
Synopsis
While the consensus statement on the recommended implementation of arterial spin labeling (ASL) has advanced ASL to clinical application, variations in labeling efficiency, longitudinal relaxation time of blood and arterial transit times can cause significant quantification errors. With simulation experiments, it is shown that sacrificing ASL scan time for measurements of these parameters improves the estimation reproducibility of the cerebral blood flow on a population level. Furthermore, multi-delay ASL modalities in combination with these extra measurements can compete with or outperform the single-delay consensus implementation in terms of estimation accuracy and precision, depending on the underlying distribution of transit times.
Introduction
In 2015, the ISMRM perfusion study group and the European consortium for ASL in dementia delineated a recommended implementation of arterial spin labeling (ASL) MRI for clinical application1. While this has pushed ASL towards clinical adoption, several potential quantification confounders remain, such as variations in labeling efficiency ($$$\small{\alpha}$$$), longitudinal relaxation time of blood ($$$\small{T_{1b}}$$$) and arterial transit times ($$$\small{\Delta}$$$$$$\small{t}$$$)2. These parameters can be estimated from additional experiments ($$$\small{\alpha}$$$ and $$$\small{T_{1b}}$$$)3,4 or by a modified acquisition of ASL data ($$$\small{\Delta}$$$$$$\small{t}$$$)5,6. However, both the ASL scan as the supporting measurements come with limited SNR posing the question how to distribute scan time in say a five-minute protocol between averaging of ASL data and acquiring supporting measurements. In this work, this dilemma is studied by means of simulations.
Methods
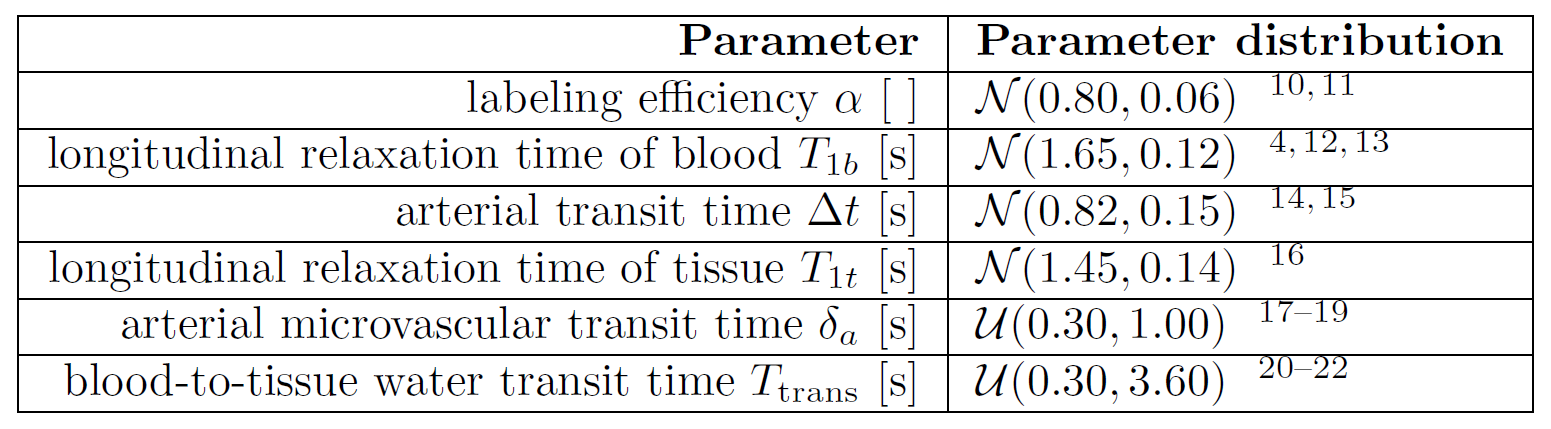
The simulation experiment consisted of three parts (Fig.1). First, a physiological state associated with a perfusion process was defined by a set of parameters $$$\small{\boldsymbol{\theta}_i}$$$ drawn randomly from a population distribution $$$\small{p(\boldsymbol{\theta})}$$$ (see Table 1) and by the cerebral blood flow (CBF), which was kept constant at 50mL/100g/min. With these parameters, pseudocontinuous ASL (PCASL) data can be simulated accurately by a convolution of a rectangular arterial input function7 and a single-pass approximation (SPA) impulse residue function8. In the second step, a five-minute experiment was simulated in which the scan time is divided between the ASL acquisition and support-scans to estimate $$$\small{\alpha_i}$$$ and $$$\small{T_{1b,i}}$$$. Three options were considered for the ASL acquisition: single-post-labeling-delay PCASL (single-PLD PCASL) with labeling duration $$$\small{\tau}$$$=1800ms and PLD=1800ms, time-encoded free-lunch PCASL6 (te-FL PCASL) with the duration of block one 1800ms followed by ten blocks of 175ms and a 50ms shortest PLD, and multi-PLD PCASL with $$$\small{\tau}$$$=1800ms and PLDs=200,400,...,2000ms. Number of averages of the ASL acquisition was set based upon the available scan time. Estimates of $$$\small{\alpha_i}$$$ and $$$\small{T_{1b,i}}$$$ were simulated by a random draw from normal distributions $$$\small{\mathcal{N}(\alpha_i,\sigma_\alpha)}$$$ and $$$\small{\mathcal{N}(T_{1b,i},\sigma_{T_{1b}})}$$$, with $$$\small{\sigma_\alpha}$$$ and $$$\small{\sigma_{T_{1b}}}$$$ scaled inversely by the square root of the respective assigned scan time to reflect averaging. Realistic values for the temporal SNR of ASL data, and $$$\small{\sigma_\alpha}$$$ and $$$\small{\sigma_{T_{1b}}}$$$ for certain reported scan times were adopted from literature3,4,9. Thirdly, the single-compartment model was used to quantify CBF1,7. For te-FL and multi-PLD PCASL, $$$\small{\Delta}$$$$$$\small{t}$$$ is estimated alongside the CBF.
This entire protocol was repeated on three levels: 1) varying distributions of the five-minute scan time 2) for each scan time distribution, 10000 physiological conditions ($$$\small{i}$$$=1,...,10000) were simulated, and 3) for each of these, 1000 noise realizations of the PCASL data and $$$\small{\alpha}$$$ and $$$\small{T_{1b}}$$$ measurements were generated
($$$\small{j}$$$=1,...,1000).
Results
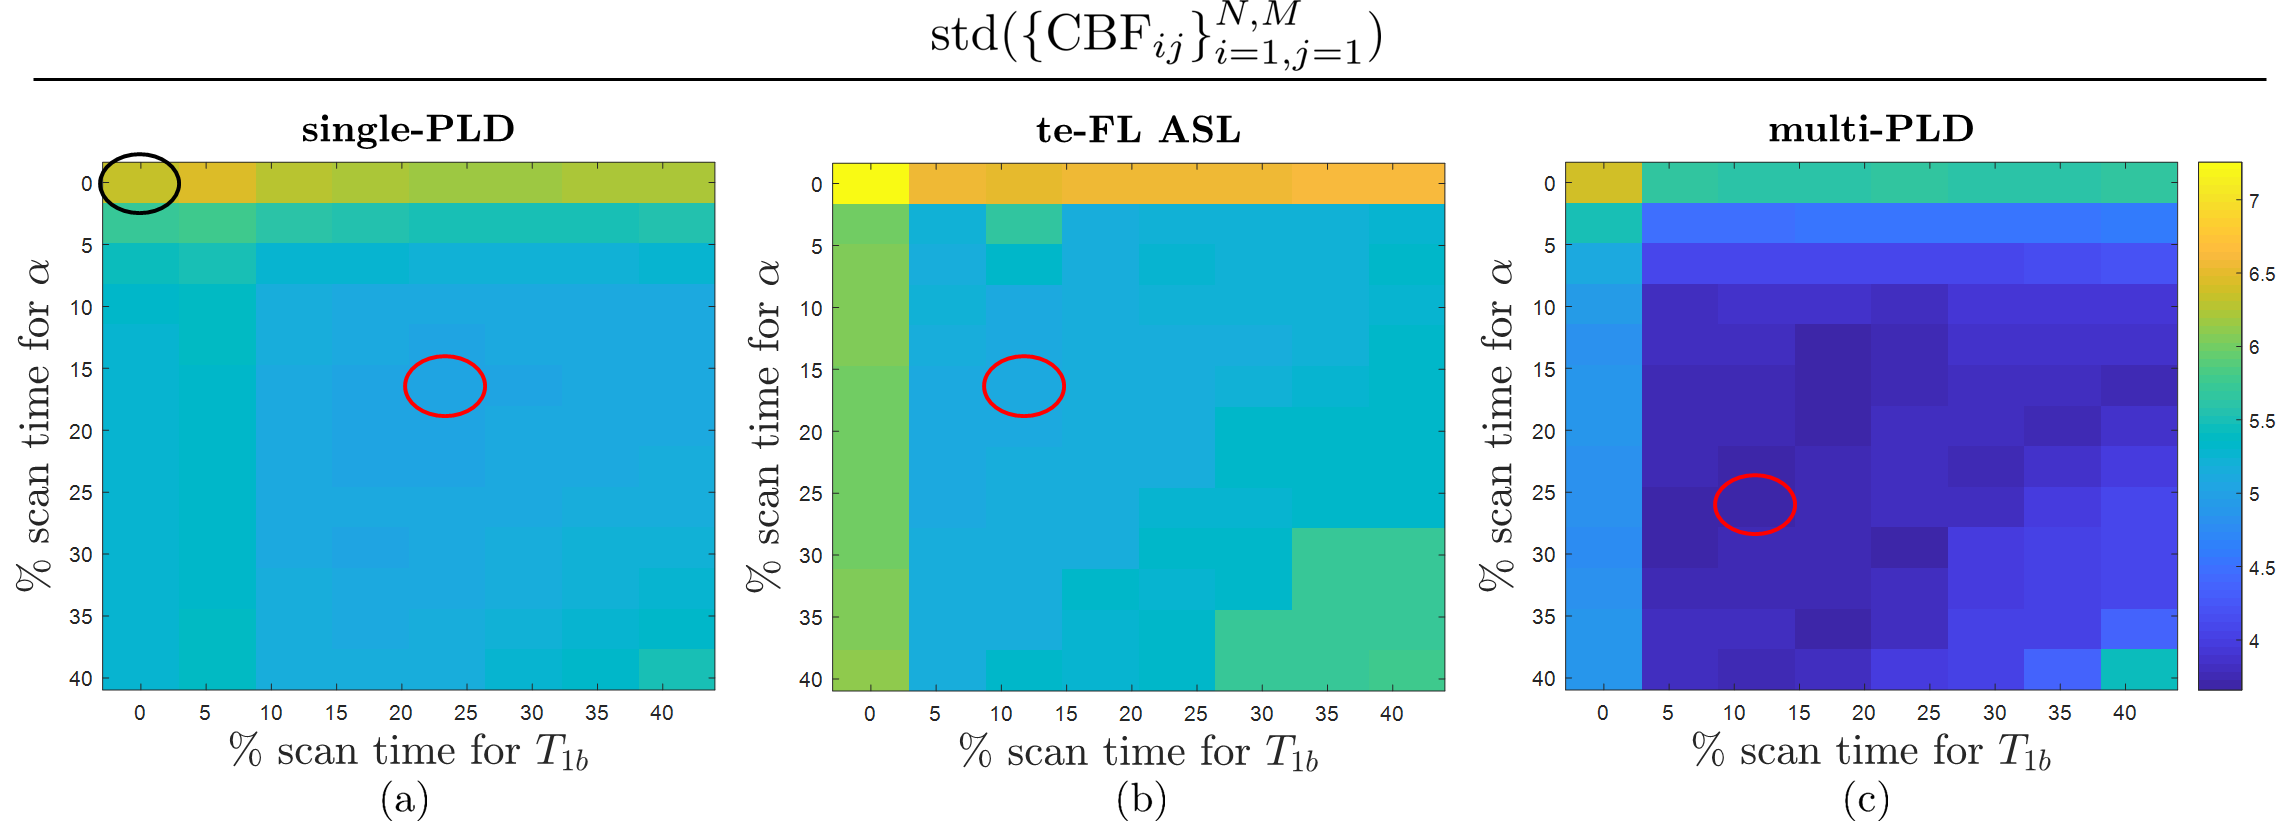
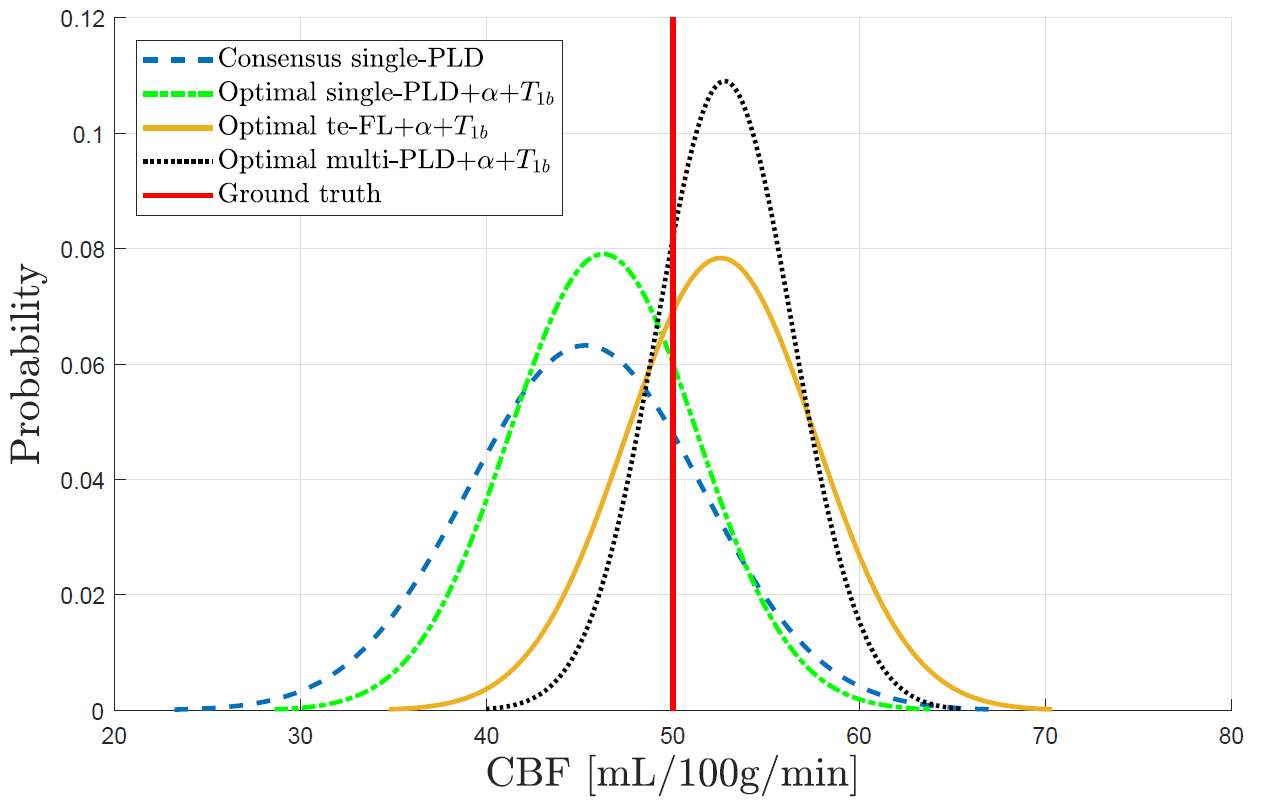
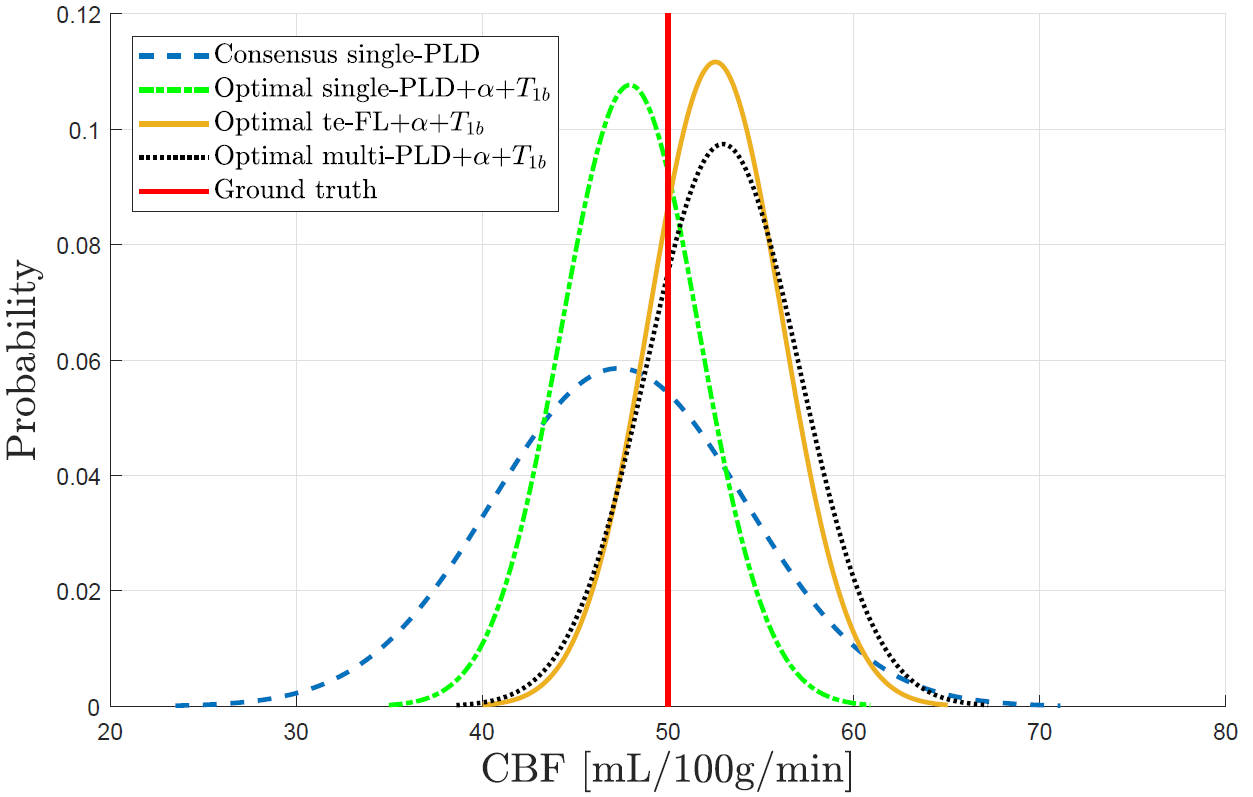
For every considered five-minute experiment, the standard deviation of the set of estimates $$$\small{\{\textrm{CBF}_{ij}\}_{i=1,j=1}^{N,M}}$$$ is a measure of reproducibility (Fig.2). According to this metric, the optimal distribution of scan time between ASL, $$$\small{\alpha}$$$ and $$$\small{T_{1b}}$$$ is 62%-16%-22%, 71%-16%-13% and 60%-27%-13% for single-PLD, te-FL and multi-PLD PCASL, respectively. Compared to the consensus-statement single-PLD experiment, the optimal configurations show a gain in precision of 20%, 19% and 42%, respectively (Fig.3). The same comparison is shown in Fig.4 for a repetition of the entire simulation with longer $$$\small{\Delta}$$$$$$\small{t}$$$ values ($$$\small{p(\Delta}$$$$$$\small{t)=\mathcal{N}(1.60,0.15)}$$$s). In this case, scan time is optimally divided as 59%-19%-22%, 77%-10%-13% and 68%-19%-13% with a precision-gain of 45%, 48% and 39% for single-PLD, te-FL and multi-PLD PCASL, respectively.Discussion and Conclusion
Splitting scan time between acquisition of ASL data and estimating $$$\small{\alpha}$$$ and $$$\small{T_{1b}}$$$ drastically improves the CBF estimation reproducibility in the general population compared to the consensus-statement ASL experiment. Sacrificing ASL scan time for estimating $$$\small{\alpha}$$$ and $$$\small{T_{1b}}$$$ increases the noise level in the ASL data, yet it captures the underlying physiological state more accurately. On a population level, the latter clearly outweighs the former (Fig.3). For the parameter distributions in Table 1, combining multi-PLD PCASL with estimating $$$\small{\alpha}$$$ and $$$\small{T_{1b}}$$$ proves most reliable (Fig.3). For the assumed $$$\small{\Delta}$$$$$$\small{t}$$$ distribution, a large amount of signal is lost in single-PLD and te-FL PCASL, impeding their performance. The fact that they outperform multi-PLD PCASL for longer $$$\small{\Delta}$$$$$$\small{t}$$$ values (Fig.4) shows the dependence of this simulation on the chosen distribution of $$$\small{\Delta}$$$$$$\small{t}$$$ values and might point to the necessity of including dispersion effects in simulation studies to capture a more realistic spread of arrival times.
The results from any simulation experiment depend on the parameter distributions used to generate data. The benefit of sacrificing ASL scan time for $$$\small{\alpha}$$$ and $$$\small{T_{1b}}$$$ estimation is directly related to the assumed uncertainties for both. Confidence in the conclusions drawn from this experiment can be attributed to the reported distributions being representative for the general population and the use of an accurate data-generation model8. In the future, dispersion will be included to further increase the accuracy of the signal generation process of PCASL.
Acknowledgements
PB is predoctoral fellow of the Research Foundation Flanders (FWO), Grant 1S69918N. JS and AJdD gratefully acknowledge support of the European Space Agency (ESA) and BELSPO Prodex through the BrainDTI project.References
- Alsop DC, Detre JA, Golay X, et al. Recommended implementation of arterial spin-labeled perfusion MRI for clinical applications: A consensus of the ISMRM perfusion study group and the European consortium for ASL in dementia. Magn Reson Med 2015;73:102-116.
- van Osch MJP, Teeuwisse WM, Chen Z, et al. Advances in arterial spin labelling MRI methods for measuring perfusion and collateral flow. J Cereb Blood Flow Metab 2018;38:1461-1480.
- Chen Z, Zhang X, Yuan C, et al. Measuring the labeling efficiency of pseudo-continuous arterial spin labeling. Magn Reson Med 2017;77:1841-1852.
- Li W, Liu P, Lu H, et al. Fast measurement of blood T1 in the human carotid artery at 3T: Accuracy, precision, and reproducibility. Magn Reson Med 2016;77:2296-2302.
- Gonzalez-At JB, Alsop DC, Detre JA. Cerebral perfusion and arterial transit time changes during task activation determined with continuous arterial spin labeling. Magn Reson Med 2000;43:739-746.
- Teeuwisse WM, Schmid S, Ghariq E, et al. Time-encoded pseudo-continuous arterial spin labeling: Basic properties and timing strategies for human applications. Magn Reson Med 2014;72:1712-1722.
- Buxton RB, Frank LR, Wong EC, et al. A general kinetic model for quantitative perfusion imaging with arterial spin labeling. Magn Reson Med 1998;40:383-396.
- St Lawrence K, Frank J, McLaughlin A. Effect of restricted water exchange on cerebral bloodflow values calculated with arterial spin tagging: A theoretical investigation. Magn Reson Med 2000;44:440-449.
- Vidorreta M, Wang Z, Rodriguez I, et al. Comparison of 2D and 3D single-shot ASL perfusion fMRI sequences. NeuroImage 2013;66:662-671.
- Jung Y, Wong EC, Liu TT. Multiphase pseudocontinuous arterial spin labeling (MP-PCASL) for robust quanti cation of cerebral blood flow. Magn Reson Med 2010;64:799-810.
- Zhao L, Vidorreta M, Soman S, et al. Improving the robustness of pseudo-continuous arterial spin labeling to off-resonance and pulsatile flow velocity. Magn Reson Med 2017;78:1342-1351.
- Hales PW, Kirkham FJ, Clark CA. A general model to calculate the spin-lattice (T1) relaxation time of blood, accounting for haematocrit, oxygen saturation and magnetic field strength. J Cereb Blood Flow Metab 2016;36:370-374.
- Li W, Grgac K, Huang A, et al. Quantitative theory for the longitudinal relaxation time of blood water. Magn Reson Med 2016;76:270-281.
- Petersen ET, Mouridsen K, Golay X. The QUASAR reproducibility study, part II: Results from a multi-center arterial spin labeling test-retest study. NeuroImage 2010;49:104-113.
- Qiu M, Paul Maguire R, Arora J, et al. Arterial transit time effects in pulsed arterial spin labeling CBF mapping: Insight from a PET and MR study in normal human subjects. Magn Reson Med 2010;63:374-384.
- Bojorquez JZ, Bricq S, Acquitter C, et al. What are normal relaxation times of tissues at 3 T? Magn Reson Imaging 2017;35:69-80.
- Francis ST, Bowtell R, Gowland PA. Modeling and optimization of look-locker spin labeling for measuring perfusion and transit time changes in activation studies taking into account arterial blood volume. Magn Reson Med 2008;59:316-325.
- Hua J, Qin Q, Pekar JJ, van Zijl PCM. Measurement of absolute arterial cerebral blood volume in human brain without using a contrast agent. NMR Biomed 2011;24:1313-1325.
- Li K, Zhu X, Hylton N, et al. Four-phase single-capillary stepwise model for kinetics in arterial spin labeling MRI. Magn Reson Med 2005;53:511-518.
- St Lawrence KS, Owen D,Wang DJJ. A two-stage approach for measuring vascular water exchange and arterial transit time by diffusion-weighted perfusion MRI. Magn Reson Med 2012;67:1275-1284.
- Herscovitch P, Raichle ME, Kilbourn MR, Welch MJ. Positron emission tomographic measurement of cerebral blood flow and permeability-surface area product of water using [15O]water and[11C]butanol. J Cereb Blood Flow Metab 1987;7:527-542.
- Gregori J, Schuff N, Kern R, Günther M. T2-based arterial spin labeling measurements of blood to tissue water transfer in human brain. J Magn Reson Imaging 2013;37:332-342.
Figures