4952
Comparison of multi-delay renal PASL-FAIR and pCASL perfusion quantification at 3T1Department of Radiology, University Medical Center Utrecht, Utrecht, Netherlands, 2C.J. Gorter Center for high field MRI, Department of Radiology, Leiden University Medical Center, Leiden, Netherlands
Synopsis
ASL has emerged as a non-invasive tool for measuring renal perfusion. Whereas in the brain consensus leans towards pCASL as the preferred labeling strategy, in the kidney PASL-FAIR has been reported on most. A systematic comparison of renal PASL-FAIR and pCASL perfusion measurement was performed at 3T in 16 volunteers, with separate visits to assess repeatability. PASL-FAIR perfusion values were significantly higher than those obtained with pCASL. Moreover, at 3T PASL-FAIR had approximately 2-3 times better repeatability compared to pCASL.
Introduction
Renal perfusion is a
valuable tool for assessing kidney function and identifying pathology1.
In recent years, arterial spin labeling (ASL) magnetic resonance imaging (MRI) is
emerging as a method for non-invasive measurement of renal perfusion.2
Renal perfusion is still a relatively new application area of ASL-MRI. In the recently published white paper for brain ASL3, pseudo-continuous ASL (pCASL) is the recommended labeling method. However, the most-commonly used labeling approach for renal ASL thus far has been flow-sensitive alternating inversion recovery pulsed ASL (PASL-FAIR).2 ASL-MRI in the abdomen brings new challenges, like motion due to respiration, complex vasculature, and increased magnetic field inhomogeneities. The effect on the obtained perfusion signal remains unclear, because a direct comparison between different labeling approaches for renal ASL has not yet been performed. Therefore, the purpose of this study was to compare PASL-FAIR and pCASL labeling approaches for renal perfusion measurement.
Methods
Sixteen middle-aged healthy volunteers (8 male; age 51±10 years; eGFR 86±15mL/min/1.73m2)
were included. Imaging was performed on
a 3T MR-scanner (Ingenia, Philips Healthcare) using a 28-element phased array
coil. Each subject was scanned twice with an interval of one week (median 7 days;
range 4-14 days); both visits were scheduled at the same time of the day.
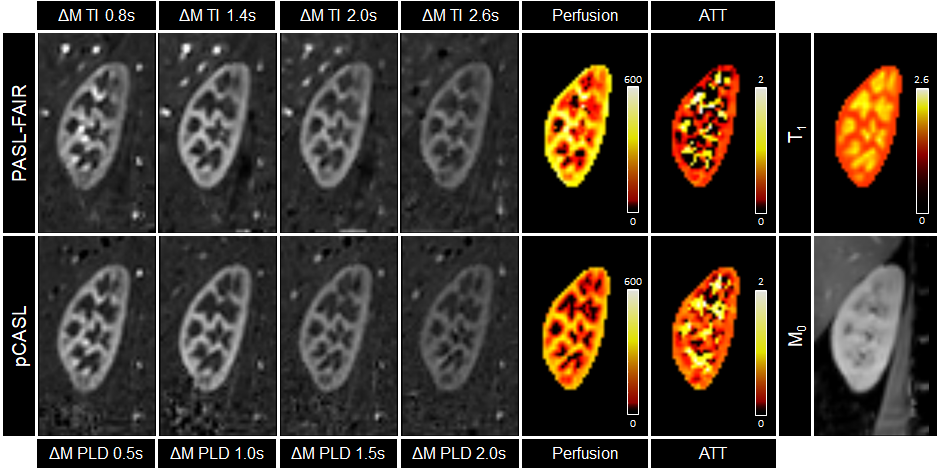
Images of PASL-FAIR were obtained with four
different times-to-inversion (TI; 0.8, 1.4, 2.0, and 2.6s) and QUIPSSII saturation
pulses4 at TI1 of 1.2s. pCASL was obtained with four
different post-labeling delays (PLD; 0.5, 1.0, 1.5, and 2.0s) and a labeling
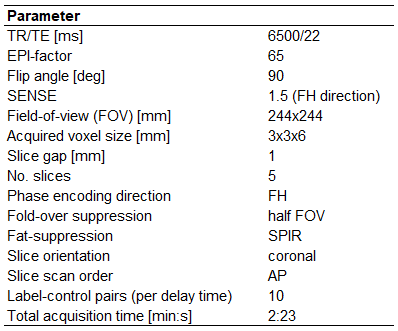
duration of 1.5s. The image readout consisted of 2D multi-slice single-shot
gradient echo EPI (Table 1). For
perfusion quantification an equilibrium magnetization (M0) and T1
map were acquired with the same readout as the ASL images. The T1
map was acquired using a cycled multi-slice inversion recovery sequence5
with 11 inversion times (range 55-2035ms). All acquisitions were performed with
paced breathing.
MR images
were processed and analyzed using custom scripts in MeVisLab (v2.8.2; MeVis
Medical Solutions AG). Realignment was performed using PCA-based group-wise
image registration6 on each individual kidney. After image
registration, label and control images were pair-wise subtracted and averaged
per delay time to obtain perfusion weighted images (ΔM). Voxel-wise T1
relaxation time values were calculated using a non-linear least-squares fit on
the multi-TI acquisitions. Voxel-wise perfusion and arterial transit time (ATT)
were calculated using Buxton’s general kinetic model7.
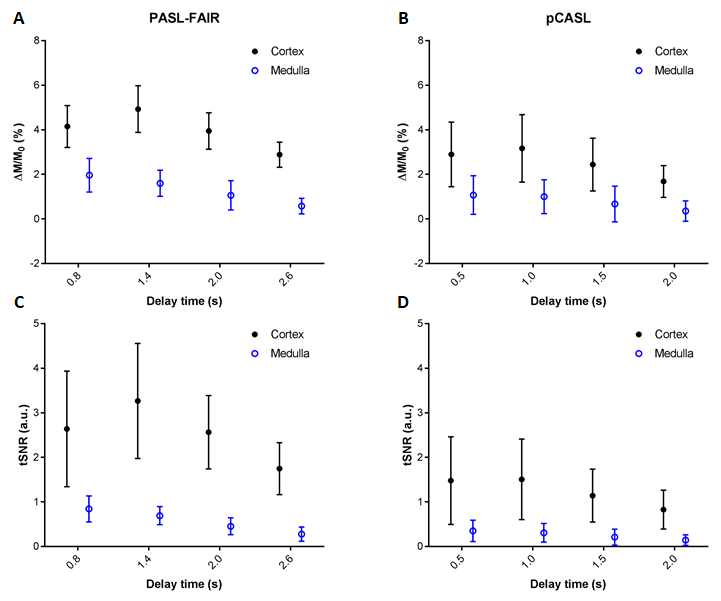
For each delay time, mean temporal signal-to-noise (tSNR) of the ΔM images and mean perfusion weighted signal (ΔM/M0) were calculated. Inter-visit repeatability and agreement of the derived perfusion values were evaluated using the intra-class correlation coefficient (ICC), within-subject coefficient of variation (CVw), and Bland-Altman analysis. Semi-automatic segmentation of cortex and medulla was performed using the T1 map8 for separate analysis of both regions.
Results
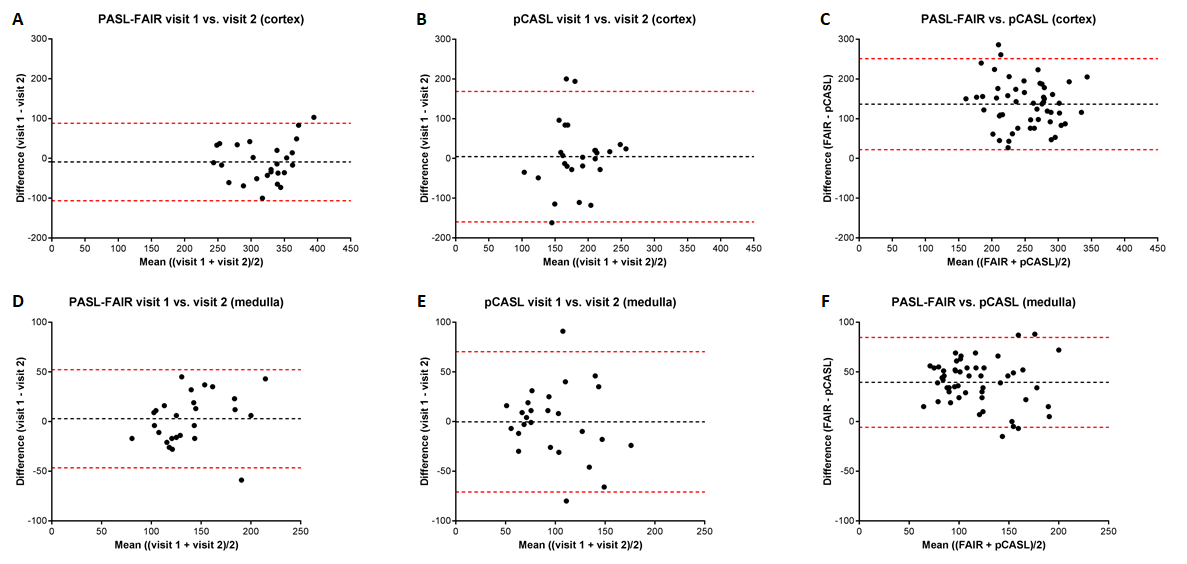
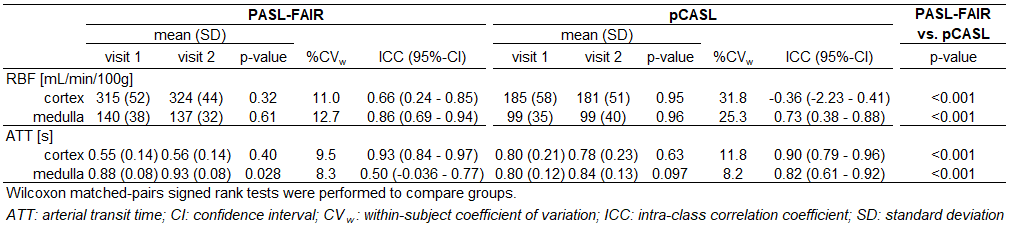
Results were analyzed for 13 out of 16 subjects (Figure 1). Mean cortical and medullary perfusion and ATT measured with PASL-FAIR and pCASL, as well as corresponding CVs and ICCs are presented in Table 2. Bland-Altman plots (Figure 2) showed better agreement for perfusion between the two visits for PASL-FAIR compared with pCASL for both cortex and medulla. Also, a positive bias was observed for perfusion measured with PASL-FAIR relative to pCASL (137 and 39 mL/min/100g for cortex and medulla, respectively). Overall, tSNR of the ΔM images and PWS was higher with PASL-FAIR labeling (Figure 3).Discussion and Conclusion
This study showed that measured
renal perfusion values depend on the labeling approach. Perfusion values were
significantly higher for PASL-FAIR than for pCASL. This might be caused by the
higher sensitivity of pCASL labeling to magnetic field inhomogeneities present
at the labeling location (due to the proximity of air in the lungs) that reduces
labeling efficiency, especially for this study performed at 3T. The variability
in perfusion measurements between visits was substantially larger for pCASL
than for PASL-FAIR. Apart from varying labeling efficiency, physiological variability
in renal blood flow might also play a role - despite hydration instructions and
planning both visits at the same time of the day. Although there was a large quantitative
variability between visits, still diagnostic value of perfusion contrast
showing regional differences within the kidney might be unaffected. This should
be investigated in future patient studies.
In conclusion, in this comparative study between multi-delay PASL-FAIR and pCASL for renal perfusion measurements in healthy middle-aged volunteers, PASL-FAIR showed favorable reproducibility on a 3T wide-bore MRI-scanner.
Acknowledgements
This work is part of the research program Applied and Engineering Sciences with project number 14951 which is (partly) financed by the Netherlands Organization for Scientific Research (NWO). We thank MeVis Medical Solutions AG (Bremen, Germany) for providing MeVisLab medical image processing and visualization environment, which was used for image analysis.References
1. Selby NM, Blankestijn PJ, Boor P, et al. Magnetic resonance imaging biomarkers for chronic kidney disease: a position paper from the European Cooperation in Science and Technology Action PARENCHIMA. Nephrol Dial Transplant. 2018;33(suppl_2):ii4-ii14
2. Odudu A, Nery F, Harteveld AA, et al. Arterial spin labelling MRI to measure renal perfusion: a systematic review and statement paper. Nephrol Dial Transplant. 2018,33(suppl_2):ii15-ii21
3. Alsop DC, Detre JA, Golay X, et al. Recommended implementation of arterial spin-labeled perfusion MRI for clinical applications: A consensus of the ISMRM perfusion study group and the European consortium for ASL in dementia. Magn Reson Med. 2015;73(1):102-16
4. Wong EC, Buxton RB, Frank LR. Quantitative imaging of perfusion using a single subtraction (QUIPSS and QUIPSS II). Magn Reson Med. 1999;39:702-708
5. Clare S, Jezzard P. Rapid T(1) mapping using multislice echo planar imaging. Magn Reson Med. 2001;45(4):630-4
6. Huizinga W, Poot DHJ, Guyader JM, et al. PCA-based groupwise image registration for quantitative MRI. Medical Image Analysis. 2016;29:65-78
7. Buxton RB, Frank LR, Wong EC, et al. A general kinetic model for quantitative perfusion imaging with arterial spin labeling. Magn Reson Med. 1998;40(3):383-96
8. Cox EF, Buchanan CR, Bradley CR, et al. Multiparametric renal magnetic resonance imaging: Validation, interventions, and alterations in chronic kidney disease. Front Physiol. 2017;8:696
Figures