4950
Quantification of intracranial vascular compliance using multi-PLD pseudo-continuous arterial spin labeling with retrospective cardiac gating1Laboratory of FMRI Technology (LOFT), Stevens Neuroimaging and Informatics Institute, Keck School of Medicine, University of Southern California, Los Angeles, CA, United States, 2Department of Neurology, University of Southern California, Los Angeles, CA, United States
Synopsis
Intracranial vascular compliance (IVC) is an important factor in regulating the cerebral perfusion pressure and is believed to be linked to multiple neurological disorders. In this study, a retrospectively-gated multi-PLD pCASL technique was used to estimate arterial cerebral blood volume (aCBV) and compliance. Our results showed that this technique can quantify cardiac-induced variations of aCBV as well as IVC distribution maps.
Introduction
Intracranial vascular compliance (IVC) is defined as the change in arterial cerebral blood volume (aCBV) in response to the change in blood pressure1. The abnormal alteration of IVC is thought to be linked to multiple neurological conditions such as Alzheimer’s disease2 and small-vessel disease3. While pulsed arterial spin labeling (ASL) techniques have been used to quantify IVC4,5, the sensitivity and reliability of these ASL-based IVC measurements remain to be established. Pseudo-continuous ASL (pCASL) is expected to address this challenge due to the high labeling efficiency. In this study, we presented a new technique for in-vivo measurement of IVC using a retrospectively-gated multi-PLD pCASL method.Methods
Theory: The arterial and tissue compartments of the pCASL signal in each voxel ($$$S_a$$$ and $$$S_t$$$, respectively) can be expressed using the general kinetic model6,7 as follows:
$$ S_a(t)=2αM_{0b}.aCBV.(c(t)*(r_a (t).m_a (t))) \tag{1}$$
$$aCVB=f.τ_2 \tag{2}$$
$$ c(t)=exp(-τ_1/T_{1b} ), τ_1<t<τ_1+w \tag{3}$$
$$ S_t(t)=(1/τ_2) (S_a (t)*(r_t (t).m_t (t))) \tag{4}$$
where $$$α$$$ is the labeling efficiency, $$$M_{0b}$$$ is the equilibrium magnetization of the blood, $$$f$$$ is the cerebral blood flow, $$$c(t)$$$ is the normalized arterial input function, $$$T_{1b}$$$ is the T1 relaxation of blood in arteries, $$$w$$$ is the tagging duration, and $$$τ_1$$$ and $$$τ_2$$$ are arterial and tissue transit times, respectively. The residue and magnetization relaxation functions are defined as:
$$r_a(t)=exp(-t/τ_2 ) \tag{5}$$
$$m_a (t)=exp(-t/T_{1b} ) \tag{6}$$
$$r_t (t)=exp(-f(t-τ_2)/λ), t>τ_2 \tag{7}$$
$$m_t(t)=exp(-(t-τ_2)/T_{1t} ), t>τ_2 \tag{8}$$
with $$$T_{1t}$$$ and $$$λ$$$ being the T1 relaxation of tissue and blood-brain partition coefficient, respectively.
Experiments: Four healthy volunteers (two female, age=25±3) were scanned on a Siemens Prisma 3T scanner using pCASL with background suppressed single-shot 3D GRASE sequence. The imaging parameters were: voxel size=2.5×2.5×7.25mm3, TE/TR=36.4/4000ms, 10 slices, tagging duration=1.5s, 60-72 image volumes per scan. Scans with six post-labeling delays (PLDs) were acquired in succession (PLD = 0, 400, 800, 1200, 1600, 1900 ms). Peripheral pulse signal was recorded using a pulse oximeter during scan and was used to retrospectively sort control and labeled images into 5 to 6 cardiac bins for each PLD. Arterial region of interest (ROI) was created by thresholding the ASL subtraction images averaged over all cardiac phases at PLD=0.
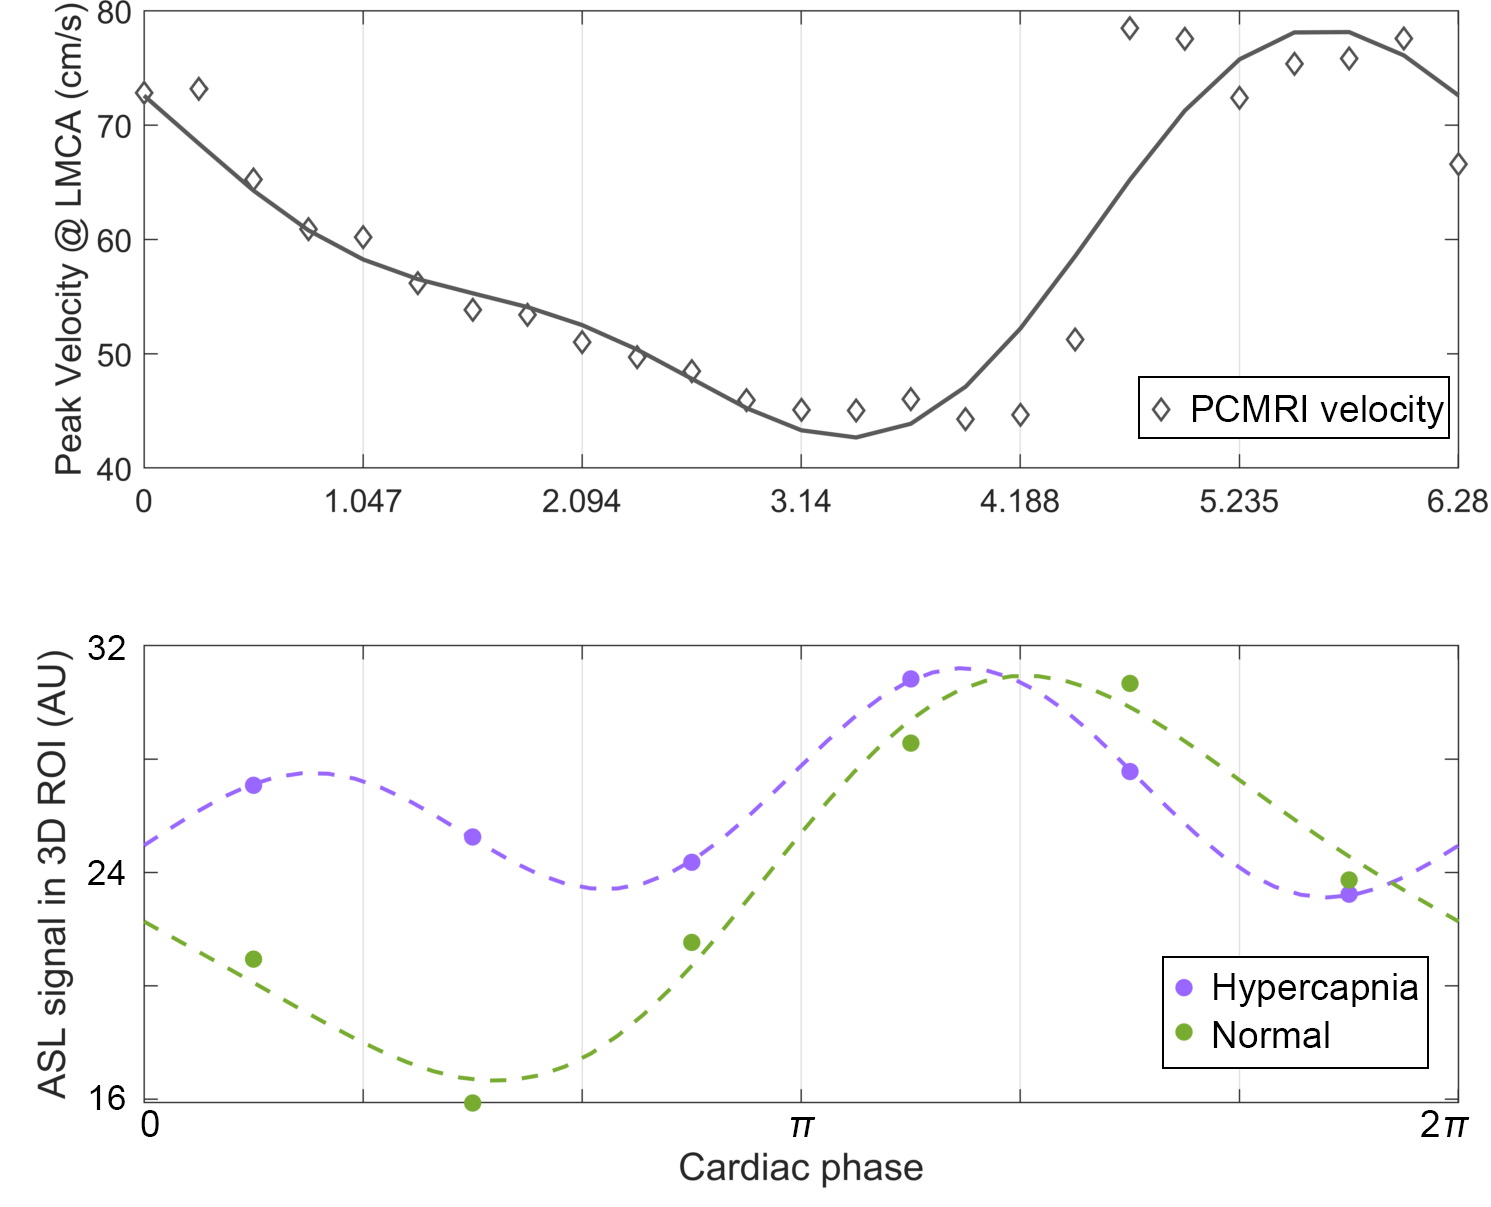
In order to demonstrate the impact of blood volume on ASL signal across cardiac cycle, a pilot hypercapnia scan (5% CO2 for 4 minutes) was carried out on one subject after a control scan using retrospectively-gated pCASL sequence (TR= 1.7s, TD =1.0s, PLD=0, 4 minutes per each scan).
Data analysis: Voxel-wise estimation of aCBV was carried out at each cardiac phase by fitting the multi-PLD data to equations (1) to (8). Unknown parameters were $$$f$$$, $$$τ_1$$$, and $$$τ_2$$$. IVC was calculated using temporal peaks of aCBV as $$$IVC=(aCBV_{max}-aCBV_{min})/(∆p.aCBV_{min})$$$ where $$$Δp$$$ denotes the pulse pressure measured using an MR-compatible cuff sphygmomanometer. aCBV and IVC values were spatially averaged on each axial slice.
Results and Discussion
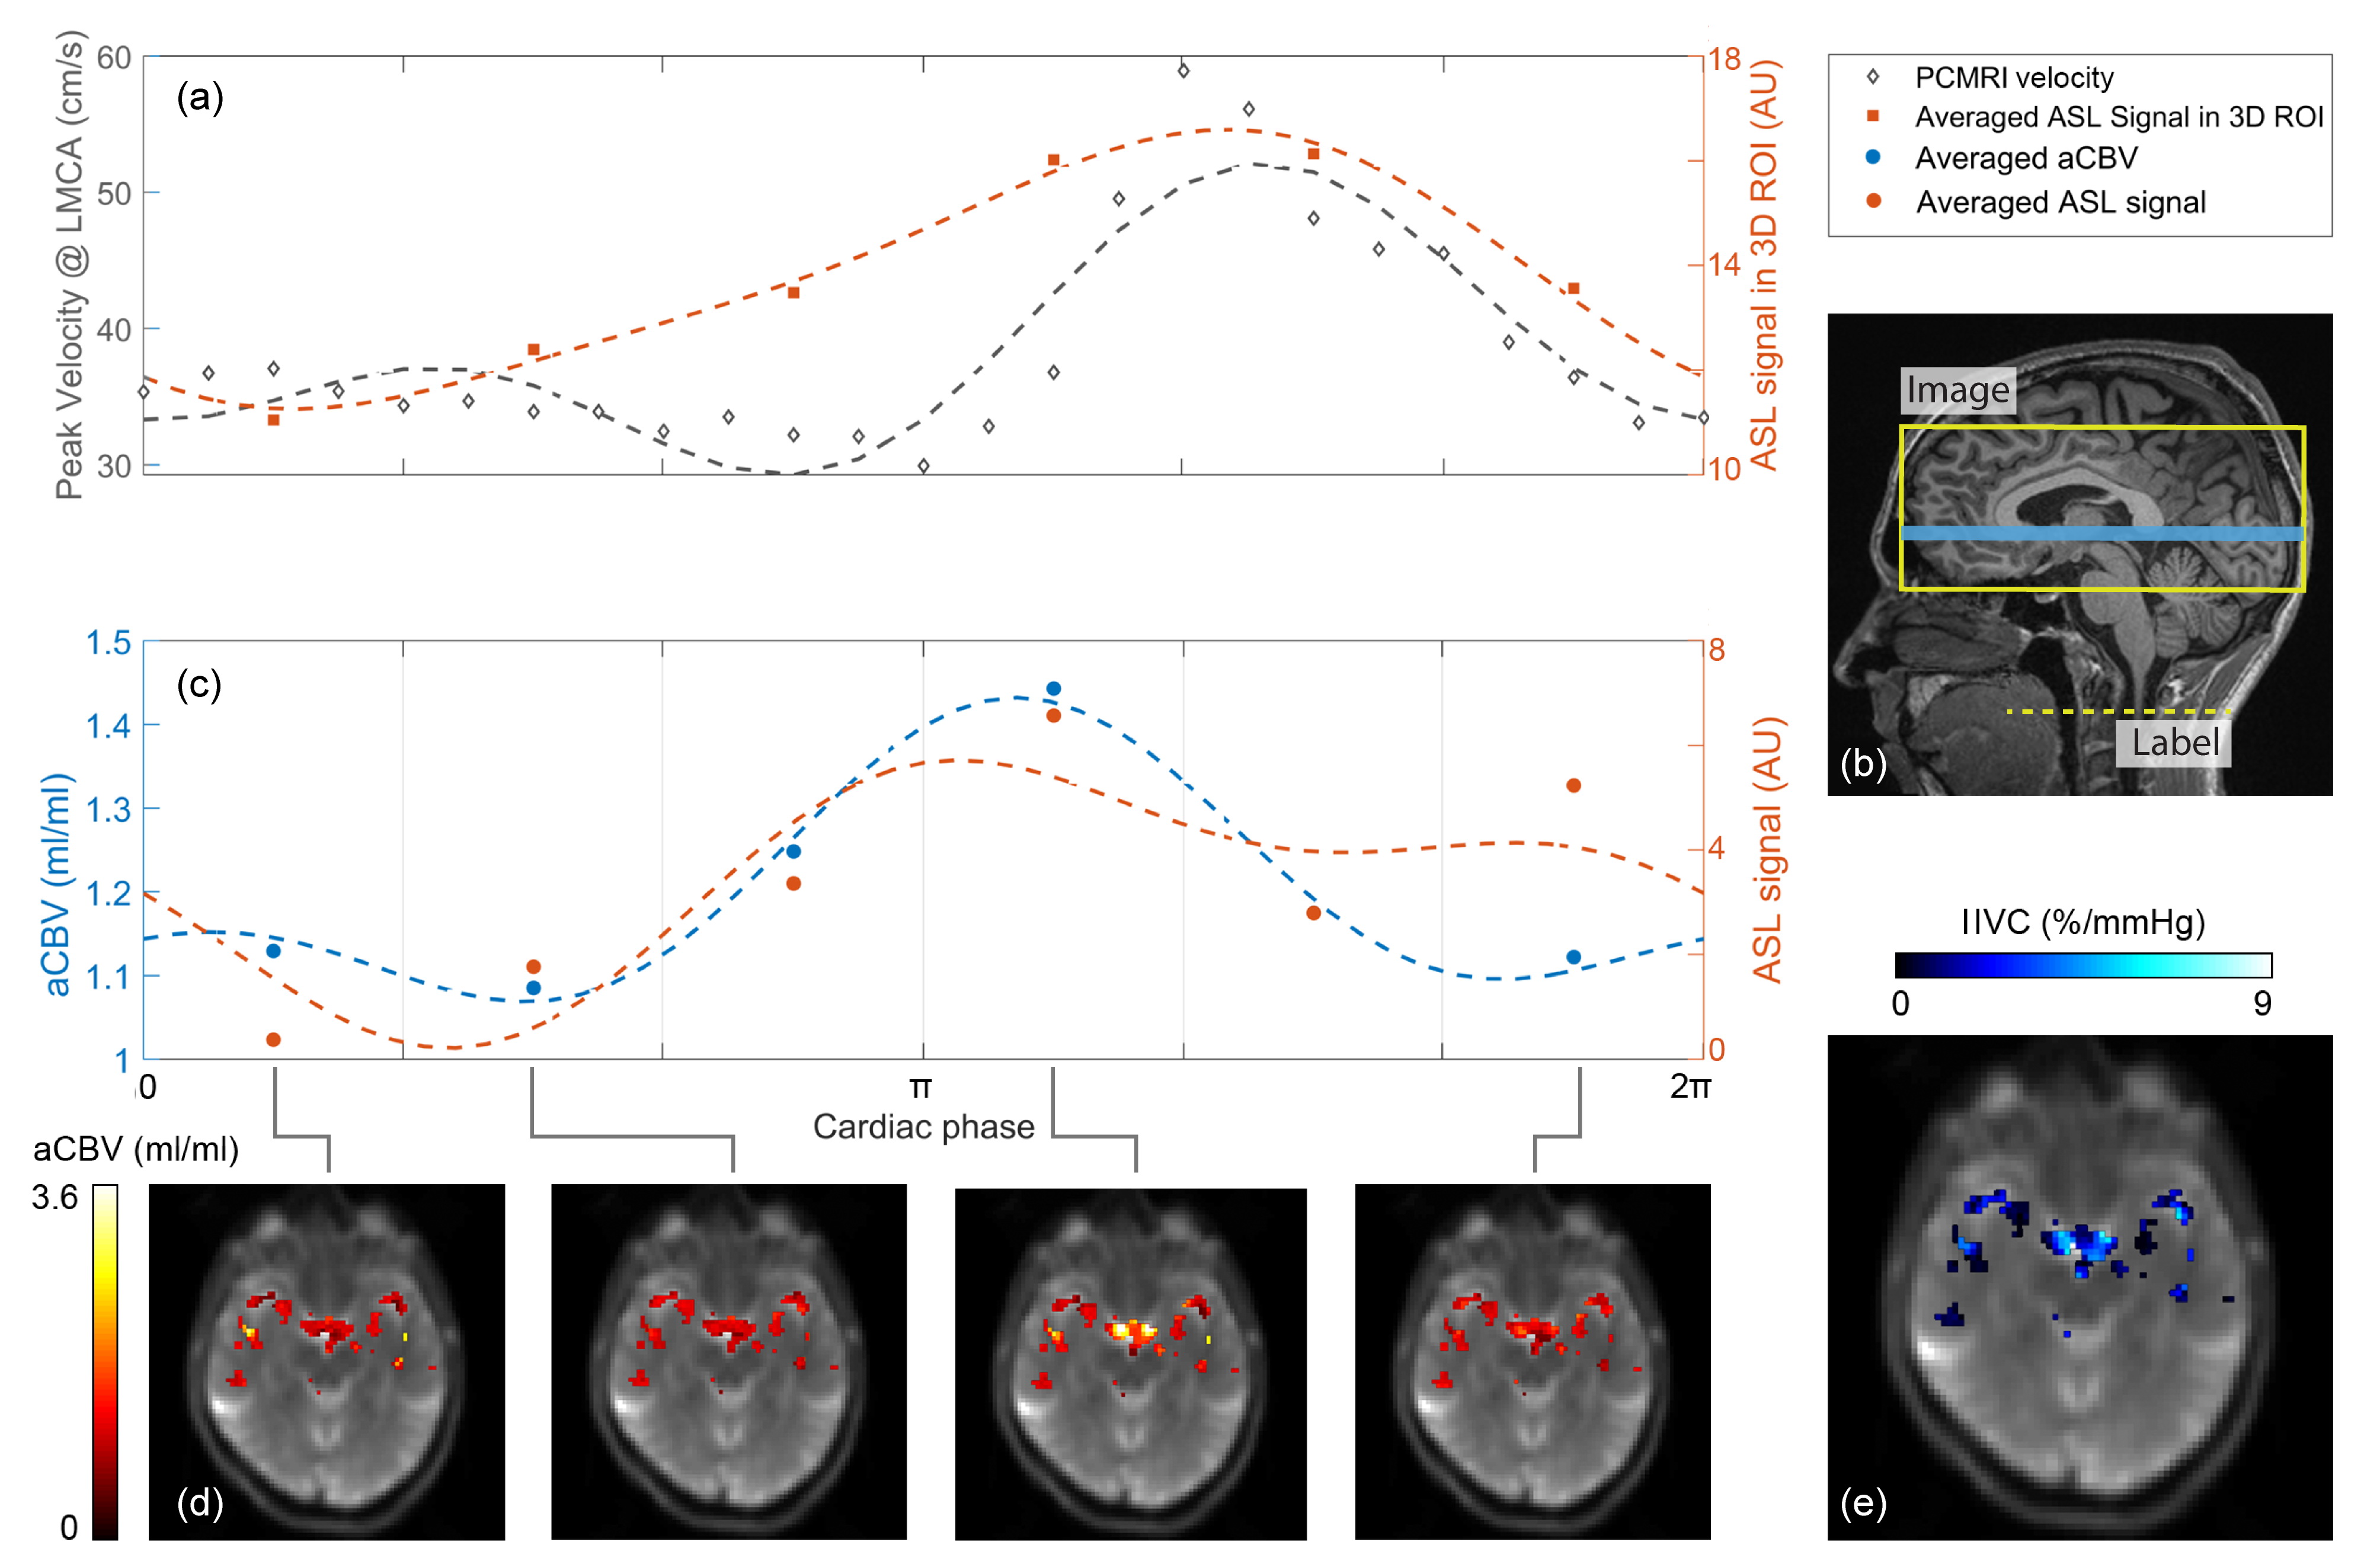
Pulsatile modulations of the ASL signal averaged in 3D ROI were similar to those of the blood velocity measured in the left middle cerebral artery (LMCA) using phase-contrast MRI (Figure 1a), indicating the prominent impact of cardiac pulsations on the arterial ASL signal. The change in the arterial ASL signal observed in this study was notably larger compared to the previously reported cardiac-induced alterations in ASL perfusion signal8. This could reflect the function of the arterial tree in damping out the blood pressure fluctuations prior to tissue perfusion.
Similarly, averaged aCBV exhibited fluctuations consistent with those of the blood velocity (Figure 1c). The phase mismatch between aCBV and velocity time-course could be caused by the voxel-wise variations in arrival times ($$$τ_1$$$, and $$$τ_2$$$) on each axial slice.
While the peak-to-peak ASL signal was reduced by ~38% in response to the hypercapnia challenge, the temporal mean of ASL fluctuations was increased by ~13% (Figure 2). This trend reflects the vasodilation of cerebral arteries in response to hypercapnia, which can reduce cardiac-induced aCBV variation.
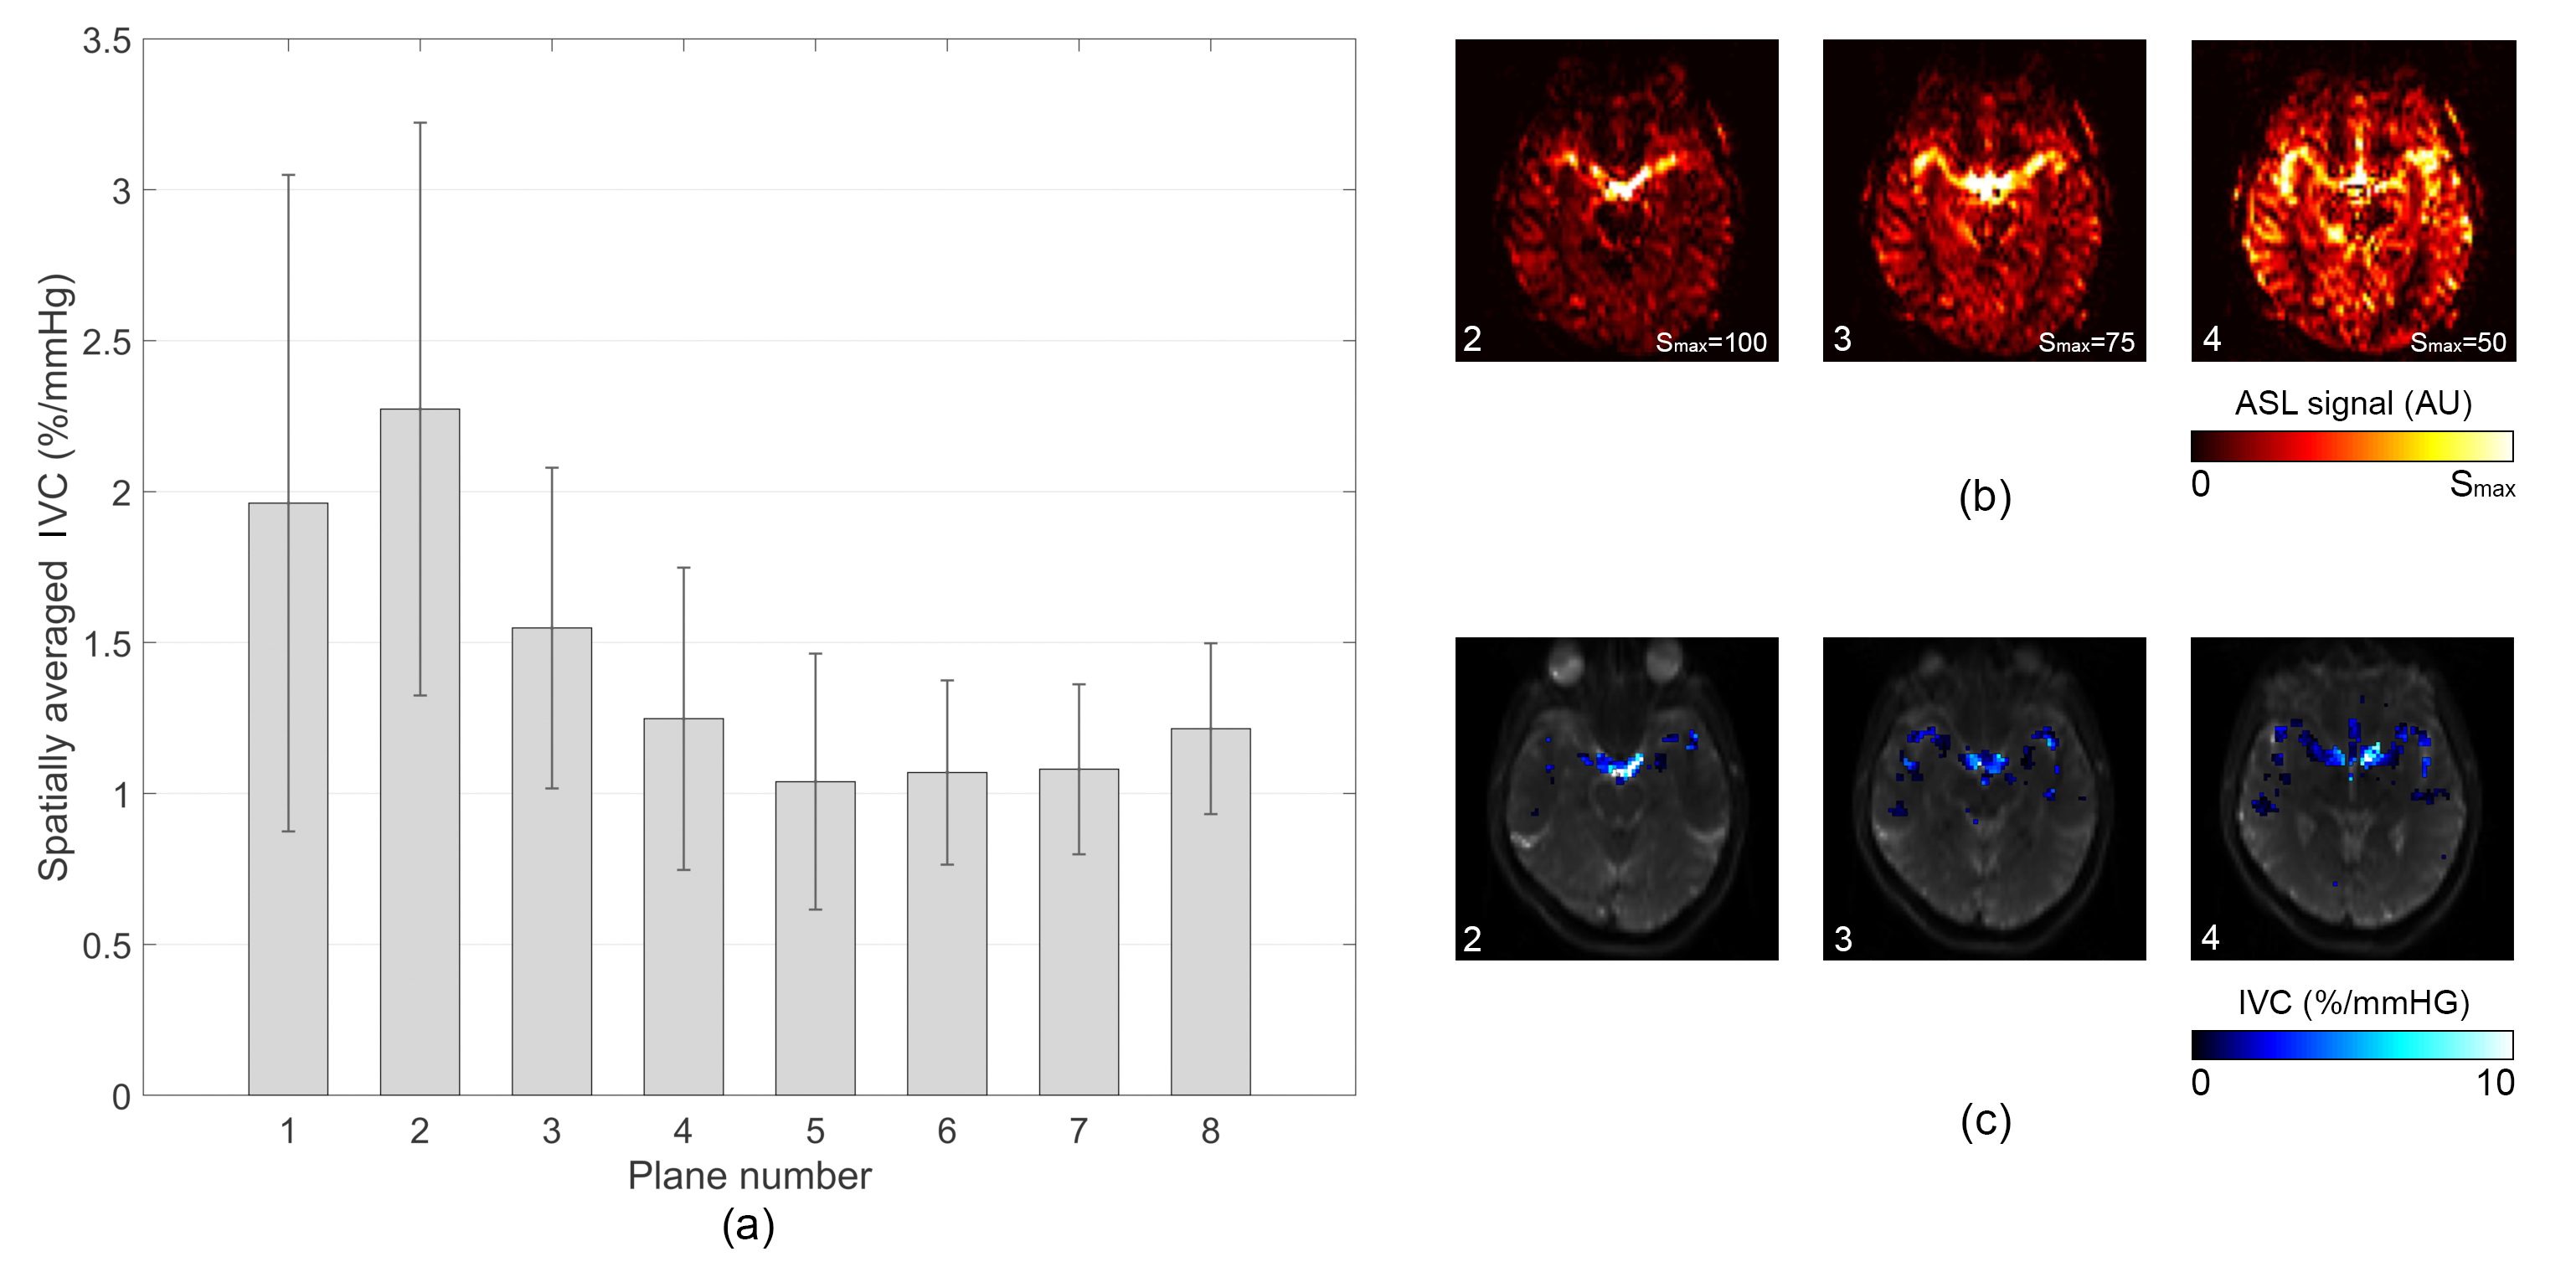
Spatially averaged IVC estimated in the current study, agreed well with previously reported values4. Voxel-wise aCBV and IVC maps demonstrated larger compliance values within the circle of Willis and its major branches compared to distal vessels (Figure 1d and 1e). Also, IVC values were reduced with the distance from the most caudal axial plane (Figure 3). The existence of larger arteries in areas with observed larger IVC indicates the impact of vessel size on vascular compliance as suggested in previous studies4,5.
Conclusion
In this pilot study, we demonstrated the feasibility of the proposed retrospectively-gated multi-PLD pCASL technique to quantify cardiac-induced aCBV variation and IVC in cerebral arteries which have the potential to be used as biomarkers to study various neurological disorders.Acknowledgements
This work is supported by grants of NIH K25AG056594 and AHA16SDG29630013.References
1. Kelly, B.A. & Chowienczyk, P. Vascular compliance. An Introduction to Vascular Biology: From Basic Science to Clinical Practice. Cambridge University, UK, 33-48 (2002).
2. Hughes, T.M., Craft, S. & Lopez, O.L. Review of ‘the potential role of arterial stiffness in the pathogenesis of Alzheimer's disease’. Neurodegenerative disease management 5, 121-135 (2015).
3. Saji, N., Toba, K. & Sakurai, T. Cerebral small vessel disease and arterial stiffness: tsunami effect in the brain. Pulse 3, 182-189 (2015).
4. Warnert, E.A., Murphy, K., Hall, J.E. & Wise, R.G. Noninvasive assessment of arterial compliance of human cerebral arteries with short inversion time arterial spin labeling. Journal of Cerebral Blood Flow & Metabolism 35, 461-468 (2015).
5. Yan, L., et al. Assessing intracranial vascular compliance using dynamic arterial spin labeling. NeuroImage 124, 433-441 (2016).
6. Jahanian, H., Peltier, S., Noll, D.C. & Hernandez Garcia, L. Arterial cerebral blood volume–weighted functional MRI using pseudocontinuous arterial spin tagging (AVAST). Magnetic resonance in medicine 73, 1053-1064 (2015).
7. Kim, K.H., Choi, S.H. & Park, S.-H. Feasibility of quantifying arterial cerebral blood volume using multiphase alternate ascending/descending directional navigation (ALADDIN). PloS one 11, e0156687 (2016).
8. Verbree, J. & van Osch, M.J. Influence of the cardiac cycle on pCASL: cardiac triggering of the end-of-labeling. Magnetic Resonance Materials in Physics, Biology and Medicine 31, 223-233 (2018).
Figures