4948
Influence of labeling parameters of velocity selective arterial spin labeling for renal perfusion imaging1Center for Image Sciences, University Medical Center Utrecht, Utrecht, Netherlands, 2C.J.Gorter Center for High Field MRI, Leiden University Medical Center, Leiden, Netherlands, 3Department of Radiology, University Medical Center Utrecht, Utrecht, Netherlands
Synopsis
Velocity selective arterial spin labeling (VSASL) is a spatially non-selective method that labels spins based on their flow velocity, thereby labeling closer to the target tissue, reducing the influence of arterial transit time (ATT) and requiring no planning. In the abdomen, motion and complex vascular anatomy might, however, require dedicated VS-labeling parameters. We assessed the feasibility of VSASL for renal perfusion measurement by investigating its dependency on essential labeling parameters, and by comparing it with pseudo-continuous ASL (pCASL) as a spatially-selective reference ASL-technique. Our results show, that with carefully chosen sequence parameters, VSASL is feasible for renal perfusion measurement.
Introduction
Velocity selective arterial spin labeling (VSASL)1 labels spins based on their flow velocity, thereby also labeling in the imaging plane, thus reducing arterial transit time (ATT) artifacts. Moreover, VSASL does not require planning of a labeling slab, making it highly attractive for abdominal perfusion measurements, where planning might be challenging due to complex (vascular) anatomy. However, limited work has been done studying the application of VSASL in the abdomen. In this study, the dependency of renal VSASL on essential labeling parameters is assessed and its sensitivity to renal perfusion evaluated by comparison with renal pseudo-continuous ASL (pCASL).Methods
Imaging: Kidneys of 15
volunteers (age 23-38, 6 men) were scanned on a 1.5T MRI (Ingenia, Philips, The
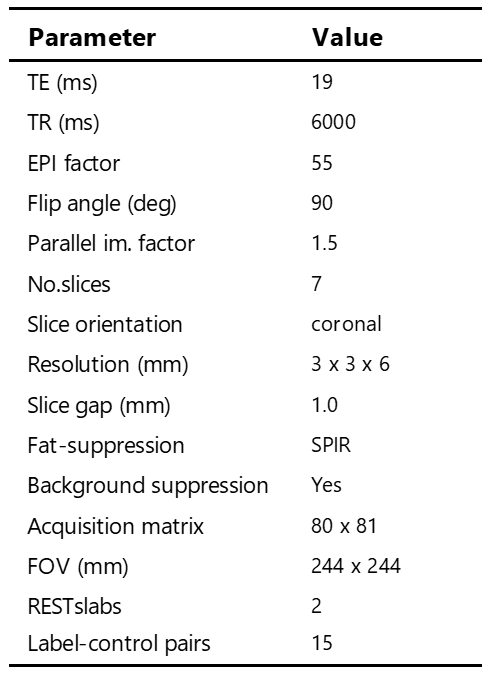
Netherlands) using a 28-element phased-array receiver-coil. Seven
angulated coronal slices were acquired with a gradient echo EPI readout (Table 1)
using VSASL2 and pCASL3 (1500ms label duration and PLD), including 10
label-control pairs. This
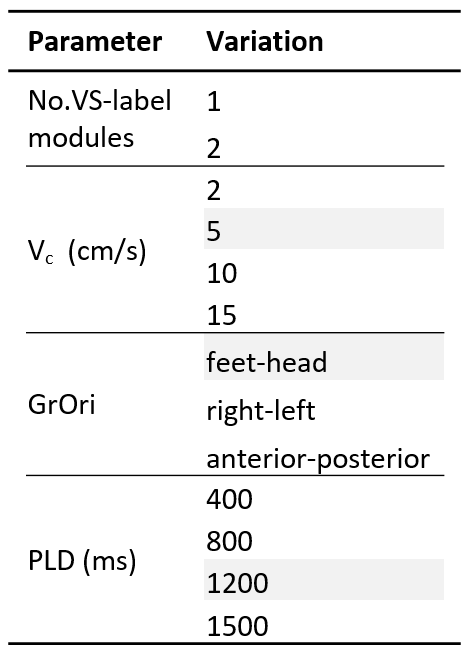
study focused on the following VSASL parameters (Table 2): VS-labeling
mode (single (s)VSASL and dual (d)VSASL), labeling
cut-off velocity (Vc), labeling
gradient orientation (GrOri), post-labeling
delay (PLD).
Experiments: Based on pilot experiments, a
baseline scan was defined (Vc=5cm/s, GrOri=FH, PLD=1200ms). For each
of the parameters Vc, GrOri and PLD, 5 subjects were scanned in which the
parameter was systematically varied, for both sVSASL and dVSASL labeling (Table 2). Additionally,
baseline-VSASL, pCASL and an M0 equilibrium image were acquired in all
volunteers. ASL scans included background suppression.
Analysis:
Images
were aligned using Elastix4, for each kidney separately. The influence of
labeling parameters on VSASL was
assessed by calculating the perfusion-weighted signal (PWS=ΔM/M0×100%) and voxel-wise
temporal SNR (tSNR) and were reported as a function of Vc, GrOri and
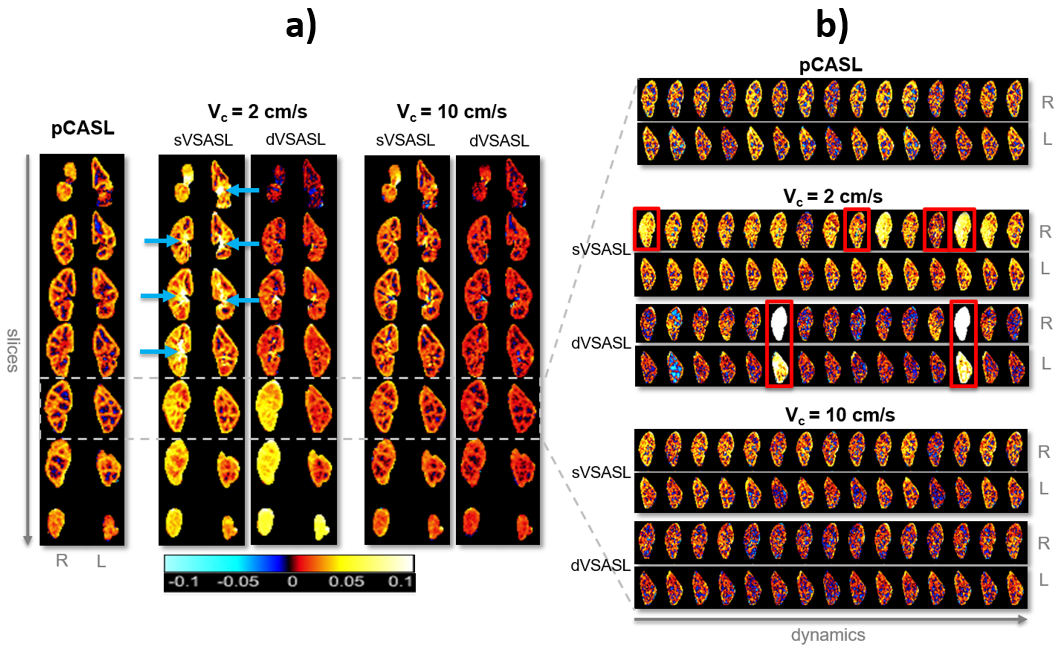
PLD. Occurrence of subtraction artifacts (spurious labeling) was visually assessed
per dynamic for scans with varying Vc, recognizable by homogeneously
high ΔM over the entire kidney. In addition, sensitivity to perfusion signal of
VSASL (baseline-settings)
was evaluated by PWS comparison with pCASL at the subject level, established by
the Pearson correlation-coefficient.
Results
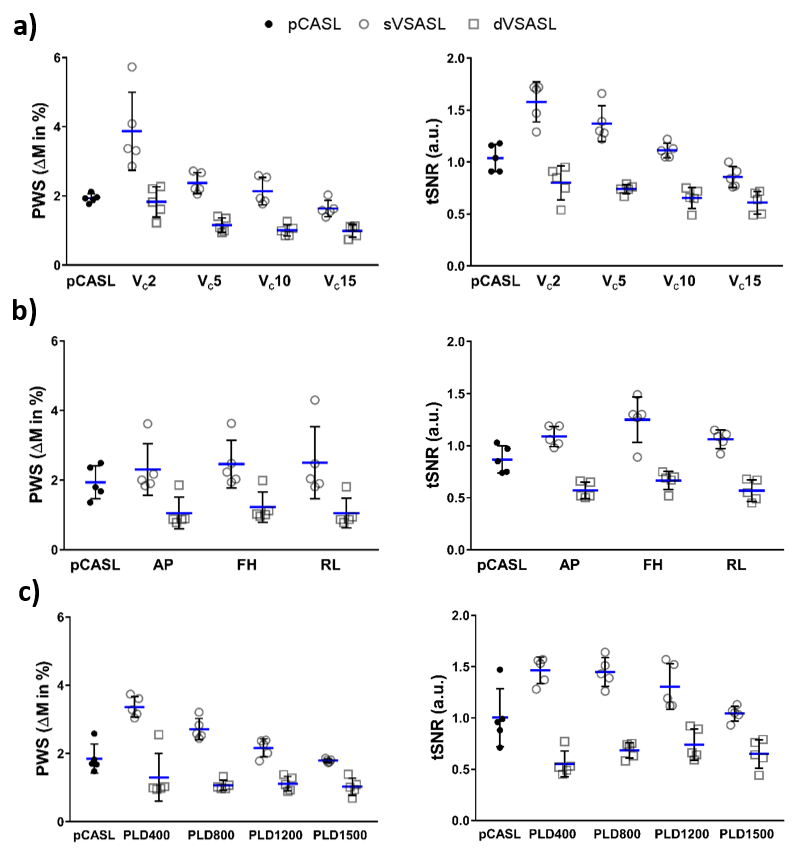
With decreasing Vc, PWS and tSNR increased for both single- and dual-VSASL (Figure 1a). However, at low Vc(≤5cm/s), subtraction artefacts became evident (Figure 2) for 19%/28% (left/right kidney) of the label-control pairs with Vc=2cm/s and 5%/3% with Vc=5cm/s.GrOri had no effect on PWS for either sVSASL or dVSASL (Figure 1b). tSNR was slightly affected by the orientation, with labeling in FH direction yielding highest tSNR.
Increasing PLD resulted in a PWS decrease for sVSASL, while for dVSASL this effect was considerably smaller (Figure 1c). Nevertheless, for short PLDs(≤800ms), especially for sVSASL, high PWS appeared in the center of the kidneys. Highest tSNR for dVSASL was found using a PLD of 1200ms, while for sVSASL it occurred at shorter PLDs(≤800ms).
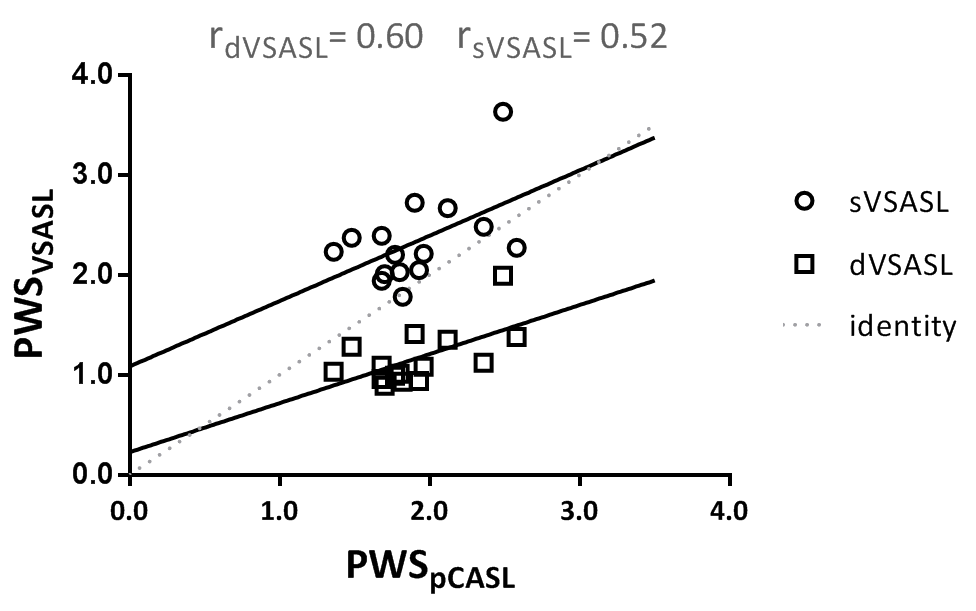
Overall, dVSASL yielded consistently lower PWS and tSNR than sVSASL (Figure 1). When correlating the PWS per volunteer, measured with baseline-VSASL to the reference technique pCASL, dVSASL showed a stronger correlation than sVSASL with r=0.60 and r=0.52, respectively, with an offset present for sVSASL (Figure 3).
Discussion & Conclusions
Results showed that renal VSASL is dependent on the Vc and PLD, but is relatively stable for different gradient orientations. Subtraction artefacts were observed with Vc≤5cm/s, likely caused by respiration-induced motion during VS-labeling.1,5In this study, both dual and single VSASL were studied. dVSASL does not only allow quantification by creating a fixed temporal label width, but also eliminates venous signal. However, sVSASL is the fundamental building-block determining the amount of label created. Signal enhancement of sVSASL in the center of kidneys at short PLDs(<800ms) and the offset when compared with pCASL, were probably caused by venous signal since both were eliminated when using dVSASL6.
A good correlation between dVSASL and pCASL was found, especially when taking into account that the ASL-data was not quantified yet. Compared to dVSASL, pCASL will aggregate more label in the target tissue due to the 1500ms label duration. Moreover, the second module in dVSASL will also crush part of the arterial signal. These aspects make quantification necessary for fair comparison, as it takes T1 differences of tissue and blood as well as label input functions into account.
Our results show, that with carefully chosen sequence parameters, challenges such as subtraction artefacts and high signal from the venous side can be accounted for. In conclusion, (d)VSASL is feasible for renal perfusion measurement, offering a planning-free, non-invasive technique which is less dependent on altered ATT, such as found in elderly and tumor patients.
Acknowledgements
This work is part of the research program Applied and Engineering Sciences with project number 14951 which is (partly) financed by the Netherlands Organization for Scientific Research (NWO). We thank MeVis Medical Solutions AG (Bremen, Germany) for providing MeVisLab medical image processing and visualization environment, which was used for image analysis.References
1. Wong EC, Cronin M, Wu WC,
Inglis B, Frank LR, Liu TT. Velocity-selective arterial spin labeling. Magn
Reson Med. 2006;55(6):1334-1341.
2. Schmid S, Ghariq E, Teeuwisse WM, Webb A,
Van Osch MJP. Acceleration-selective arterial spin labeling. Magn Reson Med.
2014;71(1):191-199.
3. Dai W, Garcia D, De Bazelaire C, Alsop
DC. Continuous flow-driven inversion for arterial spin labeling using pulsed
radio frequency and gradient fields. Magn Reson Med.
2008;60(6):1488-1497.
4. Klein S, Staring M, Murphy K, Viergever
MA, Pluim JPW. elastix : A Toolbox for Intensity-Based Medical Image
Registration. 2010;29(1):196-205.
5. Jao TR, Nayak KS. Demonstration of
velocity selective myocardial arterial spin labeling perfusion imaging in
humans. Magn Reson Med.
2018;80(1):272-278.
6.Duhamel G, De Bazelaire C, Alsop
DC. Evaluation of systematic quantification errors in
velocity-selective arterial spin labeling of the brain. Magn Reson Med.
2003;50(1):145-153.
7.Schmid S, Heijtel DFR, Mutsaerts HJMM, et
al. Comparison of velocity- and acceleration-selective arterial spin labeling
with [15O]H2O positron emission tomography. J Cereb Blood Flow Metab.
2015;35(8):1296-1303.
Figures