4946
Robust arterial transit time estimation using combined acquisition of Hadamard-encoded pCASL and long-labeled long-delay pCASL: a simulation and in vivo study1Radiological Center, University of Fukui Hospital, Yoshida-gun, Japan, 2Division of Health Sciences, Graduate School of Medical Sciences, Kanazawa University, Kanazawa, Japan, 3Department of Radiology, Faculty of Medical Sciences, University of Fukui, Yoshida-gun, Japan, 4MR applications and Workflow, GE Healthcare Japan, Hino, Japan, 5Department of Medical Imaging, Faculty of Life Sciences, Kumamoto University, Kumamoto, Japan, 6Division of Ultrahigh Field MRI, Institute for Biomedical Science, Iwate Medical University, Shiwa-gun, Japan, 7MR Applications and Workflow, GE Healthcare, Calgary, AB, Canada
Synopsis
A combination scan of 3-delay Hadamard-encoded pseudo-continuous ASL (H-pCASL) and single-delay pCASL with long labeling duration and long post-labeling delay was proposed as the robust arterial transit time (ATT) estimation for prolonged ATTs. Simulation showed that the mean normalized error of the proposed method was small for a wide range of ATTs compared to that of H-pCASL alone. In in vivo experiments, ATTs were not significantly different among the methods. However, 7-delay H-pCASL presented a lower ATT and larger variance. The proposed method improves the robustness of ATT estimation for prolonged ATTs with practical acquisition times in the clinical framework.
Introduction
Hadamard-encoded pseudo-continuous arterial spin labeling (H-pCASL), which simultaneously obtains high-resolution arterial transit time (ATT) maps and volumetric perfusion-weighted images, is a time-efficient technique with high signal-to-noise ratio (SNR) for multiple delay acquisitions.1 Despite the improvement in SNR with H-pCASL, short sub-bolus labeling durations (LDs) due to the large number of delays (7 or more) could lead to considerably low SNR of each sub-bolus perfusion image. This is emphasized in patients with cerebrovascular diseases and elderly cohort, which present longer ATTs and/or lower cerebral blood flow (CBF).2,3 Furthermore, the 7 or more delays with H-pCASL are not feasible in the clinical framework due to long scan times. While H-pCASL is inherently sensitive to motion, the large encoding steps make it more vulnerable to motion artifacts. These disadvantages inhibit the clinical use of H-pCASL with the large number of delays. Therefore, the purpose of the present study was to propose a reasonable scan strategy for H-pCASL for prolonged ATTs, and we performed Monte Carlo simulation and in vivo experiments.Materials and Methods
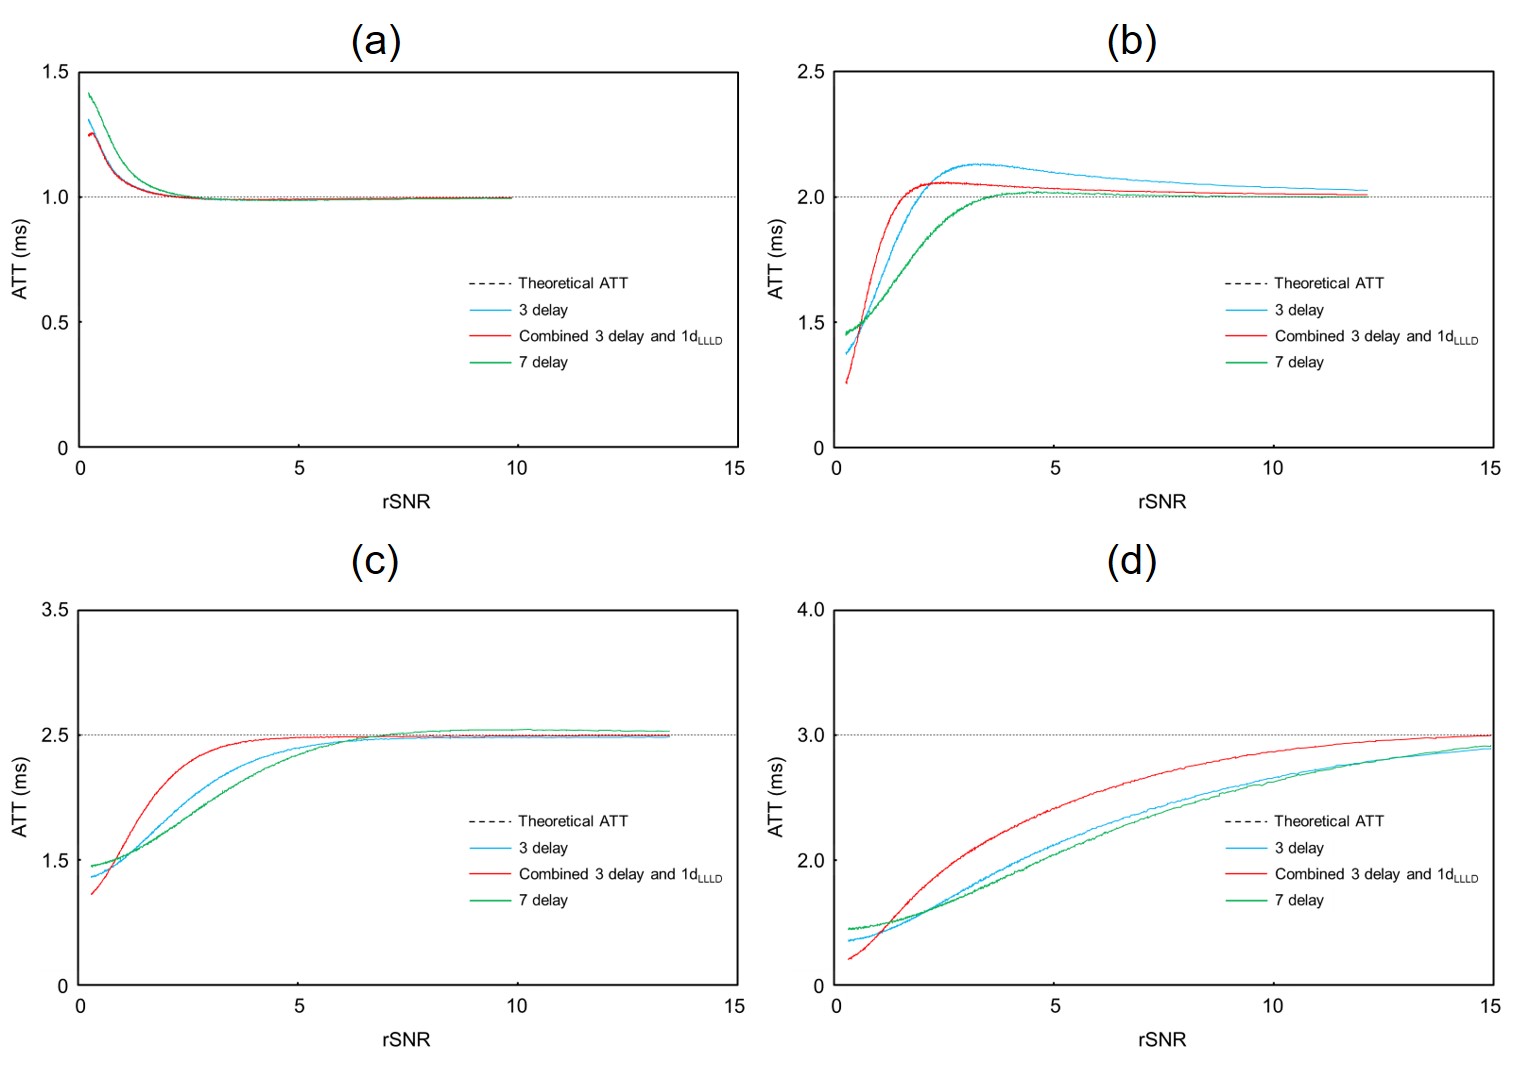
Simulation was performed with 240 patterns of hemodynamic conditions. The CBF and ATT were set at 10–100 mL/min/100 g and 0.7–3.0 s, respectively. Gaussian noise with 100 levels of standard deviation (SD) was applied to the theoretical ASL signal of each sub-bolus using a single-compartment model.4 Relative SNR (rSNR) was defined as the theoretical ASL signal intensity divided by the SD of generated noise. The theoretical ASL signal intensity was calculated with respect to each hemodynamic condition using 4000 ms LD and 3000 ms post-labeling delay (PLD). The ATT was calculated using a signal-weighted delay (WD) method4 and compared to the theoretical values. These calculations were repeated 50000 times.
Seventeen healthy volunteers (n = 17, 33.2 ± 14.6 years old) were scanned on a 3.0 T magnetic resonance imaging unit (Discovery 750, GE Healthcare) with a 32-channel head array coil under institutional review board approval. H-pCASL was performed with an LD of 4000 ms, PLD of 700 ms, 3 and 7 delays (3d and 7d), repetition time of 6225 ms, echo time of 10.5 ms, field of view of 240 mm, 512 points with 6 interleaves, and 1 signal average. Based on Hadamard-encoded acquisition, a long-labeled short-delay perfusion image (1dLLSD) was also calculated. In addition, single-delay pCASL with a long LD (4000 ms) and long PLD (3000 ms) was acquired (1dLLLD). The scan times were 3 min 23 s, 5 min 54 s, and 1 min 58 s for 3d, 7d, and 1dLLLD, respectively. We combined two series of ASL acquisition (3d H-pCASL including 1dLLSD and 1dLLLD) to compute ATTs using the WD method.4
All ATT maps were spatially normalized to the Montreal Neurological Institute-space template using SPM12.5 The volumes of interest in the anterior, middle, and posterior cerebral artery territories were automatically delineated using a vascular territory atlas template.6
For ATT accuracy comparison, 3d H-pCASL, 7d H-pCASL, and the proposed method were compared in the simulation and in vivo experiment.
Results and Discussions
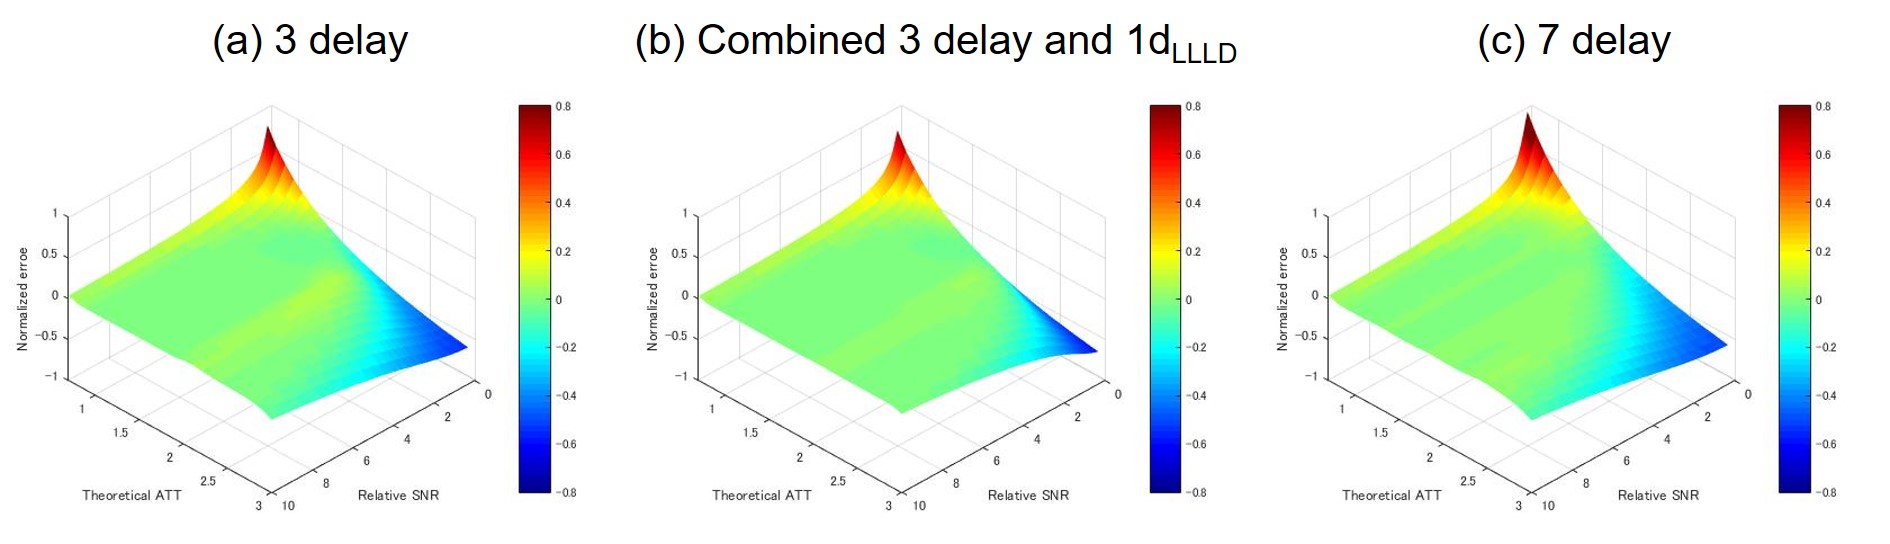
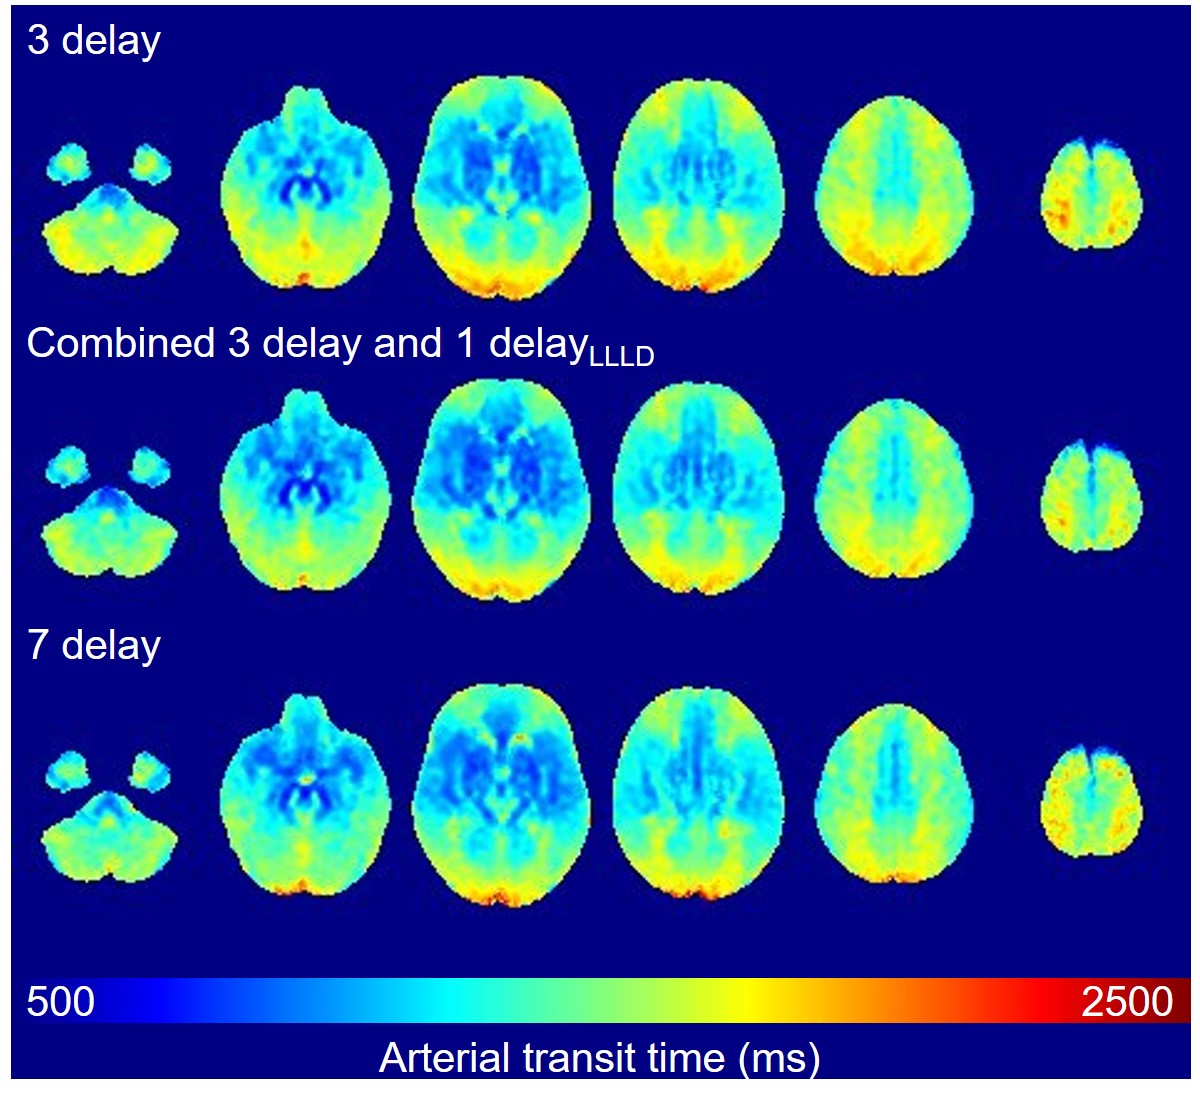
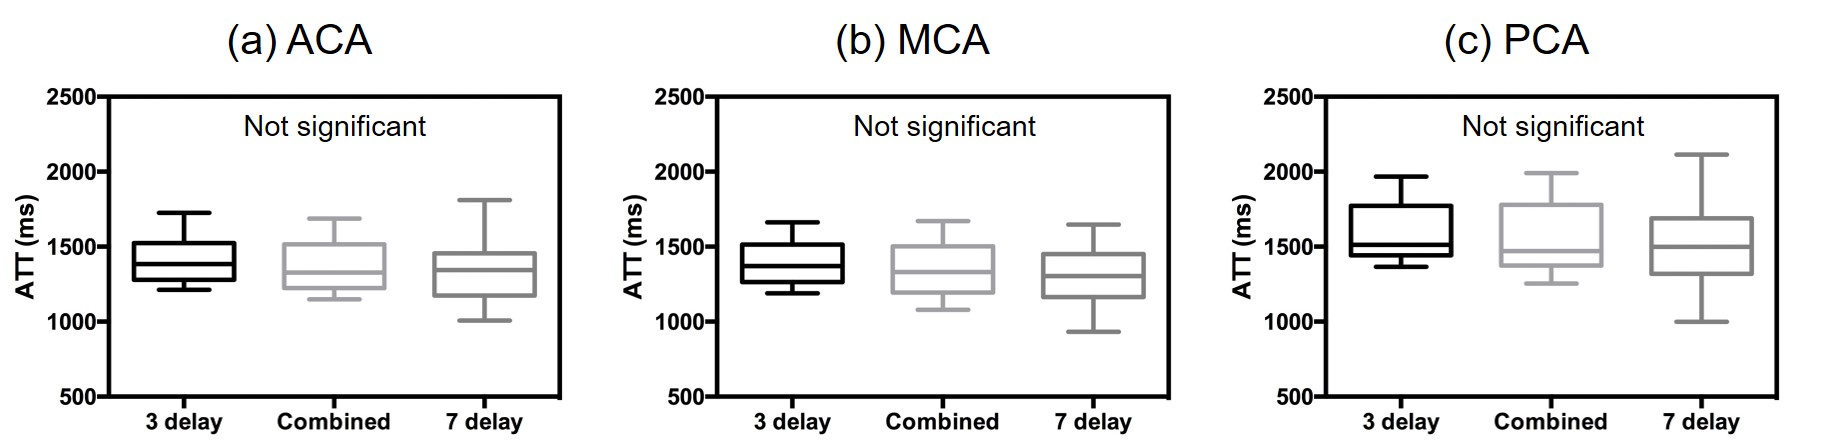
While the measurement accuracy of the ATT was not different among all the scan protocols under high rSNR conditions, the results of the simulation showed that the proposed method was the most robust in the low rSNR condition, especially with the prolonged ATT (>2.0 s) (Fig. 1 and 2). Moreover, the mean normalized error of the combined method was small for a wide range of ATTs under low rSNR conditions (Fig. 2). The results of the simulation showed that the combined acquisition makes it more robust to obtain ATTs compared to H-pCASL alone. This indicates that acquiring the large number of delays with short LD, i.e. low SNR, is not beneficial for the robustness of ATT estimation. Moreover, the total scan time of the combined method (5 min 21 s) was shorter than that of 7d H-pCASL (5 min 54 s). In in vivo experiments, ATTs were not significantly different among the different scan protocols (Fig. 3 and 4). However, 7d H-pCASL tends to present a lower ATT and larger variance compared to those in the others in all vascular territories (Fig. 4), attributing to low SNR of short LD perfusion images. The proposed method could be applied to cases of prolonged ATTs in the clinical setting.Coclusion
A combination scan of 3-delay encoded H-pCASL and single-delay pCASL with a long LD and long PLD confers robust ATT estimation for prolonged ATT with a practical acquisition time in the clinical framework.Acknowledgements
No acknowledgement found.References
1. Dai, W, Shankaranarayanan A, Alsop DC. Volumetric measurement of perfusion and arterial transit delay using hadamard encoded continuous arterial spin labeling. Magn Reson Med. 2013; 69 (4): 1014–1022.
2. Tsujikawa T, Kimura H, Matsuda T, et al. Arterial transit time mapping obtained by pulsed continuous 3D ASL imaging with multiple post-label delay acquisitions: Comparative study with PET-CBF in patients with chronic occlusive cerebrovascular disease. PLoS One. 2016; 11 (6): e0156005.
3. Fujiwara Y, Matsuda T, Kanamoto M, et al. Comparison of long-labeled pseudo-continuous arterial spin labeling (ASL) features between young and elderly adults: special reference to parameter selection. Acta Radiol. 2017; 58 (1): 84–90.
4. Dai W, Robson PM., Shankaranarayanan A, et al. Reduced resolution transit delay prescan for quantitative continuous arterial spin labeling perfusion imaging. Magn Reson Med. 2012; 67 (5), 1252–1265.
5. Ashburner J, Friston KJ. Voxel-based morphometry—the methods. Neuroimage. 2000; 11:805-521.
6. Mutsaerts HJ, van Dalen JW, Heijtel DF, et al. Cerebral perfusion measurements in elderly with hypertension using arterial spin labeling. PLoS One. 2015; 10 (8): e0133717.
Figures