4944
Cerebral spin compartmentalization based on biexponential modeling of T2-prepared pCASL 3D GRASE data1Department of Epileptology, University of Bonn Medical Center, Bonn, Germany, 2German Center for Neurodegenerative Diseases (DZNE), Bonn, Germany, 3Department of Physics and Astronomy, University of Bonn, Bonn, Germany
Synopsis
In this work, a pCASL sequence with T2 preparation module and 3D GRASE readout was developed. We present a novel approach to estimate the spin compartment of labeled protons by a voxel-wise and biexponential fit to whole-brain ASL data. This method allows for the spatial quantification of intra- and extravascular spin fractions of the ASL signal as well as their temporal evolution.
Purpose
T2 relaxation times can be used to distinguish between intravascular and extravascular spin compartments of labeled blood 1,2. This differentiation is clinically desirable for testing blood-brain barrier (BBB) permeabilities in basic neuroscience, epileptology and neurooncology 3. The combination of a T2 preparation and a pCASL labeling with 3D GRASE readout allows for acquisition of T2 and perfusion weighted images 4.
The aim of this project is to find an analytical approach to localize the labeled protons. In this work, we demonstrate that it is possible to quantify their fractions in the respective compartment by modeling T2 weighted ASL data with a biexponential decay for each inversion time. This method relies on T2 relaxation times of venous blood and gray matter (GM) which were estimated from the data.
Methods
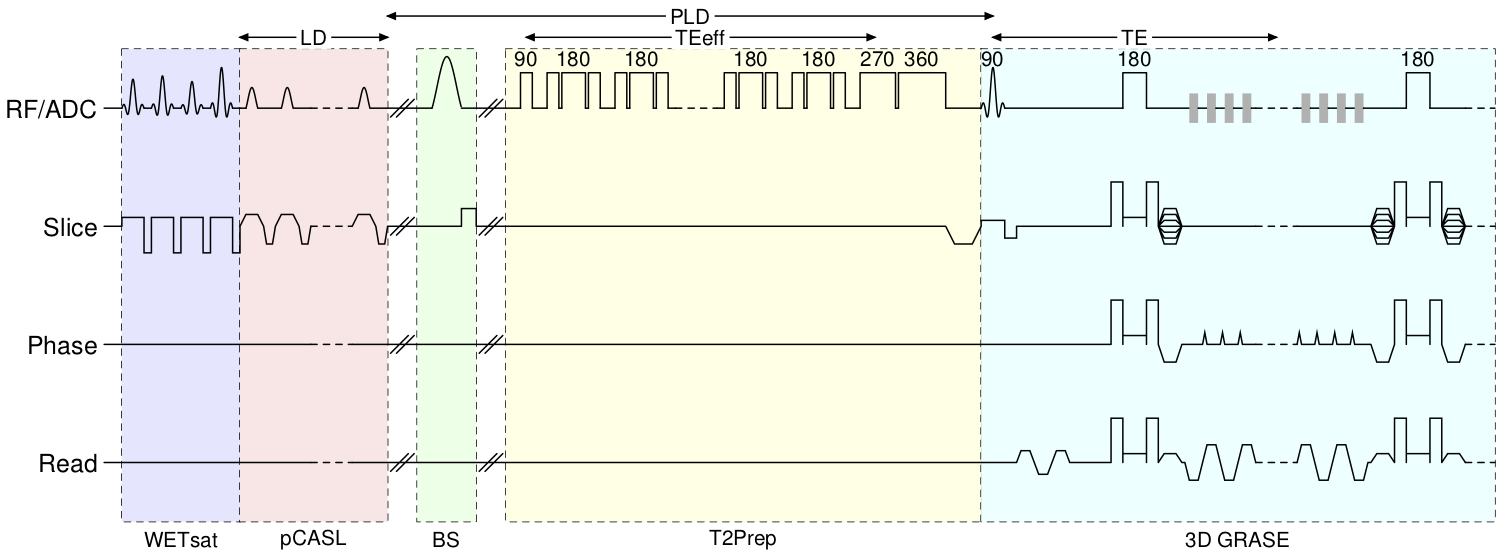
The pulse sequence (Fig. 1) consists of pCASL labeling followed by a post labeling delay and a T2 preparation of variable length immediately before data acquisition. Utilizing composite pulses in the preparation module and by arranging them in a MLEV cycling scheme, possible off-resonance effects get reduced and B1 imperfections are compensated 4. In order to improve SNR, static tissue and associated physiological noise are suppressed by a WET pre-saturation with 4 pulses before labeling and 3 background suppression (BS) pulses (HSN) prior to T2 preparation. In the case of an overlap the labeling is interrupted for the duration of the BS pulse 3,5. Fat saturation was applied between the T2 preparation module and the 3D GRASE readout.
Experiments were performed on a MAGNETOM TRIO 3T scanner (Siemens Healthineers, Erlangen, Germany) utilizing a 32-channel head receive coil. Sequence settings are summarized in Figure 2. All measurements were conducted with a healthy volunteer.
Online reconstructed data were distortion corrected, pairwise subtracted and averaged to mean perfusion weighted images (SASL=(Mcontrol-Mtag)/M0) per TI and TEeff. Voxel-wise T2 values were then estimated by a monoexponential fit along TEeff: SASL(TI,TEeff)=SASL(TI)·e-TEeff/T2. In this context a non-linear least squares algorithm and the python function curve_fit from the Scipy.Optimize library were utilized. Next, a GM ROI was generated based on the perfusion weighted data. For this purpose, voxels were included which in the histogram of the longest inversion time were at least equal to the peak value of the distribution curve 1. The resulting ROI was applied to the T2 map for mean GM-T2 calculation. Similarly, vessel ROI and vessel-T2 were obtained considering data at the shortest TI and including upper 5% of the cumulative histogram data to ROI.
In the next step, online reconstructed raw data were calibrated and arterial transit times (ATT) estimated using FSL’s functions oxford_asl and fsl_anat supplying the structural T1 scan. Thus, created native space GM masks were then applied to mean perfusion weighted ASL images. Resulting data was spatially smoothed using an isotropic Gaussian filter kernel with standard deviation of 2mm (FWHM=4.7mm) prior to voxel-wise biexponential least square fitting: SASL(TI,TEeff)=IVSASL(TI)·e-TEeff/vessel-T2+EVSASL(TI)·e-TEeff/GM-T2. The fit amplitudes IVSASL and EVSASL were not restricted or regularized. Hereby the first exponential decay represents the signal decrease in the intravascular and the second one in the extravascular space using the previously determined vessel- and GM-T2. Finally, the extravascular TI-dependent ASL signal fraction is given by EVSASL(TI)/(IVSASL(TI)+EVSASL(TI)).
Results
Perfusion weighted GM ASL images are shown in Figure 3. Mean T2 relaxation times are 110ms for vessels and 195ms for GM, being slightly higher than previously reported literature estimates (vessel-T2=90ms, GM-T2=175ms) 6. Fitted T2 relaxation times and GM spin compartment fractions are presented in Figure 4 for each inversion time as well as their corresponding histograms in Figure 5.
The initial peak GM signal proportion at the shortest TI=2.3s is 55%. It increases to 62% (TI=2.8s) until it reaches 72% for TI=3.3s. Extended arterial transit times in the occipital lobe result in compartment transitions that seem to be delayed in comparison to other regions (Fig. 4).
Discussion & Conclusion
A new method is presented to quantify intra- and extravascular spin fractions based on T2 weighted ASL data for multiple inversion times. Biexponential fitting of multi-TE and multi-TI pCASL data compartmentalizes the labeled spins. The decrease of ASL signal T2 relaxation time with increasing inversion time indicates that the labeled protons adopt GM-T2, which results in an increase of the extravascular signal fraction at longer resting times in cerebral structures. The long scan time of this proof-of-concept study is due to the high number of repetitions. Compartment determination does not require as many averages and the measurement can be further accelerated by using CAIPIRINHA.Acknowledgements
No acknowledgement found.References
1. Liu, P., Uh, J., & Lu, H. (2011). Determination of spin compartment in arterial spin labeling MRI. Magnetic Resonance in Medicine, 65(1), 120–127. https://doi.org/10.1002/mrm.22601
2. Wells, J. A., Siow, B., Lythgoe, M. F., & Thomas, D. L. (2013). Measuring biexponential transverse relaxation of the ASL signal at 9.4 T to estimate arterial oxygen saturation and the time of exchange of labeled blood water into cortical brain tissue. Journal of Cerebral Blood Flow and Metabolism, 33(2), 215–224. https://doi.org/10.1038/jcbfm.2012.156
3. Alsop, D. C., Detre, J. A., Golay, X., Günther, M., Hendrikse, J., Hernandez-Garcia, L., Zaharchuk, G. (2015). Recommended implementation of arterial spin-labeled Perfusion mri for clinical applications: A consensus of the ISMRM Perfusion Study group and the European consortium for ASL in dementia. Magnetic Resonance in Medicine, 73(1), 102–116. https://doi.org/10.1002/mrm.25197
4. Schmid, S., Teeuwisse, W. M., Lu, H., & van Osch, M. J. P. (2015). Time-efficient determination of spin compartments by time-encoded pCASL T2-relaxation-under-spin-tagging and its application in hemodynamic characterization of the cerebral border zones. NeuroImage, 123, 72–79. https://doi.org/10.1016/j.neuroimage.2015.08.025
5. Boland, M., Stirnberg, R., Pracht, E. D., Kramme, J., Viviani, R., Stingl, J., & Stöcker, T. (2018). Magnetic Resonance in Medicine Accelerated 3D-GRASE imaging improves quantitative multiple post labeling delay arterial spin labeling, (December 2017). https://doi.org/10.1002/mrm.27226
6. He, X., Raichle, M. E., & Yablonskiy, D. A. (2012). Transmembrane dynamics of water exchange in human brain. Magnetic Resonance in Medicine, 67(2), 562–571. https://doi.org/10.1002/mrm.2301
Figures