4943
Readout Duration-dependent Bias on R2* Mapping and Quantitative Susceptibility Mapping Using 3D Radial and Cones Acquisitions at 3.0T1Biomedical Engineering, Tsinghua University, Beijing, China, 2Radiology, University of Wisconsin, Madison, WI, United States, 3Biomedical Engineering, University of Wisconsin, Madison, WI, United States, 4Medical Physics, University of Wisconsin, Madison, WI, United States, 5Medicine, University of Wisconsin, Madison, WI, United States, 6Emergency Medicine, University of Wisconsin, Madison, WI, United States
Synopsis
Ultra-short TE (UTE) R2* mapping and Quantitative Susceptibility Mapping (QSM) are emerging techniques for quantifying iron deposition in various organs, including the brain and liver. In tissues with short T2* values (high R2*), the fast signal decay-induced errors during the relatively long readout in typical UTE acquisitions, i.e., 3D radial and cones UTE, may confound R2* and susceptibility measurements. In this study, we characterized the readout duration effects on R2* and susceptibility estimation in 3D radial and cones UTE-acquisitions at 3.0T. Simulation and phantom studies showed bias in the estimated R2* and susceptibility when long readout durations were used.
Introduction
R2* mapping and Quantitative Susceptibility Mapping (QSM) are emerging MRI-based techniques for quantifying iron concentration in organs such as the brain and liver, where excess iron deposition is associated with multiple diseases1. In the presence of very high tissue iron content, particularly in the liver, accurate measurements of R2* and susceptibility are challenging due to rapid signal decay. Ultra-short TE (UTE) techniques with non-Cartesian acquisitions (e.g., radial and cones trajectories) enable short echo times that are needed for accurate quantification of high iron concentrations2-4. However, 3D non-Cartesian acquisitions often use long readouts and signal evolution during the readout will introduce image artifacts (e.g., blurring), particularly in regions of high R2* and susceptibility. These artifacts may in turn confound R2* and B0 field-based susceptibility measurements. Thus, the purpose of this study was to characterize the effects of readout duration on R2* and susceptibility measurements in 3D radial and cones UTE-acquisitions at 3.0T.Methods
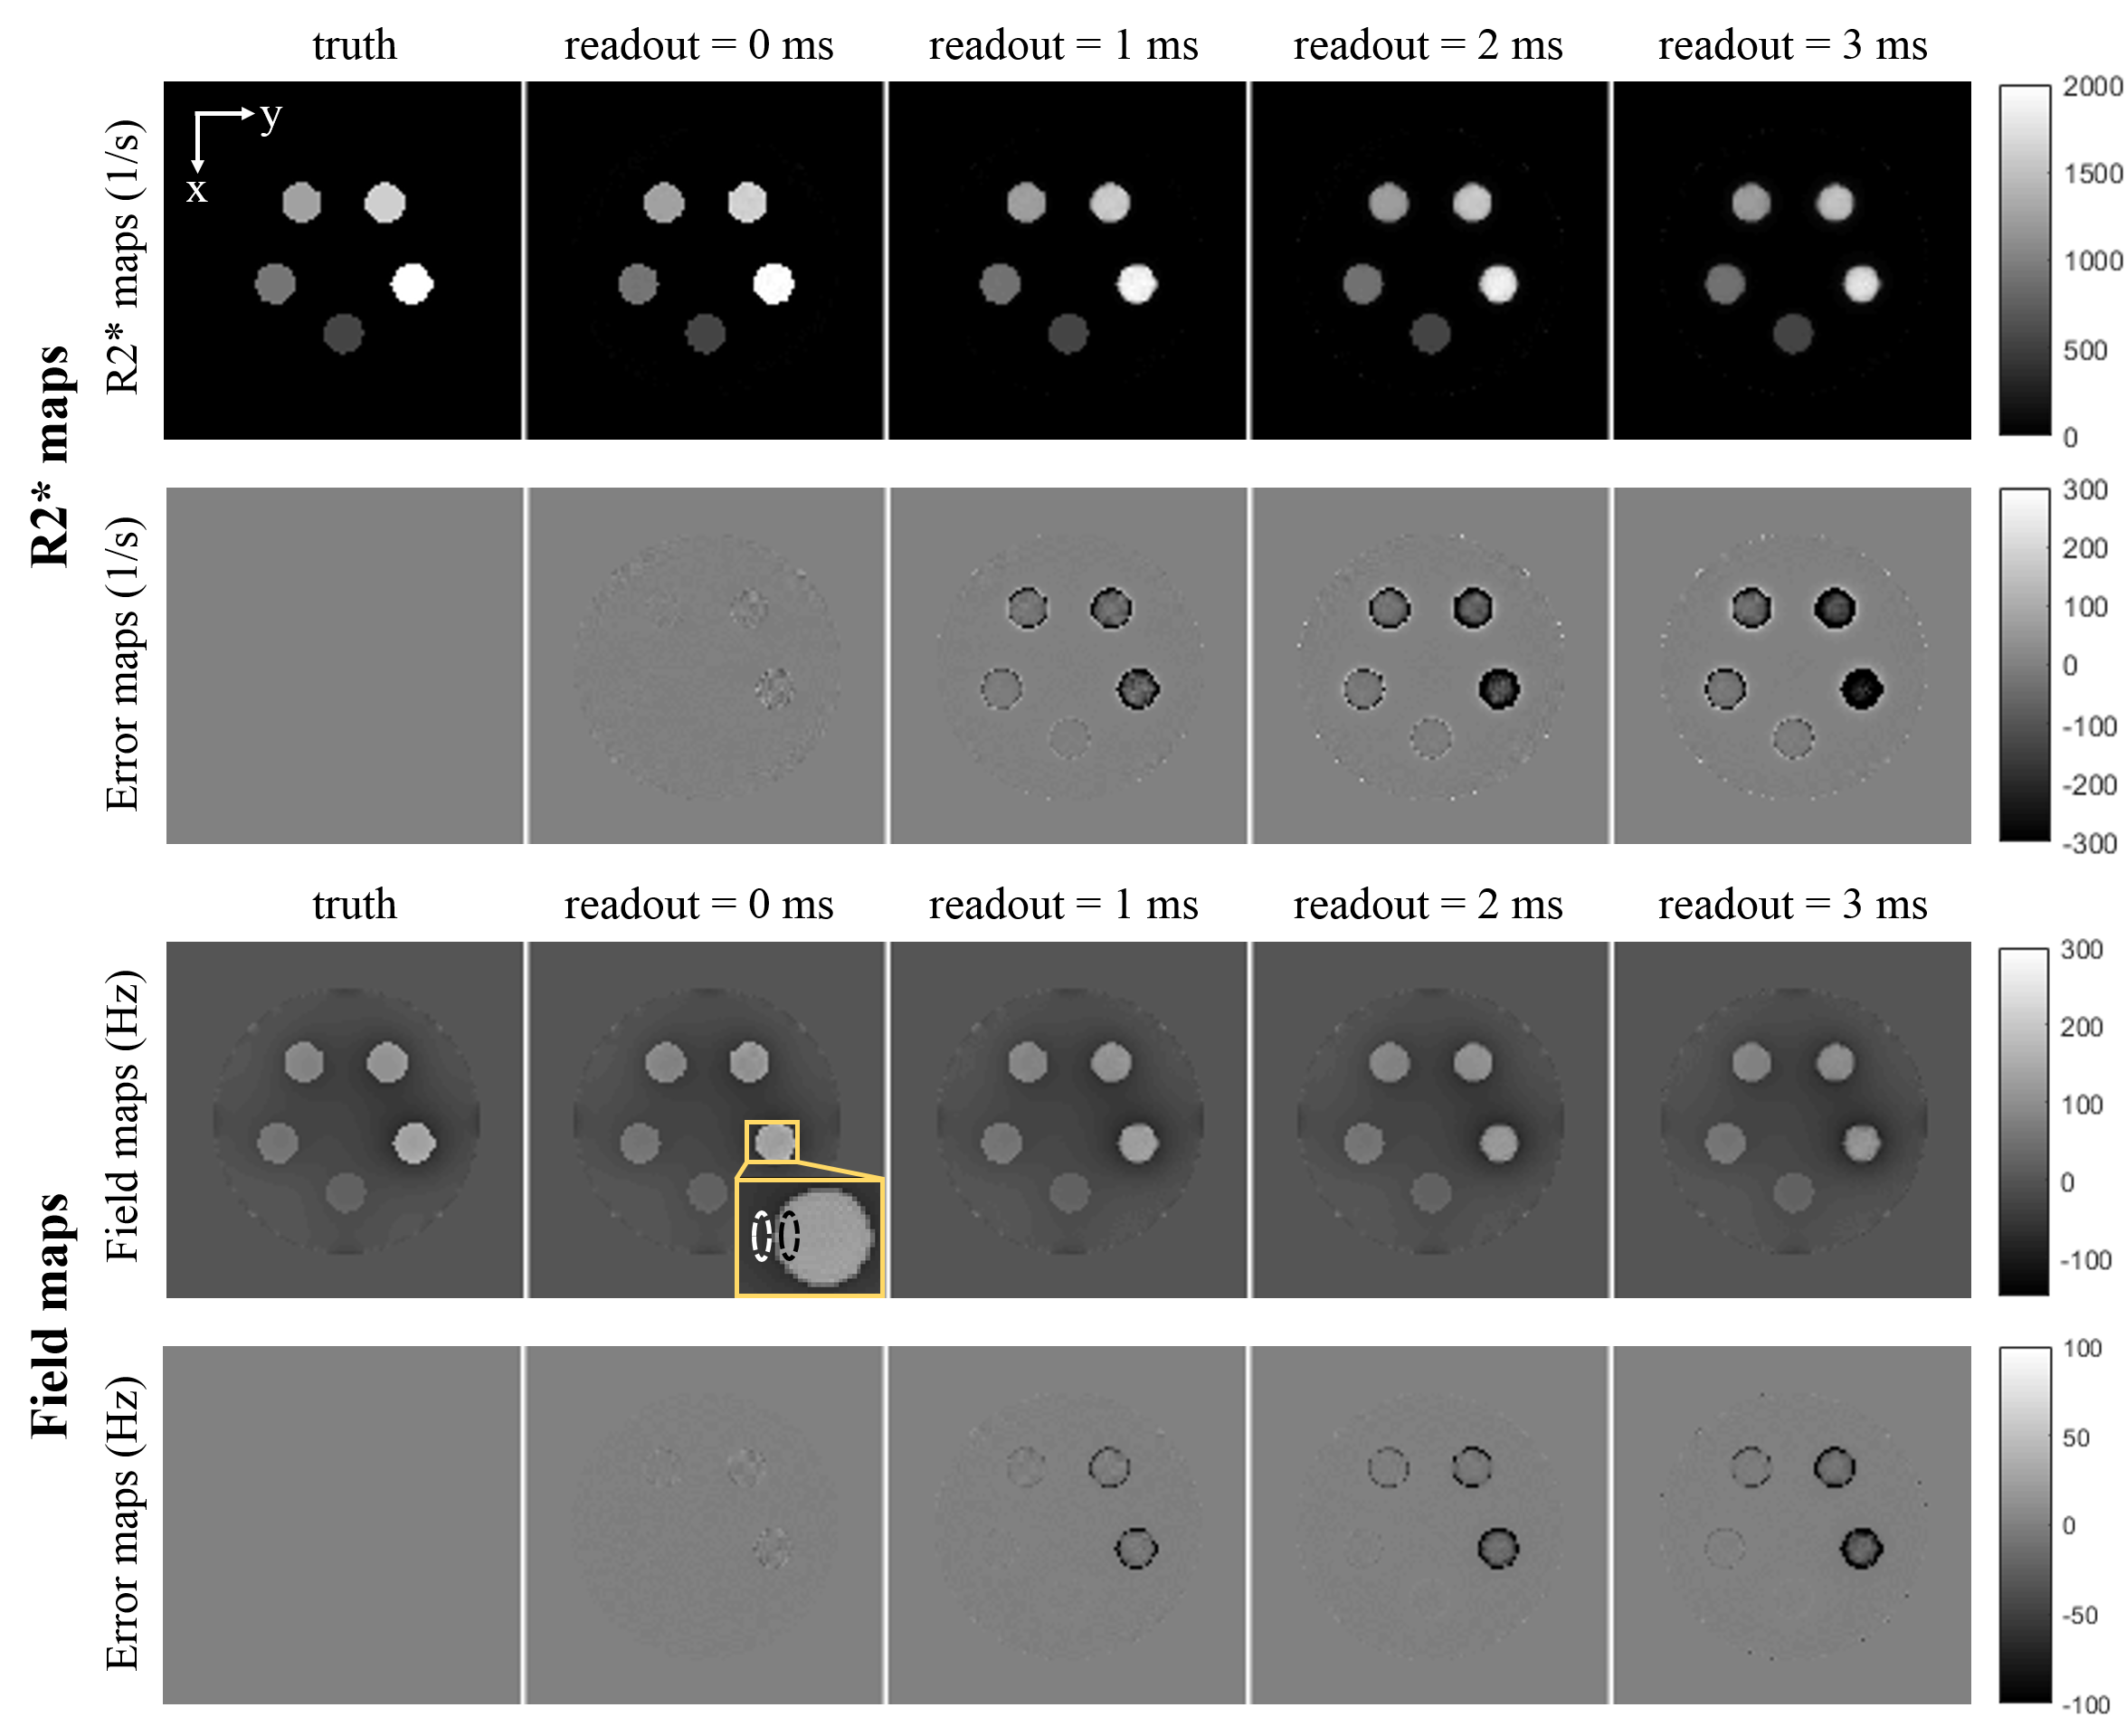
Simulation: A numerical phantom was created containing five vials with different R2* (550~1979s-1) and susceptibility values (1-5ppm), according to the reported values of iron-overloaded livers5. 3D images at six echo times with center-out radial and cones trajectories were simulated following the gradient-echo signal model6 including R2* signal decay and susceptibility related phase accumulation during readout duration. For each dataset of the multi-echo images, four readout durations of 0, 1, 2 and 3ms were used. Detailed phantom MRI properties are listed in Table 1.
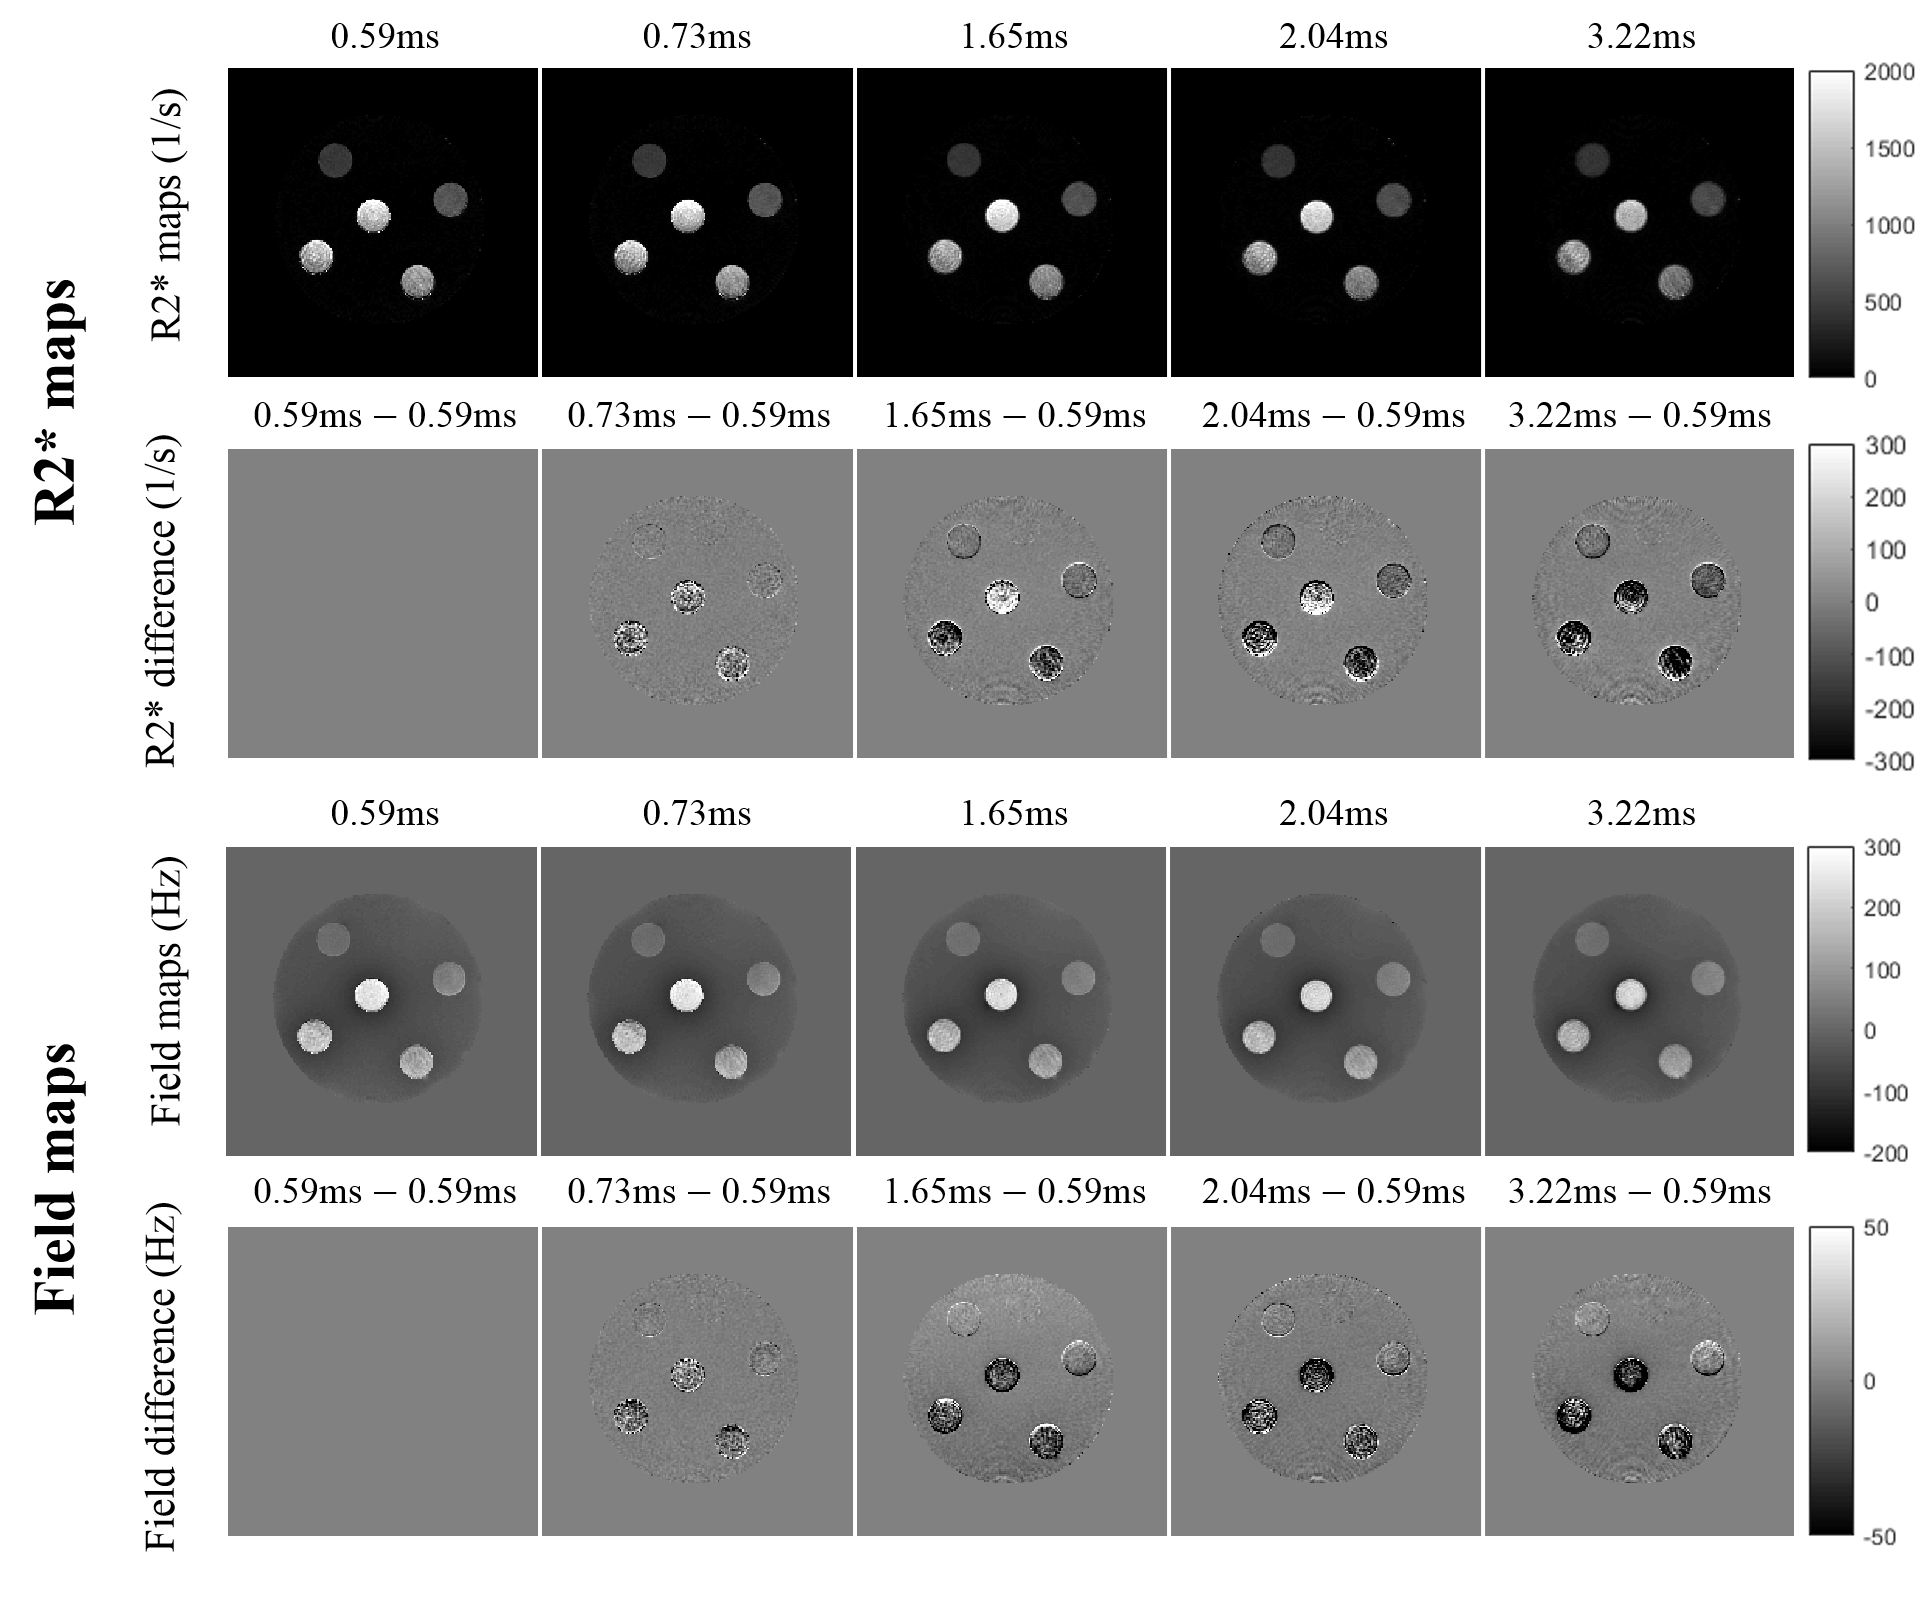
Phantom Study: The phantom consists of six vials placed in a MnCl2-doped water bath, including five vials of mixed CuSO4-MnCl2 solutions to obtain a range of R2* and susceptibility values similar to the reported ones in iron-overloaded livers5, and one deionized water vial as a susceptibility reference. Phantoms were imaged on a 3.0T scanner (Discovery MR750, GE Healthcare, Waukesha, WI). 3D center-out radial acquisitions with five different readout durations (3.22~0.59ms) were obtained by adjusting the readout bandwidth (15.63~125kHz, respectively). Six echoes (echo times=0.5~3.0ms) were acquired with each readout duration for R2* mapping and QSM. Phantom details and other MRI scan parameters are listed in Table 1.
Data Reconstruction and Analysis: R2* maps and field maps were reconstructed from each multi-echo dataset in simulation and phantom studies using a complex-fitting algorithm7. Background field removal was achieved by subtracting the field map of all vials assigned with water susceptibilities in simulation and using projection onto dipole fields (PDF)8 in phantom studies. Susceptibility maps were calculated using morphology enabled dipole inversion (MEDI)9-11. R2* and susceptibility were measured in a cylindrical region of interest (ROI) drawn in each vial, and the deionized water vial was used as the susceptibility reference. A boundary B0 field measurement ∆B0, which is directly proportional to susceptibility difference between two regions12, was measured as the field difference between ROIs inside and outside each vial near the boundary parallel to the main magnetic field.
Results
In simulation, increasing errors with longer readout durations were observed in R2* and field maps (Figure 1). There are biases in R2*, boundary B0 (∆B0) and susceptibility measurements with long readout durations for both the 3D radial and cones acquisitions (Figure 2). In the phantom study using radial acquisitions, differences in both R2* and B0 field (Figure 3) occur with long readout durations, compared to that with the shortest readout duration (i.e., 0.59ms, 1st column). Biases in R2*, ∆B0 and susceptibility estimations are shown in phantom study (Figure 4).Discussion and Conclusions
Our simulation and phantom studies consistently demonstrate that long readout duration leads to bias in R2* and susceptibility measurements in 3D radial and cones UTE-acquisitions, especially at high R2* and susceptibility values at 3.0T. Signal decay and phase accumulation during the readout introduce errors in R2* and field map estimations, and these errors propagate through the susceptibility reconstruction into final estimates of susceptibility. These findings may serve as a guide for the development of R2* mapping and QSM techniques based on non-Cartesian acquisitions, which are particularly promising in abdominal imaging applications due to their ability to provide short echo times and high motion robustness. This study had several limitations, including the lack of 3D cones acquisition in phantom study and in vivo study, and the potential geometry dependence of the observed bias. Additional phantom and in vivo studies are needed to fully characterize this effect.
In summary, this preliminary characterization provides insight into the bias in R2* mapping and QSM performed using non-Cartesian acquisitions.
Acknowledgements
The authors acknowledge support from the NIH (grants R01-DK117354, R01-DK100651, K24-DK102595, R01-DK083380, R01-DK088925, and U01-HD087216) as well as GE Healthcare who provides research support to the University of Wisconsin-Madison.References
1. Gordeuk VR, et al. Iron overload: causes and consequences. Ann Rev Nutr. 1987;7:485–508.
2. Doyle EK, et al. Ultra-short echo time images quantify high liver iron. Magn Reson Med. 2017;79(3): 1579-1585.
3. Krafft AJ, et al. Quantitative ultrashort echo time imaging for assessment of massive iron overload at 1.5 and 3 Tesla. Magn Reson Med. 2017;78(5): 1839-1851.
4. Tipirnenisajja A, et al. Radial Ultrashort TE Imaging Removes the Need for Breath-Holding in Hepatic Iron Overload Quantification by R2* MRI. Ajr Am J Roentgenol. 2017;209(1):187-194.
5. Sharma SD, et al. Quantitative susceptibility mapping in the abdomen as an imaging biomarker of hepatic iron overload. Magn Reson Med. 2015;74:673–683.
6. Haacke et al. Magnetic Resonance Imaging: Physical Principles and Sequence Design. New York: Wiley-Liss. 1999.
7. Hernando D, et al. Multipeak fat-corrected complex R2* relaxometry: theory, optimization, and clinical validation. Magn Reson Med. 2013;70:1319–1331.
8. Liu T, et al. A novel background field removal method for MRI using projection onto dipole fields (PDF). NMR Biomed. 2011;24:1129–1136.
9. De Rochefort L, et al. Quantitative susceptibility map reconstruction from MR phase data using Bayesian regularization: validation and application to brain imaging. Magn Reson Med. 2010;63:194–206.
10. Liu J, et al. Morphology enabled dipole inversion for quantitative susceptibility mapping using structural consistency between the magnitude image and the susceptibility map. Neuroimage. 2012;59:2560–2568.
11. Liu T , et al. Nonlinear formulation of the magnetic field to source relationship for robust quantitative susceptibility mapping. Magn Reson Med. 2013;69: 467-476.
12. Hernando D, et al. Magnetic susceptibility as a B0 field strength independent MRI biomarker of liver iron overload. Magn Reson Med. 2013;70(3):648-656.
Figures