4942
Correlation and frequency based analyses between functional QSM and fMRI1NINDS, NIH, Bethesda, MD, United States, 2Institute for Biomedical Engineering, University of Zurich and ETH Zurich, Zurich, Switzerland, 3Department of Radiology, Medical Physics, Medical Center ‐ University of Freiburg, Faculty of Medicine, University of Freiburg, Freiburg, Germany, 4Swiss Center for Musculoskeletal Imaging, Balgrist Campus AG, Zurich, Switzerland
Synopsis
Earlier works demonstrated applications of Quantitative Susceptibility Mapping (QSM) in functional MRI, including both task- and resting-state experiments. The focus had been mostly on the bi-directional activations consistently observed in fQSM. In this work, our aim was to compare the temporal and frequency characteristics of susceptibility and magnitude time-course signals. Importantly, we also included cardiac and respiration signals, and showed that the global susceptibility signal might inherently include more physiological information than the magnitude.
Introduction
Recent literature showed applications of QSM in functional fMRI during task and resting state experiments (1-5). In general, fQSM revealed bi-directional activations, and those areas -together- seem to better match fMRI activations in task-related areas (5). Although spatial correspondence is highly important to understand signal behavior, it is also crucial to understand the temporal relations. Our aim was to explore temporal signal changes related to task, and also to heart rate and respiration, including frequency based analyses, and investigate the contribution of physiological information in the global signals.Methods
Gradient-echo-2D-EPI (TR = 3 s,TE = 25 ms, FA = 850, SENSE = 3.5 ,voxel-dimensions = 1.25,1.25,1.3 mm, recon-size = 176x176x34 images of three consenting volunteers were acquired on a 7 T system. The paradigm (6) required volunteers to first fix a projected cross for 9 s. Subsequently, 15 s of upper-left/lower-right (ULLR) color-changing wedges, 15 s of rest (grey screen with a cross), followed by 15s upper-right/lower-left (URLL), and 15 s rest, were presented over 200 EPI scans. The subjects’ attention was assured by a simple button-response task to any contrast alteration of the fixation point. Heart rate variations (HR) and respiratory volumes per time (RV) were calculated with signals acquired from a pulse oximeter unit attached to finger, and from a breathing belt (7, 8), respectively. Phase data were unwrapped via the Laplacian-approach (9), and background-field-corrected via a variant of SHARP method with variable spherical kernels (V-SHARP (10, 11), Rmax = 10 voxels, threshold = 0.012mm-1). By means of field to susceptibility dipolar inversion, quantitative susceptibility maps were generated using an LSQR algorithm (12). The sign of QSM data was converted (to have the same trend with fMRI), and the minimum value over all-time series obtain positive values. Magnitude and susceptibility data were smoothed with 2.5 mm-Gaussian-kernel, and were subject to a spatial-domain ICA algorithm (FAST ICA) of GIFT (13), with 20 number of components. Correlation (MATLAB, ‘corr’) analyses were performed between independent components of fMRI and fQSM time-series data on one hand, and physiological signals on the other. Whole brain global signals were estimated and used for frequency analyses. The latter has been done with use of Welch’s power spectral density estimate (MATLAB, ‘pwelch’), to investigate each signals' frequency distribution.Results
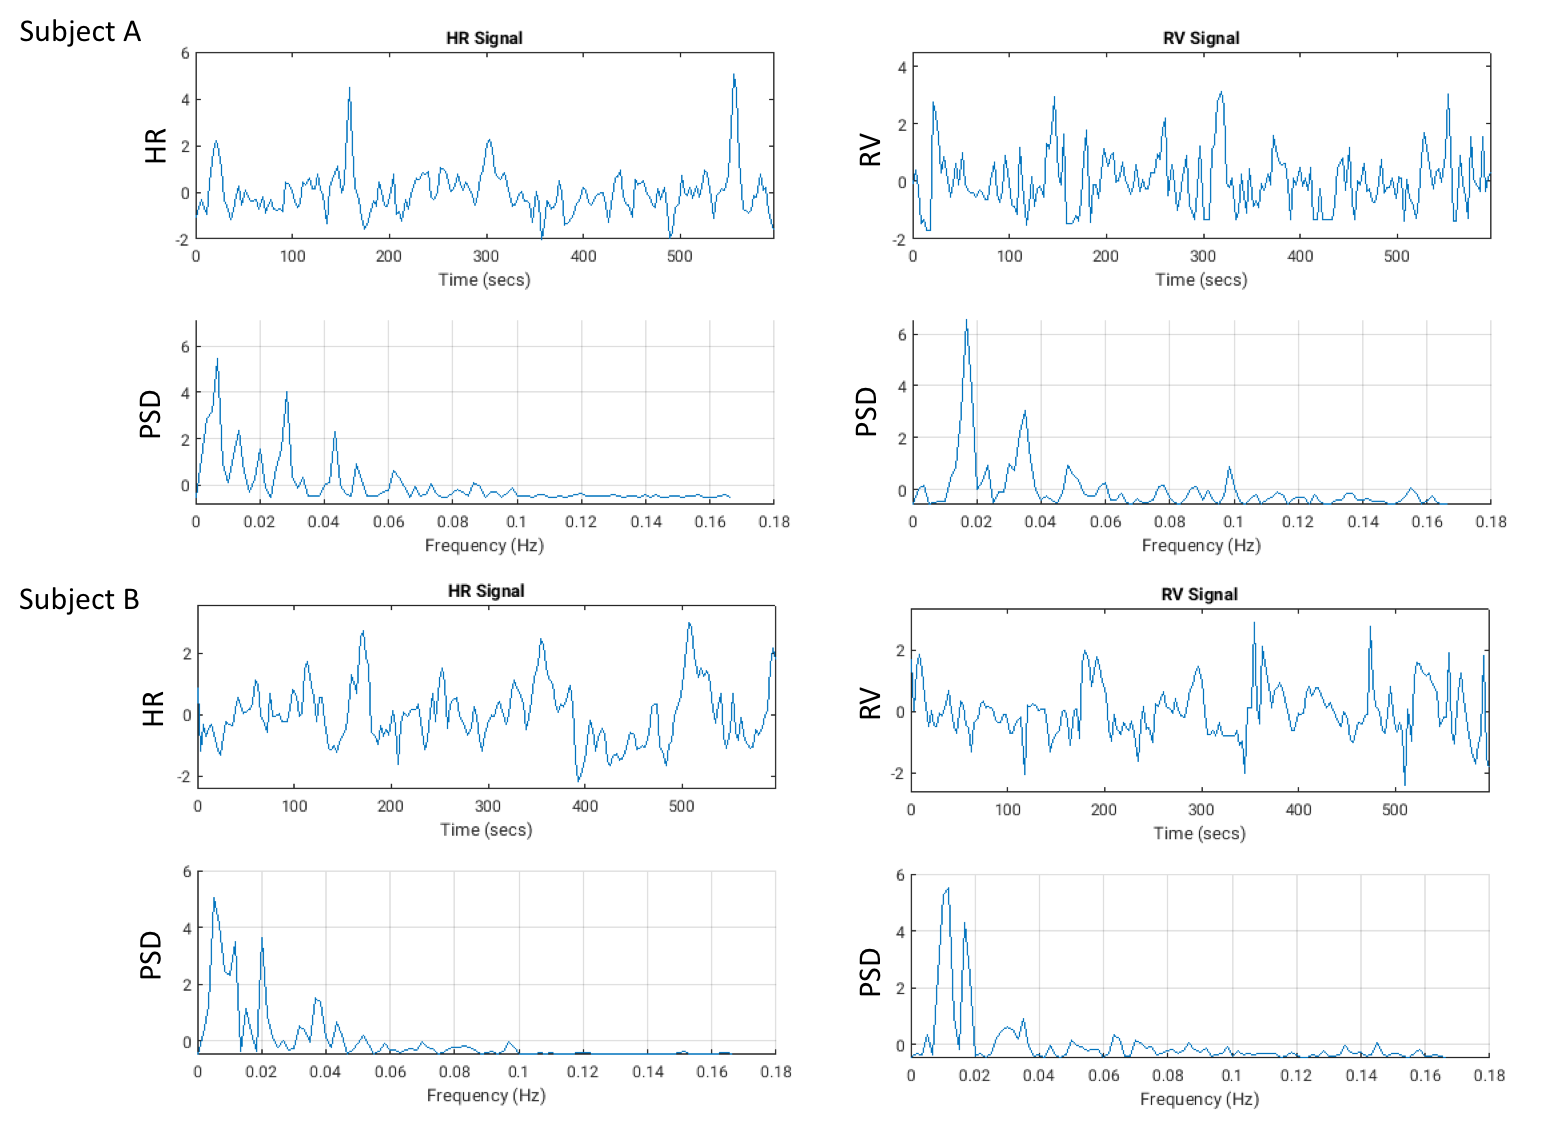
Subject level analyses showed bi-directional activations in fQSM matching up to 70% with fMRI, within task-related regions of interest (Fig.1). Temporal cross-correlations between fMRI and fQSM components’ time courses (20x20) gave strong correlation values corresponding to both task and non-task related ones (Fig.2). Although some task-related components include temporal characteristics of physiological information (Fig.2, left-most, see relations of task-related components with RV), some of the non-task related components of fMRI and fQSM also gave strong correlation, which seem to have either HR or RV contribution (Fig.2, right-most three columns). To investigate further the physiological information inherently exists in magnitude and susceptibility time-series data, we calculated power spectral densities (PSDs) of mean global signals (Fig.3). PSD of both magnitude and susceptibility data had peaks around 0.3 Hz, related to task, while susceptibility data showed other prominent peaks. Spectral analyses of HR and RV signals (Fig.4) revealed that, these low frequencies might indeed have physiological information, as signals of both cardiac and respiration, which originally composed of frequency components higher than those of BOLD signal, are usually temporally aliased due to undersampling (14).Conclusion and Discussion
Our results show high correspondence of task-related components between fMRI and fQSM, both spatially and temporally. We found high correlation values between task and non-task related components of fMRI and fQSM, and the latter seems to involve physiological information. Even the filtering steps of QSM have been applied on the raw phase signal, frequency analyses indicate that susceptibility time-series data may still contain more information on physiological processes than the magnitude, which is also consistent with earlier reports on phase based fMRI (15). There has been also a recent work on fQSM, reporting less consistency between task-correlated ICA and spatial parametric mapping (SPM, based on hemodynamic response function and task paradigm) inferred activation maps of fQSM than the fMRI (4), in which physiological information might play an important role.Acknowledgements
No acknowledgement found.References
1. Balla DZ, Sanchez-Panchuelo RM, Wharton SJ, Hagberg GE, Scheffler K, Francis ST, et al. Functional quantitative susceptibility mapping (fQSM). Neuroimage. 2014;100:112-24.
2. Bianciardi M, van Gelderen P, Duyn JH. Investigation of BOLD fMRI resonance frequency shifts and quantitative susceptibility changes at 7 T. Hum Brain Mapp. 2014;35(5):2191-205.
3. Ozbay PS, Warnock G, Rossi C, Kuhn F, Akin B, Pruessmann KP, et al. Probing neuronal activation by functional quantitative susceptibility mapping under a visual paradigm: A group level comparison with BOLD fMRI and PET. Neuroimage. 2016;137:52-60.
4. Chen Z, Calhoun VD. Task-evoked brain functional magnetic susceptibility mapping by independent component analysis (chiICA). J Neurosci Methods. 2016;261:161-71.
5. Ozbay PS, Kasper L, Pruessmann KP, Nanz D, editors. Discrimination of volumes with positive and negative functional QSM activationwithin fMRI-positive volumes in high-resolution, high-field task-based and resting-state data. ISMRM; 2017 2017; Hawaii2017.
6. Kasper L, Haeberlin M, Dietrich BE, Gross S, Barmet C, Wilm BJ, et al. Matched-filter acquisition for BOLD fMRI. Neuroimage. 2014;100:145-60.
7. Birn RM, Diamond JB, Smith MA, Bandettini PA. Separating respiratory-variation-related fluctuations from neuronal-activity-related fluctuations in fMRI. Neuroimage. 2006;31(4):1536-48.
8. Chang C, Cunningham JP, Glover GH. Influence of heart rate on the BOLD signal: the cardiac response function. Neuroimage. 2009;44(3):857-69.
9. Schofield MA, Zhu Y. Fast phase unwrapping algorithm for interferometric applications. Optics letters. 2003;28(14):1194-6.
10. Schweser F, Sommer K, Deistung A, Reichenbach JR. Quantitative susceptibility mapping for investigating subtle susceptibility variations in the human brain. Neuroimage. 2012;62(3):2083-100.
11. Ozbay PS, Deistung A, Feng X, Nanz D, Reichenbach JR, Schweser F. A comprehensive numerical analysis of background phase correction with V-SHARP. NMR Biomed. 2016.
12. Li W, Wu B, Liu C. Quantitative susceptibility mapping of human brain reflects spatial variation in tissue composition. Neuroimage. 2011;55(4):1645-56.
13. Calhoun VC. Group ICA of fMRI Toolbox (GIFT). Available at: http://icatb.sourceforge.net. 2004.
14. Lowe MJ, Mock BJ, Sorenson JA. Functional connectivity in single and multislice echoplanar imaging using resting-state fluctuations. Neuroimage. 1998;7(2):119-32.
15. Petridou N, Schafer A, Gowland P, Bowtell R. Phase vs. magnitude information in functional magnetic resonance imaging time series: toward understanding the noise. Magn Reson Imaging. 2009;27(8):1046-57.
Figures