4941
Dynamic quantitative susceptibility mapping to assess vascular compliance in the brainChristoph Birkl1,2, Christian Langkammer2, Pascal Sati3, Christian Enzinger2, Franz Fazekas2, and Stefan Ropele2
1UBC MRI Research Centre, University of British Columbia, Vancouver, BC, Canada, 2Department of Neurology, Medical University of Graz, Graz, Austria, 3Translational Neuroradiology Unit, Neuroimmunology Branch, National Institute of Neurological Disorders and Stroke, National Institutes of Health, Bethesda, MD, United States
Synopsis
In this study we explored if quantitative susceptibility mapping (QSM) allows assessing blood pressure induced changes of the magnetic susceptibility in the brain as consequence of cerebral autoregulation. Eight healthy subjects underwent fast QSM at 3.0-T and simultaneous measurement of the mean arterial pressure (MAP) following a small drop in MAP caused by a change in posture. A linear relationship between MAP and susceptibility was observed, where the slope represents a measure of the cerebral vascular compliance with different signs for arterial and venous blood vessels.
Introduction
Cerebral autoregulation (CA) 1 serves to maintain a constant cerebral blood flow (CBF) over a wide range of mean arterial blood pressure (MAP) levels (50 – 150 mmHg) to ensure adequate supply of the brain with glucose and oxygen. This occurs by vasodilation or vasoconstriction of blood vessels with concomitant changes of intravascular blood volume.2 Changes in cerebral blood volume (CBV) per given change in blood pressure are viewed as indicator of cerebral vascular compliance (CVC) which reflects a main component of vascular function.3 The capability for CVC varies across the cerebral vasculature depending on the amount of smooth muscle cells in the vessel wall, the pericyte density, and most notably on the length and diameter of the vessels.4 In this regard, the most prominent CA induced blood volume changes can be expected to occur in subcortical and pial vessels.4 The magnetic susceptibility of blood is dominated by the oxygenation level of haemoglobin, with a more paramagnetic susceptibility in venous vessels and a more diamagnetic susceptibility in arterial vessels.5 In contrast, the magnetic susceptibility of brain tissue is dominated by the diamagnetic susceptibility of water, but paramagnetic and diamagnetic substances may cause regional susceptibility variations.6 The goal of this study was to explore if QSM allows to depict and map magnetic susceptibility changes in the brain as a consequence of autoregulatory changes in CBV following a drop in blood pressure by lying down.7Methods
Eight healthy volunteers (six men, two women) with a mean age of 32 years (age range 28-49 years) underwent MR imaging on a 3.0-T MR system using a 64-channel head coil. For QSM, we employed a 3D gradient-echo echo-planar imaging (greEPI) sequence 8 with TR = 50 ms, TE = 30 ms, flip angle 15°, EPI factor = 15, and scan time of 57 sec. This sequence was started immediately after the volunteers had taken their supine position in the MR scanner. To monitor changes in QSM, this sequence was repetitively performed eight times with subsequent reconstruction of QSM using the total generalized variation method.9 At each start of the greEPI sequence, the systolic (SYS) and diastolic (DIA) blood pressure and the blood oxygenation level (SPO2) was measured and the MAP was calculated according to MAP = DIA+1/3(SYS-DIA). Thereafter, a high-resolution T1 weighted true inversion recovery (TIR) sequence was performed for an anatomical reference. The magnetic susceptibility of each greEPI measurement was correlated pixel by pixel with the corresponding MAP using a linear regression model. The slope of the regression line was taken as an indirect measure of the CVC.Results
In every subject a gradual MAP drop was observed from lying down on the MRI table until close to the end of the greEPI scans. The maximal decrease of MAP ranged between 7-14 mmHg (mean ∆Pmax = 10 ± 2 mmHg) across all subjects. The SPO2 ranged between 96-100 % and was not affected by lying down. Figure 1 shows a representative compliance map with a semi-transparent cortical mask in correspondence to the schematic drawing in Figure 2. Structures with blood pressure dependent QSM changes are colour-coded with a positive slope displayed in red (representing structures with mainly arterial contributions) and a negative slope displayed in blue (representing structures with mainly venous contributions). Most likely, these structures reflect voxels containing predominantly long arterioles and venules in the subcortical white matter and arterial and venous blood vessels on the brain surface.10,11Discussion
Dynamic QSM imaging allows to assess the functional component of the cerebral vasculature. We have demonstrated that a small decrease in blood pressure, such as elicited by lying down, suffices to induce magnetic susceptibility shifts in regions containing vessels with the ability to change their diameter as a consequence of cerebral autoregulation.12 This property appears especially prominent in the long arterioles and venules of the subcortical WM and on the cortical surface. However, arterial and venous vessels that occupy an imaging voxel to an equal proportion cannot be depicted as their opposite susceptibility shifts will cancel out. The signal from larger vessels with high flow velocity can also not be captured due to outflow and saturation effects. In conclusion, QSM allows a fast and non-invasive mapping of blood pressure induced susceptibility changes, which could serve as measure for CVC.Acknowledgements
No acknowledgement found.References
- Bayliss WM. On the local reactions of the arterial wall to changes of internal pressure. J Physiol. 1902;28(3):220-231. doi:10.1113/jphysiol.1902.sp000911.
- Lassen N. Cerebral Blood Flow and Oxygen Consumption in Man. Physiol Rev. 1959;39(2):183-238.
- Aaslid R, Newell DW, Stooss R, Sorteberg W, Lindegaard KF. Assessment of cerebral autoregulation dynamics from simultaneous arterial and venous transcranial Doppler recordings in humans. Stroke. 1991;22(9):1148-1154. doi:10.1161/01.STR.22.9.1148.
- Kontos H, Wei EP, Navari RM, Levasseur JE, Rosenblum WI, Patterson JL. Responses of cerebral arteries and arterioles to acute hypotension and hypertension. Am J Physiol. 1978;234(4):H371-83. doi:10.1152/ajpheart.1978.234.4.H371.
- Weisskoff RM, Kiihne S. MRI susceptometry: Image-based measurement of absolute susceptibility of MR contrast agents and human blood. Magn Reson Med. 1992;24(2):375-383. doi:10.1002/mrm.1910240219.
- Schenck J. The role of magnetic susceptibility in magnetic resonance imaging: MRI magnetic compatibility of the first and second kinds. Med Phys. 1996;23(6):815-850.
- Olufsen MS. Blood pressure and blood flow variation during postural change from sitting to standing: model development and validation. J Appl Physiol. 2005;99(4):1523-1537. doi:10.1152/japplphysiol.00177.2005.
- Sati P, George IC, Shea CD, Gaitán MI, Reich DS. FLAIR*: a combined MR contrast technique for visualizing white matter lesions and parenchymal veins. Radiology. 2012;265(3):926-932. doi:10.1148/radiol.12120208.
- Langkammer C, Bredies K, Poser BA, et al. Fast quantitative susceptibility mapping using 3D EPI and total generalized variation. Neuroimage. 2015;111(2014):622-630. doi:10.1016/j.neuroimage.2015.02.041.
- Duvernoy HM, Delon S, Vannson JL. Cortical blood vessels of the human brain. Brain Res Bull. 1981;7(5):519-579. doi:10.1016/0361-9230(81)90007-1.
- Moody DM, Bell MA, Challa VR. Features of the cerebral vascular pattern that predict vulnerability to perfusion or oxygenation deficiency: An anatomic study. Am J Neuroradiol. 1990;11(3):431-439. doi:Thesis #26.
- Paulson OB, Strandgaard S, Edvinsson L. Cerebral autoregulation. Cerebrovasc Brain Metab Rev. 1990;2(2):161-192. doi:10.1161/01.STR.15.3.413.
Figures
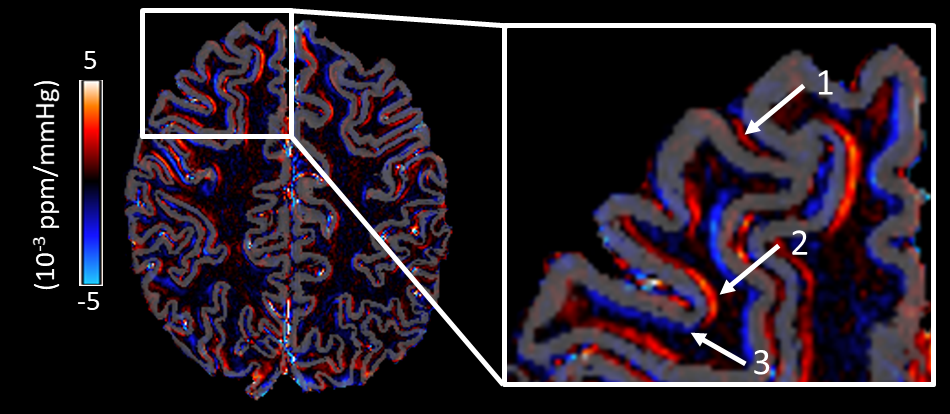
Figure 1: CVC
map with a semi-transparent cortical mask. The zoomed inlay highlights regions
with mainly pial arterial (1), arterial (2) and venous (3) contributions.
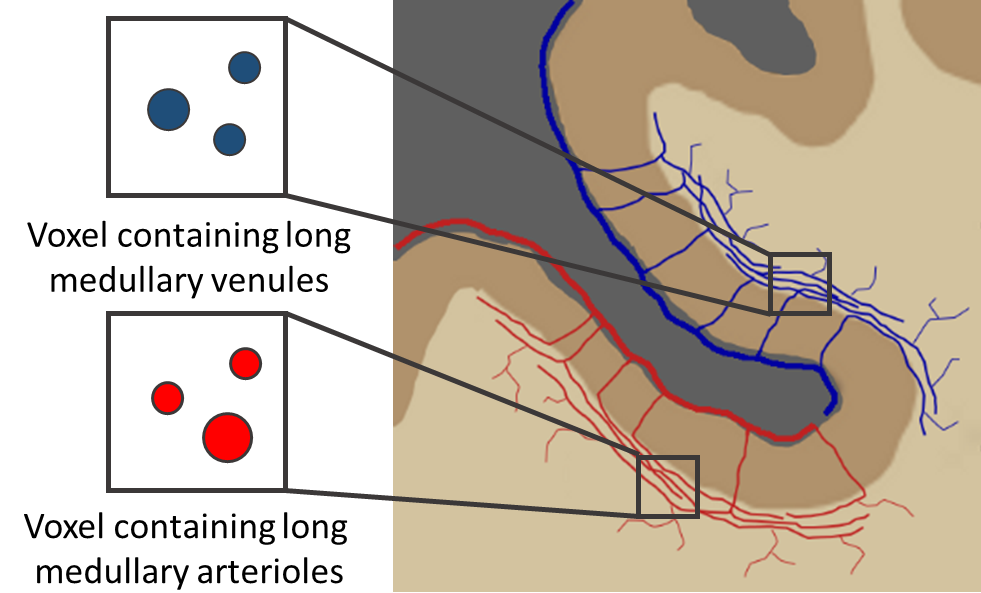
Figure 2:
Schematic drawing of pial and subcortical blood vessels. The longest vessels
with a high capability to modulate the diameter are medullary arterioles and
venules.11 According to
Duvernoy type 5 these vessels follow the course of the subcortical interface
over long distances before they branch into white matter.10