4938
Echo time-dependent reproducibility of Quantitative Susceptibility Mapping at different field strength1IMT School for Advanced Studies, Lucca, Italy, 2IMAGO 7 Foundation and IRCCS Stella Maris, Pisa, Italy, 3University of Pisa, Pisa, Italy, 4Azienda Ospedaliero-Universitaria Pisana, Pisa, Italy
Synopsis
The assessment of reproducibility of Quantitative Susceptibility Mapping (QSM) is critical in multi-center studies and clinical follow-ups. However, many experimental factors and acquisition parameters may compromise quantification accuracy. In this work, we analyze the impact of echo time on intra-scanner repeatability and inter-scanner reproducibility of QSM using a 3D multi-echo GRE sequence on MRI scanners of different field strength (3T and 7T) from the same vendor.
Introduction
The increasing importance of Quantitative Susceptibility Mapping (QSM) in medical research and its introduction in the clinical practice make reproducibility an important issue. Both intrinsic properties of susceptibility, like its anisotropic behavior1,2, and acquisition parameters, like coverage3 and spatial resolution4,5, have been reported to have a detrimental role on the accuracy of quantification. As some works also described the TE-dependence of QSM in many brain regions6,7, previous reproducibility studies matched echo times across different sessions8–11. However, this may represent a problem when evaluating reproducibility at different field strength. Here we aim to assess the influence of echo time on intra-scanner repeatability and inter-scanner reproducibility of susceptibility maps acquired on healthy subjects at two field strengths.Methods
Five healthy subjects S1-S5 (30±5 years old, two females) underwent two examinations at 3T and two at 7T, using MRI scanners from the same vendor (GE-MR750 and GE-MR950, respectively). The time between sessions was less than one month. On each scanner, two 3D Gradient-Recalled Multi-Echo sequences with whole brain coverage were acquired for QSM with the following parameters: TR=54.1ms and spatial resolution=1×1×1mm3, receiver BW=100kHz. Echo times were matched across scanners and set in the commonly employed interval in the literature, that is, between 5ms to 42ms (11 echoes with 3.7ms of spacing). The processing pipeline for QSM, common to all scans at both field strengths, is described extensively in the literature2,12–15. The scanning protocol on both systems included also a T1-weighted 3D IR-prepared FSPGR acquisition for anatomical reference. All the T2*-weighted images of each subject were co-registered via FSL-FLIRT16.
Reproducibility was assessed via voxel-wise analysis, including voxels from the whole brain, by computing orthogonal linear fit and Pearson’s correlation for each pair of TEs. For each TE of one scan, the corresponding TE in another scan that maximizes overall reproducibility was selected as the one that produces the angular coefficient m closest to 1, obtained by linear regression. The optimal pairs of TEs between scans were linearly fitted to obtain the relationship between TEs that enhances reproducibility for different field strengths.
Results
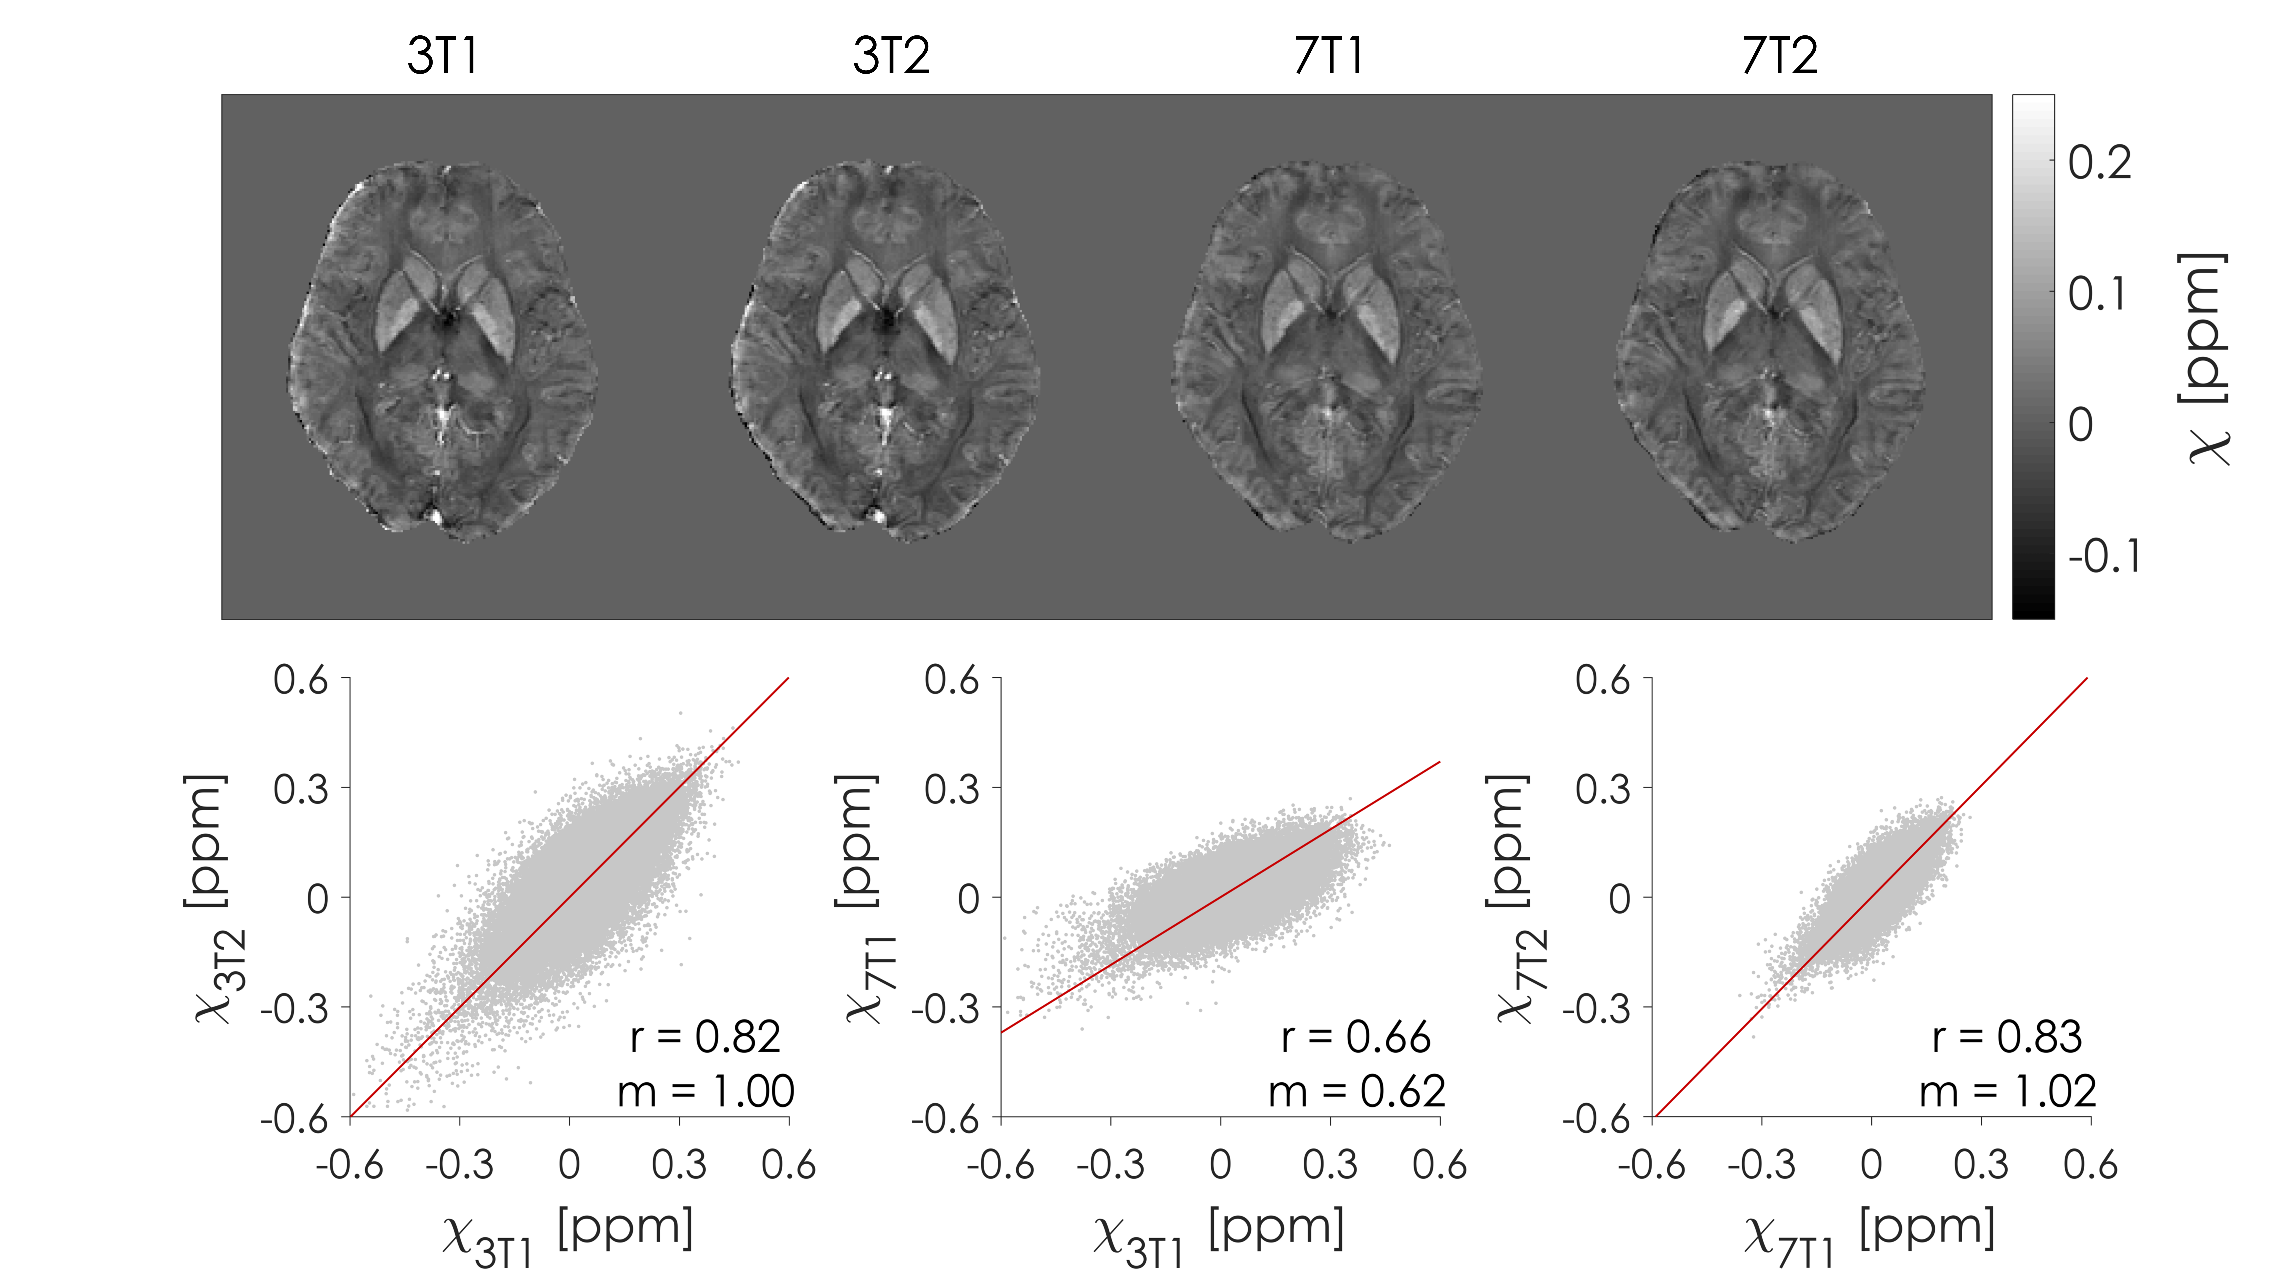
Typical QSM images obtained by averaging susceptibility maps across TEs are displayed in Figure 1, together with the scatter plots for each combination of runs. Very high intra-scanner reproducibility is obtained (m~1, r>0.8) for both 3T and 7T datasets, while inter-scanner reproducibility is strongly impaired (m=0.62, r=0.66).
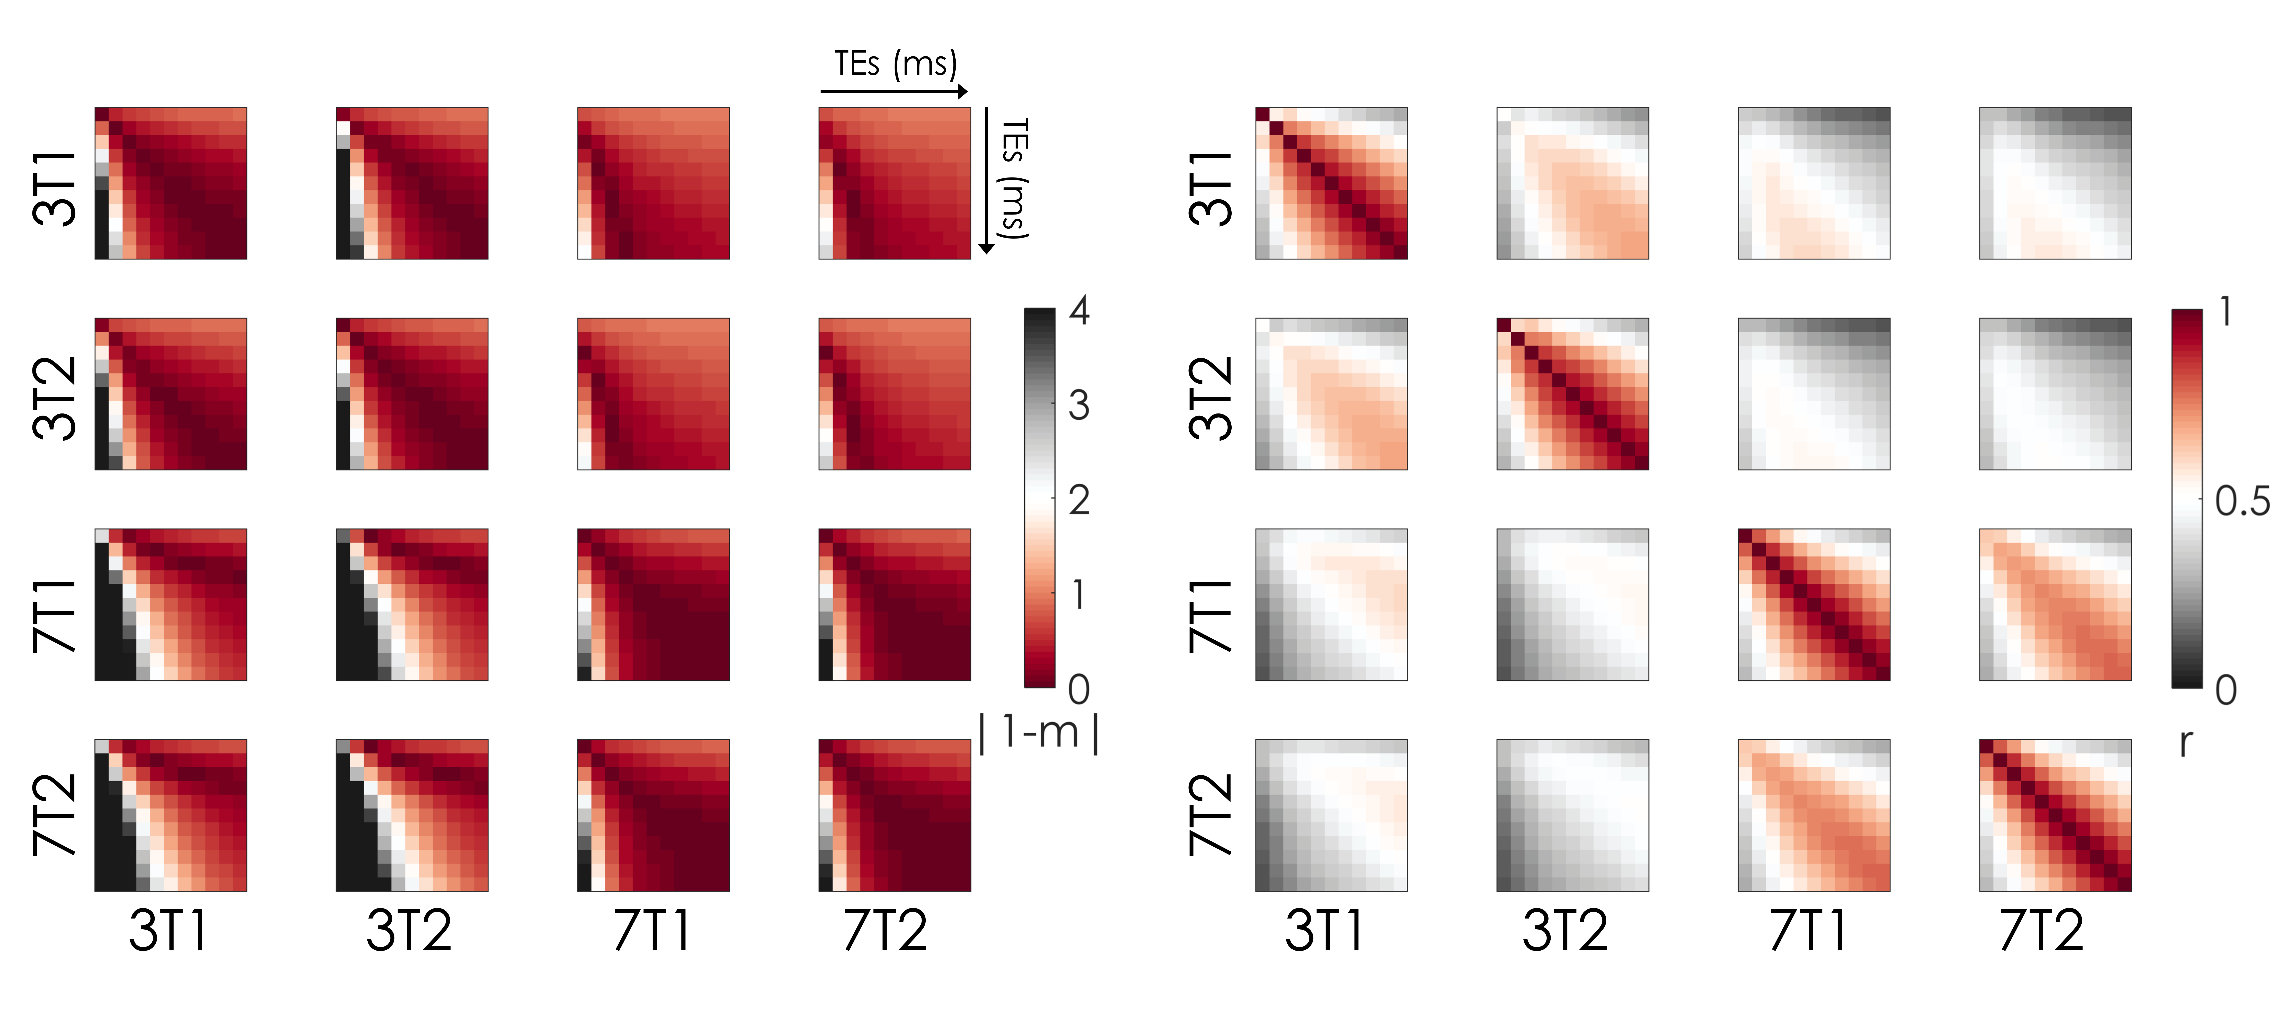
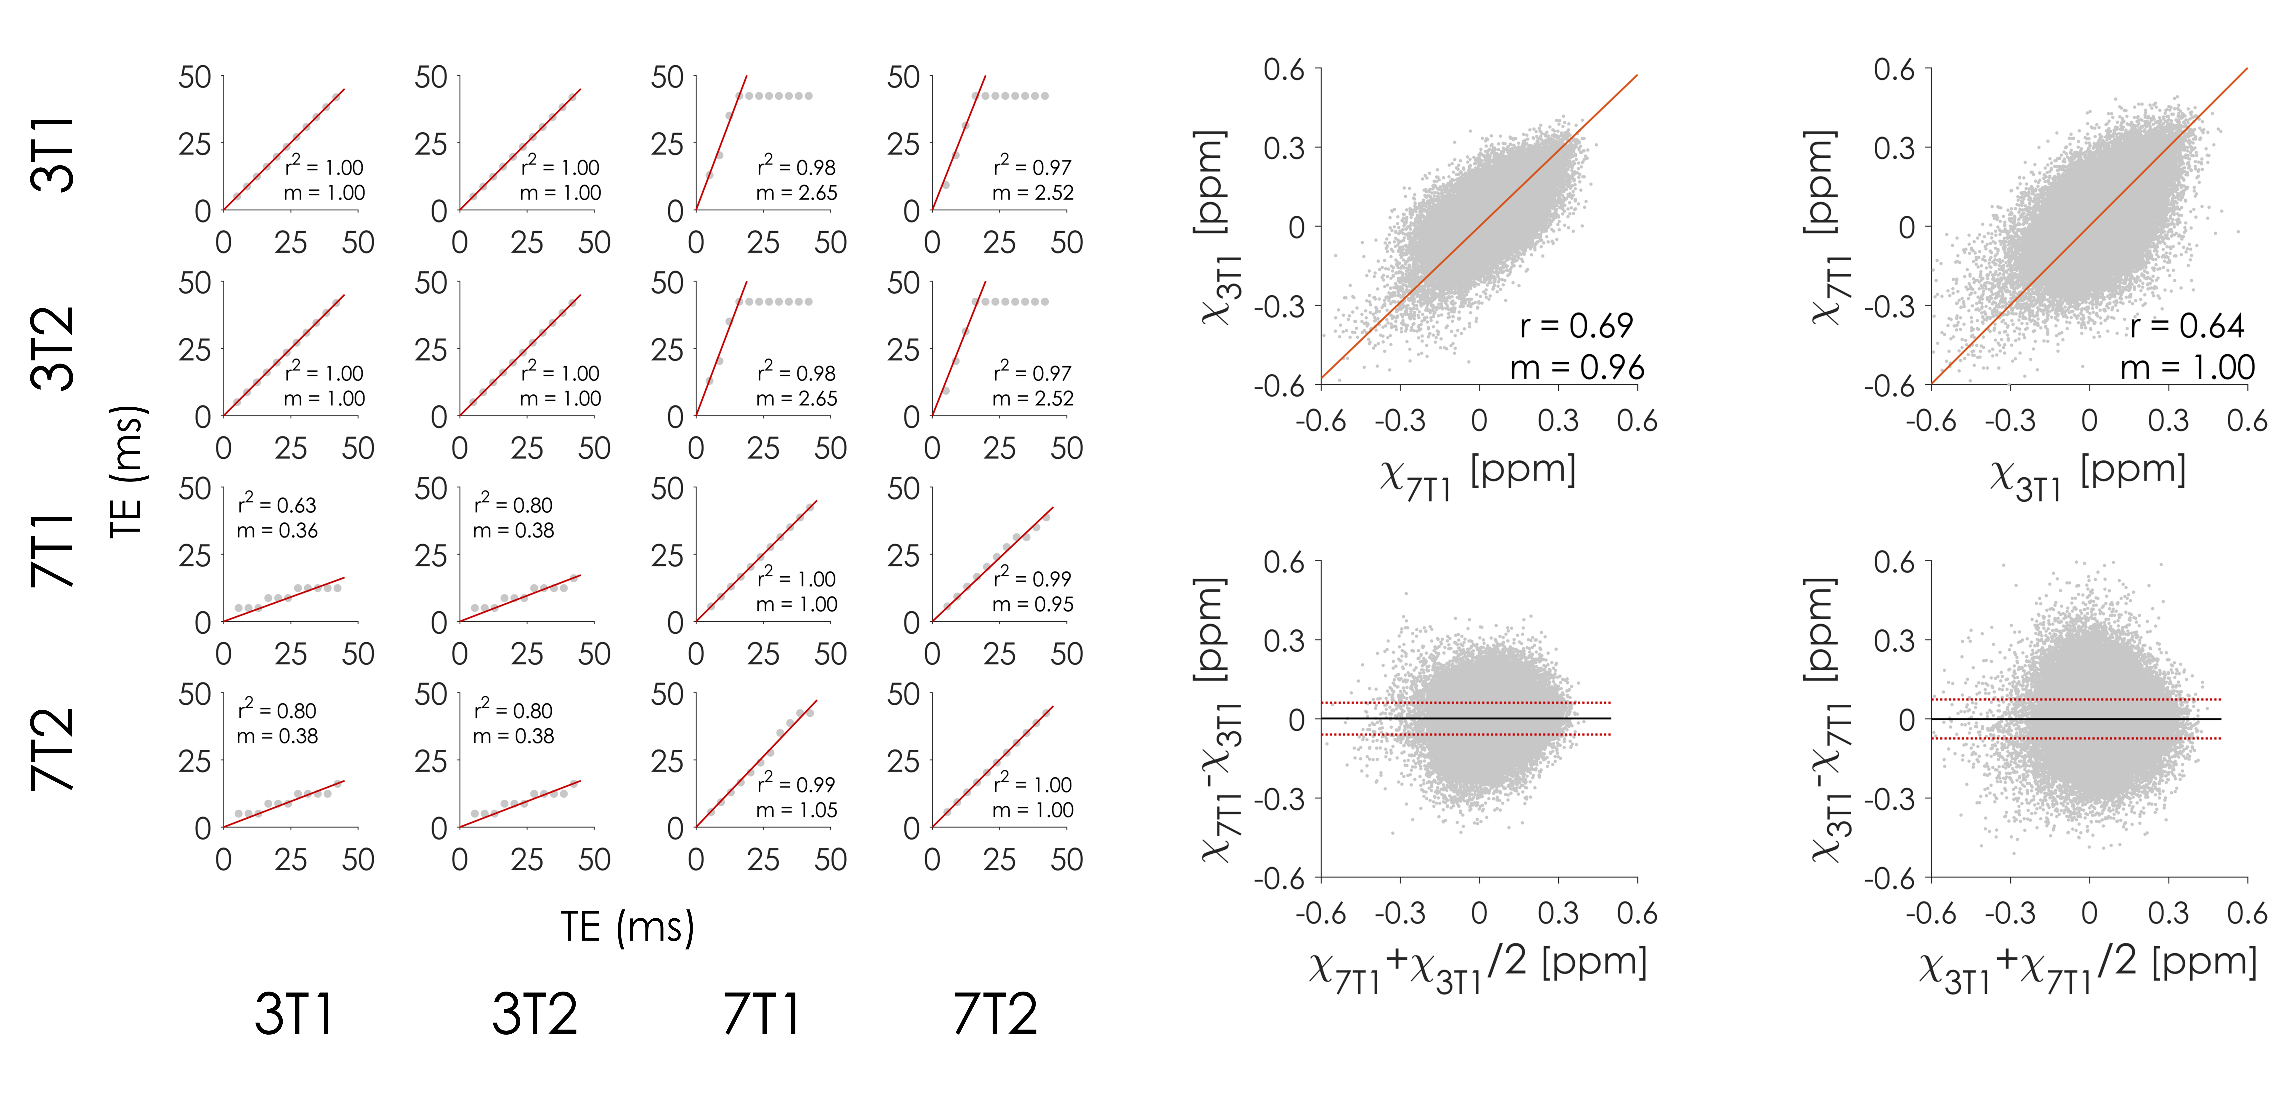
The voxel-wise analysis of reproducibility on χ maps from single echoes showed high dependence on TEs. Figure 2 shows |1-m| and Pearson’s r for each combination of TEs and runs. In Figure 3 (left panel), the optimal TEs that maximize reproducibility in whole-brain scans are shown. While for intra-scanner reproducibility TEs must be matched across runs, when the target is to maximize the reproducibility of whole-brain QSM at different field strengths, TEs used at 3T should be approximately 2.6 times longer than those at 7T. In Figure 3 (right panel), the scatter plots and the Bland-Altman plots obtained by averaging only the optimal pairs of TEs show excellent inter-scanner reproducibility between 3T and 7T.
Discussion and conclusion
The dependence of QSM on TE impairs reproducibility. While matching the echo time across scans ensures intra-scanner reproducibility, this appears not to be the case when performing multi-center studies at different field strength. As the non-linear evolution of the phase appears to be related to signal compartmentalization due to tissue microstructure6, we expect to observe this effect mainly in in-vivo experiments, while simple high-susceptibility phantoms may not capture this aspect.
Here we show that excellent reproducibility can be achieved across systems operating at different field strengths if acquisition parameters are properly selected. In particular, echo times need to be set such that at 3T they are ~2.6 times longer than those at 7T, to maximize whole-brain QSM reproducibility. This way, QSM can be considered as a suitable technique for longitudinal and multi-site studies, provided a careful choice of acquisition settings.
Acknowledgements
No acknowledgement found.References
1. Li W, Wu B, Avram A V., Liu C. Magnetic susceptibility anisotropy of human brain in vivo and its molecular underpinnings. Neuroimage. 2012;59(3):2088-2097.
2. Lancione M, Tosetti M, Donatelli G, Cosottini M, Costagli M. The impact of white matter fiber orientation in single-acquisition quantitative susceptibility mapping. NMR Biomed. 2017;30(11).
3. Elkady AM, Sun H, Wilman AH. Importance of extended spatial coverage for quantitative susceptibility mapping of iron-rich deep gray matter. Magn Reson Imaging. 2016;34(4):574-578.
4. Karsa A, Punwani S, Shmueli K, Anita Karsa C. The effect of low resolution and coverage on the accuracy of susceptibility mapping. Magn Reson Med. 2018:1-16.
5. Zhou D, Cho J, Zhang J, Spincemaille P, Wang Y. Susceptibility underestimation in a high-susceptibility phantom: Dependence on imaging resolution, magnitude contrast, and other parameters. Magn Reson Med. 2017;78(3):1080-1086.
6. Cronin MJ, Wang N, Decker KS, Wei H, Zhu W-Z, Liu C. Exploring the origins of echo-time-dependent quantitative susceptibility mapping (QSM) measurements in healthy tissue and cerebral microbleeds. Neuroimage. 2017;149:98-113.
7. Sood S, Urriola J, Reutens D, O’Brien K, Bollmann S, Barth M, Vegh V. Echo time-dependent quantitative susceptibility mapping contains information on tissue properties. Magn Reson Med. 2017;77(5):1946-1958.
8. Deh K, Kawaji K, Bulk M, Van Der Weerd L, Lind E, Spincemaille P, McCabe Gillen K, Van Auderkerke J, Wang Y, Nguyen TD. Multicenter reproducibility of quantitative susceptibility mapping in a gadolinium phantom using MEDI+0 automatic zero referencing. Magn Reson Med. October 2018.
9. Deh K, Nguyen TD, Eskreis-Winkler S, Prince MR, Spincemaille P, Gauthier S, Kovanlikaya I, Zhang Y, Wang Y. Reproducibility of quantitative susceptibility mapping in the brain at two field strengths from two vendors. J Magn Reson Imaging. 2015;42(6):1592-1600.
10. Lin P-Y, Chao T-C, Wu M-L. Quantitative Susceptibility Mapping of Human Brain at 3T: A Multisite Reproducibility Study. Am J Neuroradiol. 2015;36(3):467-474.
11. Wang R, Xie G, Zhai M, Zhang Z, Wu B, Zheng D, Hong N, Jiang T, Wen B, Cheng J. Stability of R2* and quantitative susceptibility mapping of the brain tissue in a large scale multi-center study. Sci Rep. 2017;7:45261.
12. Li W, Wu B, Liu C. Quantitative susceptibility mapping of human brain reflects spatial variation in tissue composition. Neuroimage. 2011;55(4):1645-1656.
13. Deistung A, Schweser F, Wiestler B, Abello M, Roethke M, Sahm F, Wick W, Nagel AM, Heiland S, Schlemmer HP, Bendszus M, Reichenbach JR, Radbruch A. Quantitative Susceptibility Mapping differentiates between blood depositions and calcifications in patients with glioblastoma. PLoS One. 2013;8(3):1-8.
14. Schweser F, Deistung A, Lehr BW, Reichenbach JR. Quantitative imaging of intrinsic magnetic tissue properties using MRI signal phase: an approach to in vivo brain iron metabolism? Neuroimage. 2011;54(4):2789-2807.
15. Li W, Wang N, Yu F, Han H, Cao W, Romero R, Tantiwongkosi B, Duong TQ, Liu C. A method for estimating and removing streaking artifacts in quantitative susceptibility mapping. Neuroimage. 2015;108:111-122.
16. Jenkinson M, Beckmann CF, Behrens TEJ, Woolrich MW, Smith SM. FSL. Neuroimage. 2012;62:782-790.
Figures