4936
Quantitative Analysis of QSM Image for PD Basal-Cortico Circuit1Department of Electronics and Information, Harbin Institute of Technology, Shenzhen, China, 2Department of Neurobiology, Neurology and Geriatrics, Xuanwu Hospital Capital Medical University, Beijing Institute of Geriatrics, Beijing, China, 3National Clinical Research Center for Geriatric Disorders, Beijing, China
Synopsis
Parkinson’s disease is associated with iron accumulation, while quantitative susceptibility mapping can provide quantitative measures of magnetic susceptibility. To investigate the connection about iron deposition and PD etiology or progression, we focused on 16 regions in Basal-Cortico motional circuit by using quantitative susceptibility mapping. Combined with a series of Parkinson’s disease scale score, we derived the relationship between iron content and the scale scores.
INTRODUCTION
Parkinson’s disease is pathologically associated with the loss of dopaminergic neurons in the substantia nigra. Brain iron accumulation is connected with Parkinson’s disease1. During the last decade, magnetic resonance imaging relaxation rates (e.g., R2* ) have been used to estimate iron content of the SN2. Quantitative susceptibility mapping (QSM) is a technique for quantification of magnetic susceptibility, which involve changes in magnetic field and has been used to show nigral iron deposition in PD patients (Liu et al. 2011 ; Li et al. 2012 , 2014 ; Argyridis et al. 2013 ; Li and Liu 2013 ). Thus, quantitative susceptibility mapping is well suited for investigating the brain iron content. It is well established that Parkinson's disease mainly affects the motor nervous system. Previously, most studies paid attention to changes in nigral iron deposition, and overlooked the specific neural circuit that control human’s movement. In this study, we focused on 16 regions in basal-cortico circuit, comparing iron content of corresponding area with a series of Parkinson’s disease scale (e.g., UPDRS, MoCA), to find the relationship between iron content and scale score.METHODS
Nineteen subjects including 40 PD patients were selected in this study. All subjects were scanned on a 3T MRI system (Trio; Siemens Magnetom; Erlangen, Germany) with T1-weighted images (TR/TE = 2530/2.98, matrix = 224*256, slice thickness = 1mm, slice number = 192, voxel size = 1*1*1mm3) and T2* images (TR=25ms, TE=17.5ms, matrix = 288*384, slice thickness = 1mm, slice number = 80, voxel size = 0.6*0.6*1.5mm3).
QSM reconstruction was performed by using susceptibility imaging software (MEDI toolbox; http://pre.weill.cornell.edu/mri/pages/qsm.html) organized by Wang Yi et al.3. Magnitude and phase images were constructed from the raw data. And the phase images were unwrapped by using a Laplacian phase unwrapping method4. Removing the background field by the method of projection onto dipole fields (PDF), QSM images were generated by using Morphology Enabled Dipole Inversion (MEDI) method.
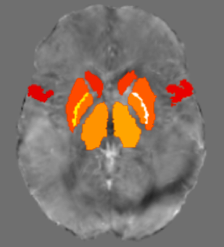
Image processing was performed by using FSL (https://fsl.fmrib.ox.ac.uk/fsl/fslwiki) and ANTS (http://picsl.upenn.edu/software/ants/). T1 weighted images were skull stripped by BET, and were removed the neck by FSL tools. T1-weighted images and T2* images were registered to normalize template space using linear registration algorithm5. The skull-stripped QSM images were directly brought to template space with previous transformation matrix. After aligning all individual images to the Montreal Neurological Institute (MNI) standard space template using nonlinear affine registration, sixteen ROIs were chosen to analyze basal-cortico circuit, including both sides of substantia nigra (SN), subthalamic nucleus (STN), supplementary motor area (SMA), precentral gyrus, caudate nucleus, putamen, globus pallidus, thalamus. Finally, we calculated the mean QSM value of the 16 regions, and investigated potential relationship between QSM value and the scale score.
RESULTS
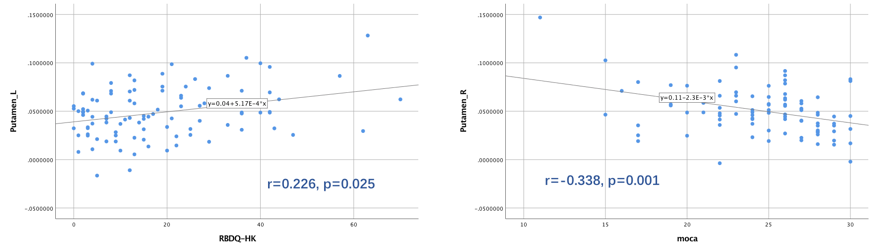
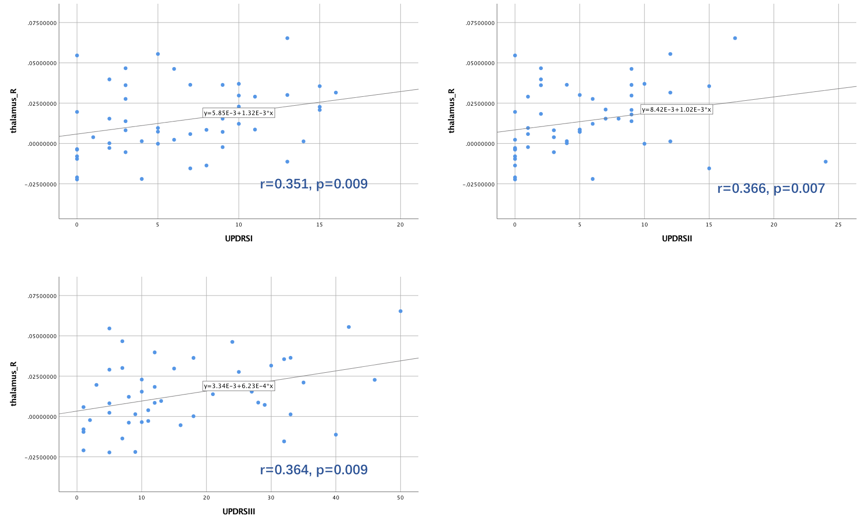
Using QSM data, we assessed the clinical significance of several regions changes in PD patients. In the left putamen, there was a positive correlation of QSM value with REM sleep behavior disorder questionnaire: Hong Kong (RBDQ-HK) score (r=0.226, p=0.025). In the right putamen, there was a strong negative correlation of QSM value with Montreal Cognitive Assessment (MoCA) score (r=-0.338, p=0.001). Further, in the thalamus, there was a strong positive correlation of QSM value with UPDRS I II III scores.DISCUSSION
In this study, we describe the first use of QSM image for in vivo imaging of the basal-cortico circuit and provide a comparison of the underlying 16 regions alterations in the circuit as assessed by QSM.
We observe that the left putamen positively correlated with RBDQ-HK. It is well established that dopamine is a neurotransmitter that dominant in putamen6. Previous studies showed that dopamine is the most important neurotransmitter of the putamen involved in sleep regulation7. And this may explain the intermittent loss of REM sleep electromyographic (EMG) observed in RBD and early PD patients.
The data indicated that the right side negatively correlated with MoCA score. Some neurologists hypothesize that putamen is involved in the processing of pre-frontal regions which have strong connections with working memory and executive functioning8. This may explain the cognitive impairments commonly observed in advanced PD patients.
We also observed the thalamus has a positive strong correlation of QSM value with UPDRS score. The thalamus is known to has multiple functions, which have connection with many of the sensory systems (except for the olfactory system), such as the auditory, somatic, visceral, gustatory and visual systems. We argued that the iron deposition in thalamus contribute to disease severity.
CONCLUSION
To investigate the correlation between brain iron content and PD progression, we focused on 16 regions in the basal-cortico circuit. By using the QSM image, we measure the susceptibility of each region. Comparing with patients’ scale score, which indicates PD progression, we found that thalamus and putamen play an important role in PD process.Acknowledgements
No acknowledgement found.References
- Lotfipour A K, Wharton S, Schwarz S T, et al. High resolution magnetic susceptibility mapping of the substantia nigra in Parkinson's disease[J]. Journal of Magnetic Resonance Imaging, 2012, 35(1): 48-55.
- Du G, Liu T, Lewis M M, et al. Quantitative susceptibility mapping of the midbrain in Parkinson's disease[J]. Movement Disorders, 2016, 31(3): 317-324.
- Liu T, Xu W, Spincemaille P, et al. Accuracy of the morphology enabled dipole inversion (MEDI) algorithm for quantitative susceptibility mapping in MRI[J]. IEEE transactions on medical imaging, 2012, 31(3): 816-824.
- Liu C, Li W, Tong K A, et al. Susceptibility‐weighted imaging and quantitative susceptibility mapping in the brain[J]. Journal of magnetic resonance imaging, 2015, 42(1): 23-41.
- Guan X, Huang P, Zeng Q, et al. Quantitative susceptibility mapping as a biomarker for evaluating white matter alterations in Parkinson’s disease[J]. Brain imaging and behavior, 2018: 1-12.
- Griffiths P D, Perry R H, Crossman A R. A detailed anatomical analysis of neurotransmitter receptors in the putamen and caudate in Parkinson's disease and Alzheimer's disease[J]. Neuroscience letters, 1994, 169(1-2): 68-72.
- Mignot E, Taheri S, Nishino S. Sleeping with the hypothalamus: emerging therapeutic targets for sleep disorders[J]. nature neuroscience, 2002, 5: 1071.
- Ell S W, Marchant N L, Ivry R B. Focal putamen lesions impair learning in rule-based, but not information-integration categorization tasks[J]. Neuropsychologia, 2006, 44(10): 1737-1751.
Figures