4935
Measurement of Copper and Iron Accumulation in the Deep Gray Matter Nuclei of patients with Wilson Disease Using Quantitative Susceptibility Mapping and R2* Mapping1East China Normal University, Shanghai, China, 2Shanghai First People Hospital, Shanghai, China, 3Weill Medical College of Cornell University, New York, NY, United States
Synopsis
The objective of this study was to evaluate magnetic susceptibility and R2* values from QSM and R2* for differentiating Wilson Disease (WD) from healthy controls (HC). 14 WD and 14 HC subjects were scanned using a 3D multi-echo GRE sequence. The results indicated that susceptibility values in the caudate nucleus (CN), putamen (PUT), globus pallidus (GP), substantia nigra (SN), red nucleus (RN) were significantly higher in patients with WD as compared to those of HC. R2* values were significantly higher in WD patients in all ROIs. Receiver operating characteristic analysis showed that QSM provided the highest AUC=0.888 at SN.
Introduction
Wilson disease (WD) is a rare, autosomal recessive genetic disorder in which excessive amounts of copper and iron accumulate in the brain1-3. Since QSM provides excellent contrast in iron- rich deep gray matter nuclei4, we propose to measure magnetic susceptibility and R2* values in deep gray matter nuclei to discriminate patients with WD from healthy controls, and to evaluate the sensitivity of the deep gray matter nuclei in diagnosis of Wilson disease.Materials and Methods
This study was approved by the local ethical committee and all participants signed an Informed Consent form. 14 WD patients with a mean age of 28.07±9.6 years old (10 males and 4 females) and 14 age-matched healthy controls with a mean age of 28.21±9.2 years old (9 males and 5 females) were scanned on a clinical 3T MR imaging system (Magnetom Trio Tim, Siemens Healthcare, Erlangen, Germany) equipped with a 12 channel head matrix coil. The QSM and R2* maps were generated from the same three dimensional (3D) spoiled multi-echo gradient-echo (GRE) sequence with the following imaging parameters: TR = 60ms, TE1 = 6.8ms, ΔTE = 6.8ms, echoes number = 8, flip angle = 15˚, FOV = 240*180 mm2, in-plane resolution=0.625*0.625mm2, slice thickness = 2mm, number of slices = 96. In addition, a generalized auto-calibrating partially parallel acquisition (GRAPPA) with an acceleration factor of 2 in the right-left direction and elliptical sampling were used to reduce acquisition time.
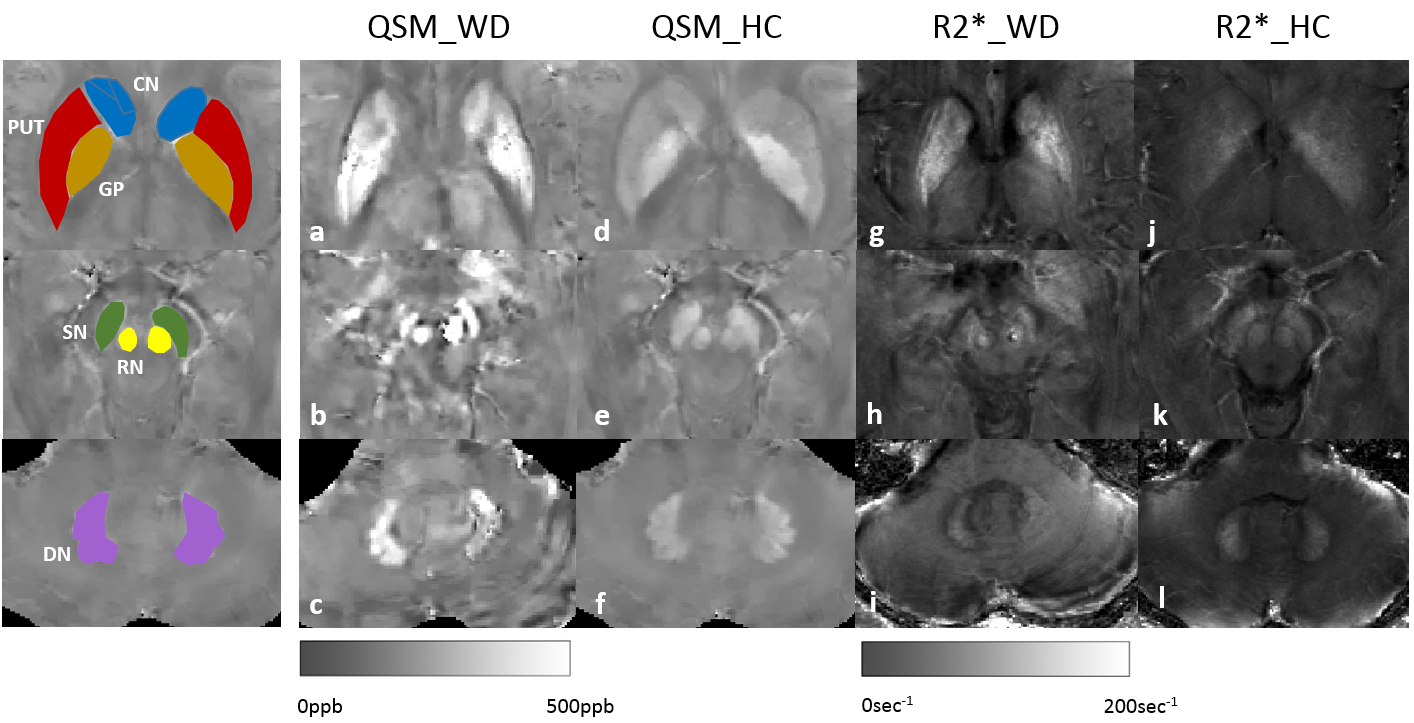
QSM maps were reconstructed using the Morphology Enabled Dipole Inversion with automatic uniform cerebrospinal fluid zero reference (MEDI+0) algorithm 5. R2* mapping was calculated using the magnitude multi-echo GRE data. Regions of interest (ROIs), including the bilateral head of the caudate nucleus (CN), globus pallidus (GP), putamen (PUT), substantia nigra (SN), red nucleus (RN), and dentate nucleus (DN) were drawn manually on the QSM images using ITK-SNAP (http://www.itk-snap.org).
Differences in magnetic susceptibility and R2* values between WD patients and healthy controls were compared using the Mann-Whitney U test. Receiver operating characteristic (ROC) curves were used for assessing the ability of QSM and R2* maps to discriminate WD from HC. All statistical analyses were carried out using IBM SPSS Statistics 23 and MATLAB R2010b (MathWorks, MA, USA) based program.
Results
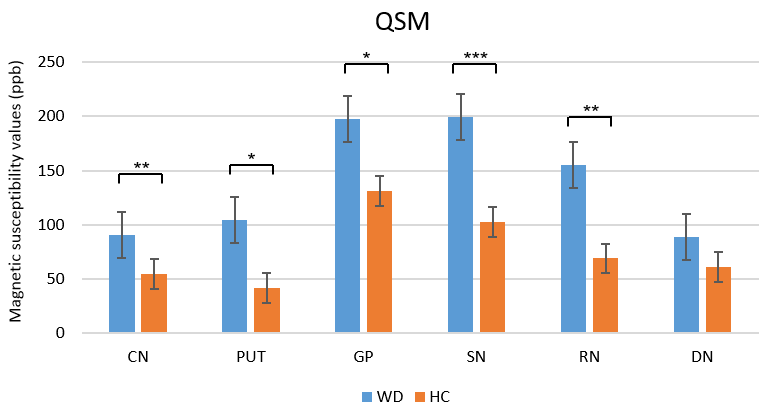
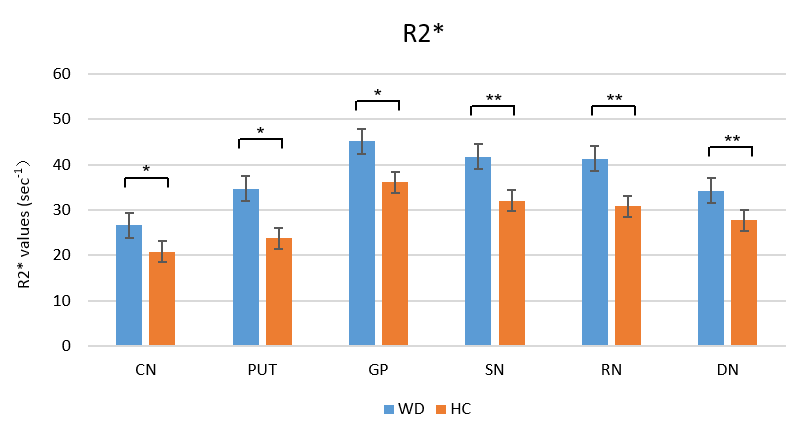
There was high contrast between deep gray matter nuclei and the surrounding tissue; they were better displayed on QSM maps than on R2* maps (Fig.1). The susceptibility values in patients with WD were significantly higher than in healthy controls in the CN (p=0.006), PUT (p=0.012), GP (p=0.010), SN (p<0.001), RN (p=0.001), but not in DN (p=0.141) (Fig. 2). R2* values were significantly higher in the patients with WD than in the healthy controls in the CN (p=0.013), PUT (p=0.012), GP (p=0.035), SN (p=0.009), RN (p=0.005), and DN (p=0.002) (Fig. 3).
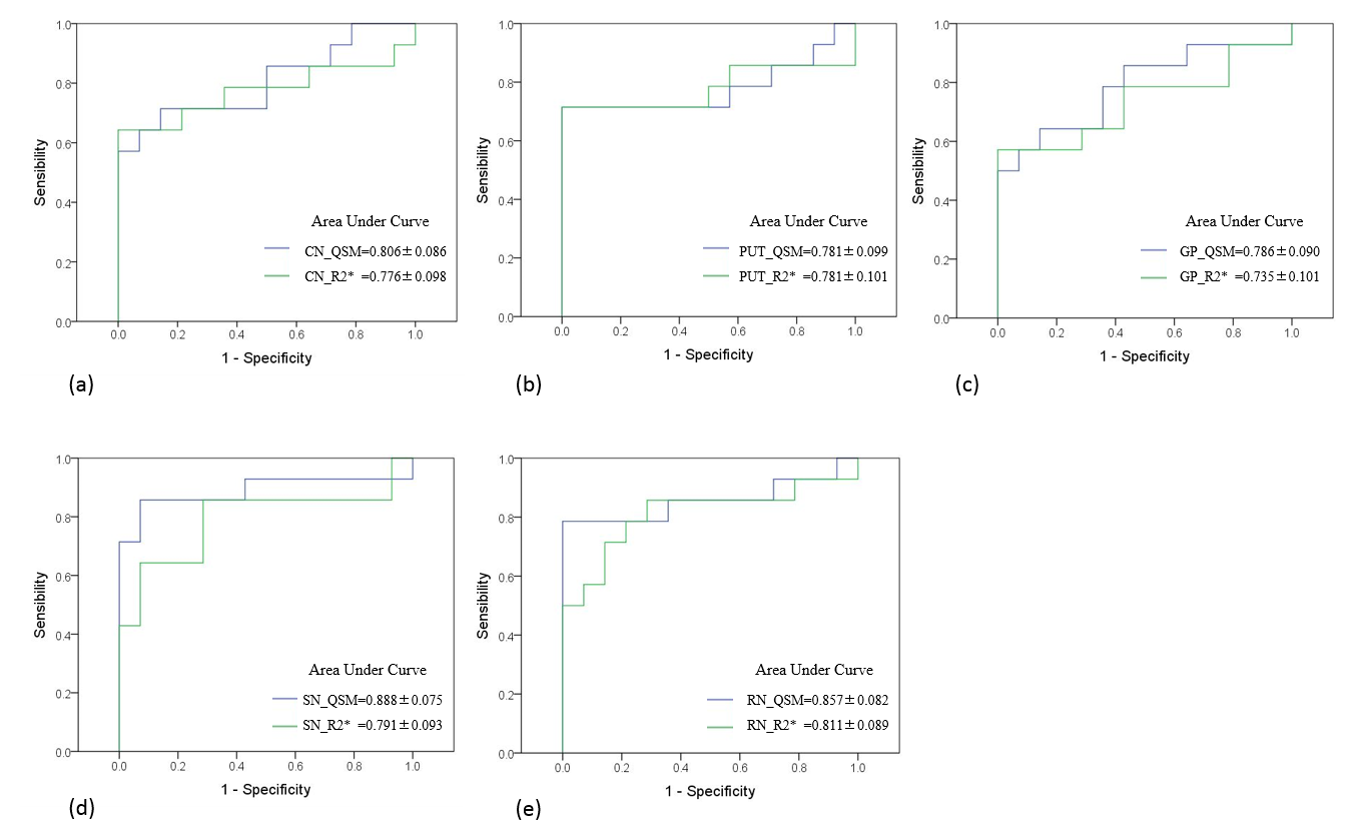
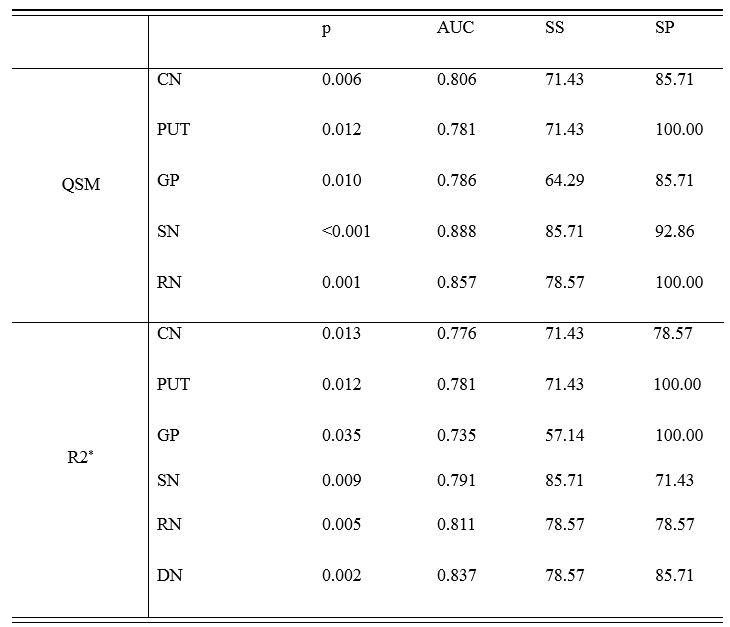
The results of the ROC curve analyses of the QSM and R2* maps between HC and WD are summarized in Table 1. The ROC curves showed that QSM had a greater area under the curve (AUC) than R2* maps in the CN, GP, SN and RN for classifying WD patients (Fig. 4). QSM provided the highest AUC= 0.888 at SN.
Discussion and conclusions
In our study, CN, GP, PUT, SN, and RN in WD patients were hyperintense on QSM images (Fig. 1) and magnetic susceptibility values in these areas were significantly higher than those in healthy controls (Fig. 2). These results are in good agreement with previous studies at 7T 6. Analysis of the R2* maps revealed findings similar to those from the QSM data. From our results, we can conclude there was paramagnetic mineral deposition in most of the gray matter nuclei of WD patients, particularly in SN, RN and CN. The increased susceptibility in the deep gray matter nuclear may be due to higher concentrations of a paramagnetic copper (II) compound or iron deposits 1, 2. Interestingly, we observed a significant difference in DN in R2* maps but not in QSM. Further studies are needed to clarify this result.
In summary, QSM is a more sensitive quantitative technique to detect a significant increase of paramagnetic mineral deposition in WD patients than R2* maps. Furthermore, changes in magnetic susceptibility have the potential to be a marker of WD and can be detected using QSM.
Acknowledgements
This study was supported in part by grants from The National Science Foundation of China (81271533).References
1. Ala A, Walker AP, Ashkan K, Dooley JS, Schilsky ML. Wilson's disease. Lancet 2007;369:397-408.
2. Litwin T, Gromadzka G, Szpak GM, Jablonka-Salach K, Bulska E, Czlonkowska A. Brain metal accumulation in Wilson's disease. J Neurol Sci 2013;329:55-58.
3. Dusek P, Bahn E, Litwin T, et al. Brain iron accumulation in Wilson disease: a post mortem 7 Tesla MRI - histopathological study. Neuropathology and Applied Neurobiology 2017;43:514-532. 4. Liu T, Eskreis-Winkler S, Schweitzer AD, et al. Improved Subthalamic Nucleus Depiction with Quantitative Susceptibility Mapping. Radiology 2013;269:216-223.
5. Liu Z, Spincemaille P, Yao Y, Zhang Y, Wang Y. MEDI+0: Morphology enabled dipole inversion with automatic uniform cerebrospinal fluid zero reference for quantitative susceptibility mapping. Magnetic Resonance in Medicine 2018;79:2795-2803.
6. Fritzsch D, Reiss-Zimmermann M, Trampel R, Turner R, Hoffmann KT, Schafer A. Seven-Tesla Magnetic Resonance Imaging in Wilson Disease Using Quantitative Susceptibility Mapping for Measurement of Copper Accumulation. Invest Radiol 2014;49:299-306.
Figures