4933
Quantitative Susceptibility Mapping using a Deep Learning prior1Cornell University, Ithaca, NY, United States, 2Weill Cornell Medical College, New York, NY, United States
Synopsis
A Bayesian method is proposed by formulating deep learning outcome as a regularization in QSM reconstruction. It enforces the fidelity between the network generated QSM and the measured inhomogeneity field. Preliminary results indicate both quantitative and qualitative improvement over QSM by deep learning alone.
Introduction
Traditional QSM 1 is built on Bayesian inversion framework, where regularization is employed to complement ill posed inverse problem. Although typical L1/L2 regularization in an appropriate domain (image, gradient, wavelet, etc.) is capable of suppressing artifacts from noise amplification, fine structures may be elusive due to intrinsic smoothness or blockiness assumption in traditional regularization. We propose to incorporate deep learning (DL) by means of an L2 regularization and enforce both fidelity to the measured data and the consistency with the DL outcome.Methods
Algorithm: Given the susceptibility map generated by a neural network , we propose to solve the following problem:
$$\chi^{*}=arg\min_{\chi}\parallel w\left( e^{id*\chi} - e^{if} \right) \parallel_2^2 + \lambda_2 \parallel E\left( \chi - \chi_{\phi} \right) \parallel_2^2$$
with $$$w$$$ the noise weighting, $$$d$$$ the dipole kernel, $$$f$$$ the measured tissue field. $$$E$$$ is a high-pass-filter implemented using convolution with a spherical kernel $$$S$$$ of a 10mm radius: $$$E(x) = x - S*x$$$. An L2 regularization is performed on the filtered difference between $$$\chi$$$ and a network generated QSM $$$\chi_{\phi}$$$. Eq. 1 was referred to as MEDI+DL and compared with MEDI 2, a traditional total variation regularized method.
Data acquisition and processing: 20 healthy subjects and 8 patient with Multiple Sclerosis (MS) were scanned at a 3T GE scanner, using a 3D multi-echo GRE sequence (voxel size $$$0.5\times 0.5\times 3 mm^3$$$, field of view 24cm, TE 4.8ms, number of echoes 8, TR 49ms, number of slices $$$50\sim 60$$$, bandwidth 62.5 kHz, matrix size $$$512\times 512\times 50\sim 60$$$). The local tissue field was estimated through multi-echo phase fitting 3, phase unwrapping 4 and background field removal 5. 4 of 20 healthy subjects were scanned with voxel size $$$1\times 1\times 1mm^3$$$at 5 orientations for COSMOS 6 reconstruction.
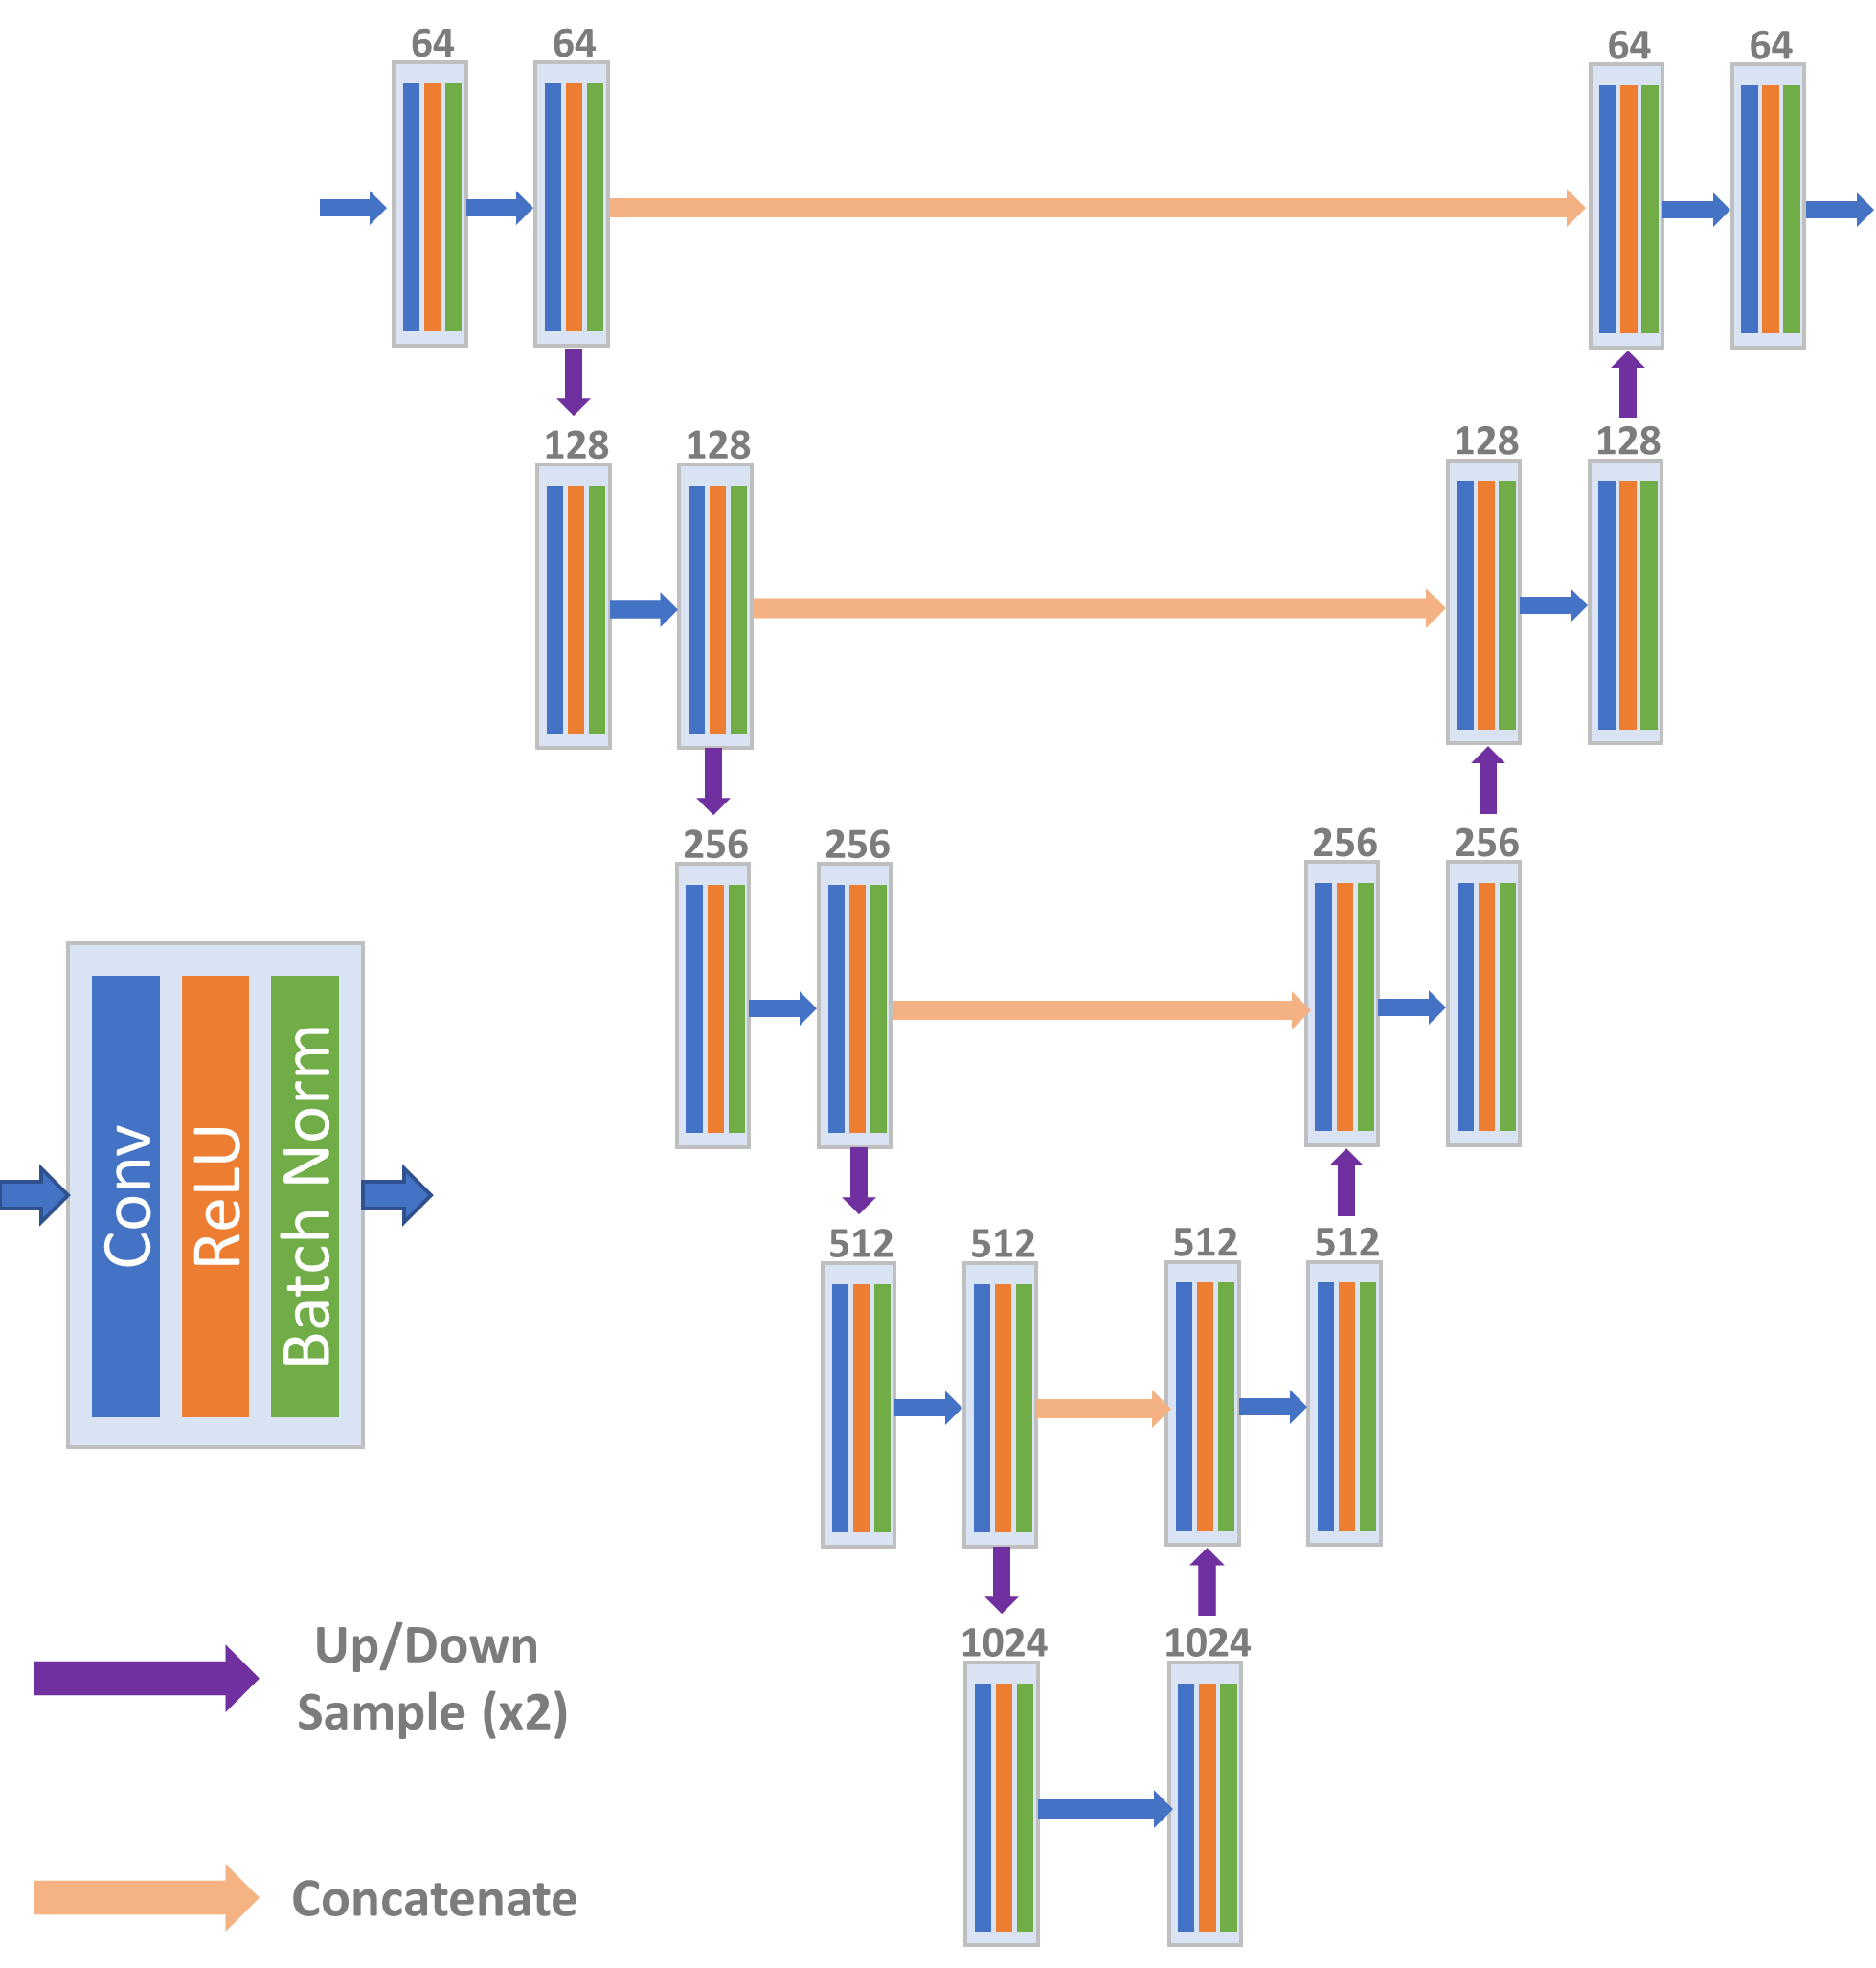
Network: U-Net 7 was chosen as the structure for $$$\phi$$$, with detailed parameters in Figure 1. A total of 4199 patches with size $$$128\times 128\times 24$$$ were extracted from 20 healthy subjects and split into training/validation/test dataset by the ratio 0.7/0.1/0.2. The network was then trained for mapping from tissue field $$$f$$$ to QSM by minimizing the L1 difference between its output and a target QSM reconstructed by MEDI. Optimizer was Adam 8 with learning rate 0.001 and epoch 80. Training and inference were performed on 4 GTX TITAN XP GPUs (12GB each).
Analysis: Subcortical gray matters (SGM) were segmented and measured by the mean susceptibility within each region for globus pallidus (GP), putamen (PU) and caudate nucleus (CN). Susceptibilities of MS lesion were also measured in manually drawn ROIs, referenced to contralateral normal appearing white matter (NAWM) and used to quantify the agreement between different methods using linear regression and Bland-Altman analysis.
Results
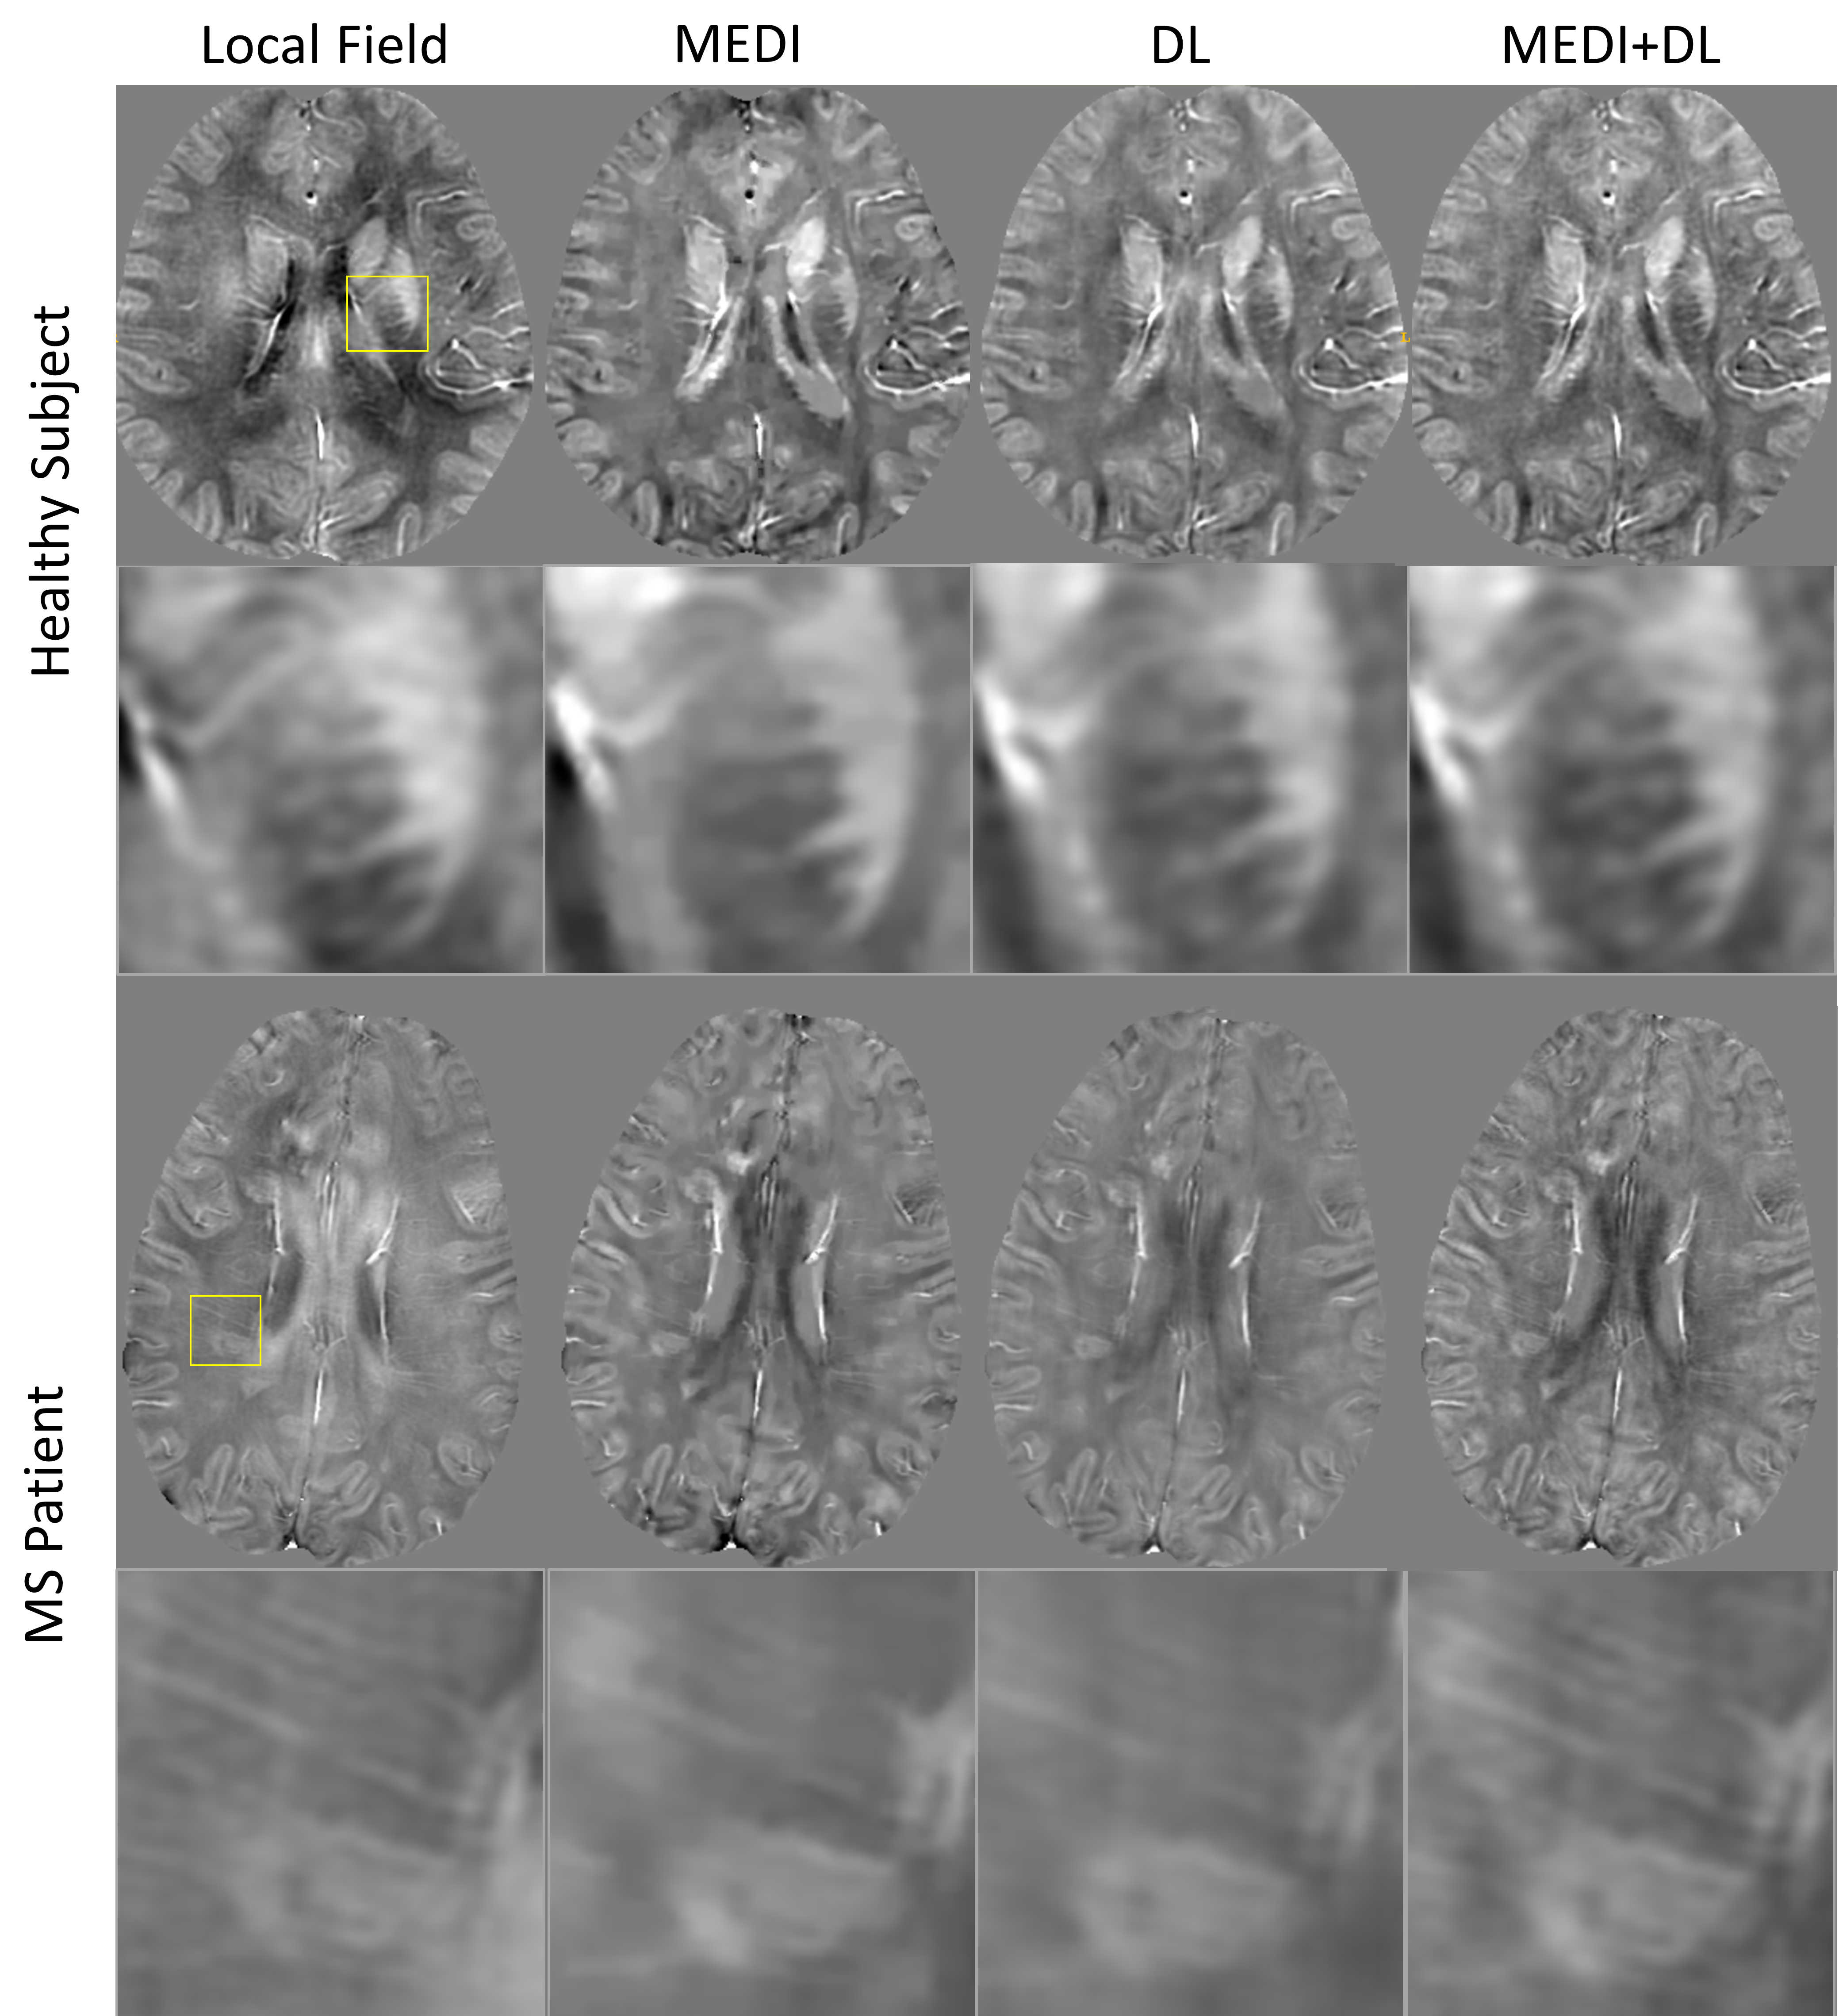
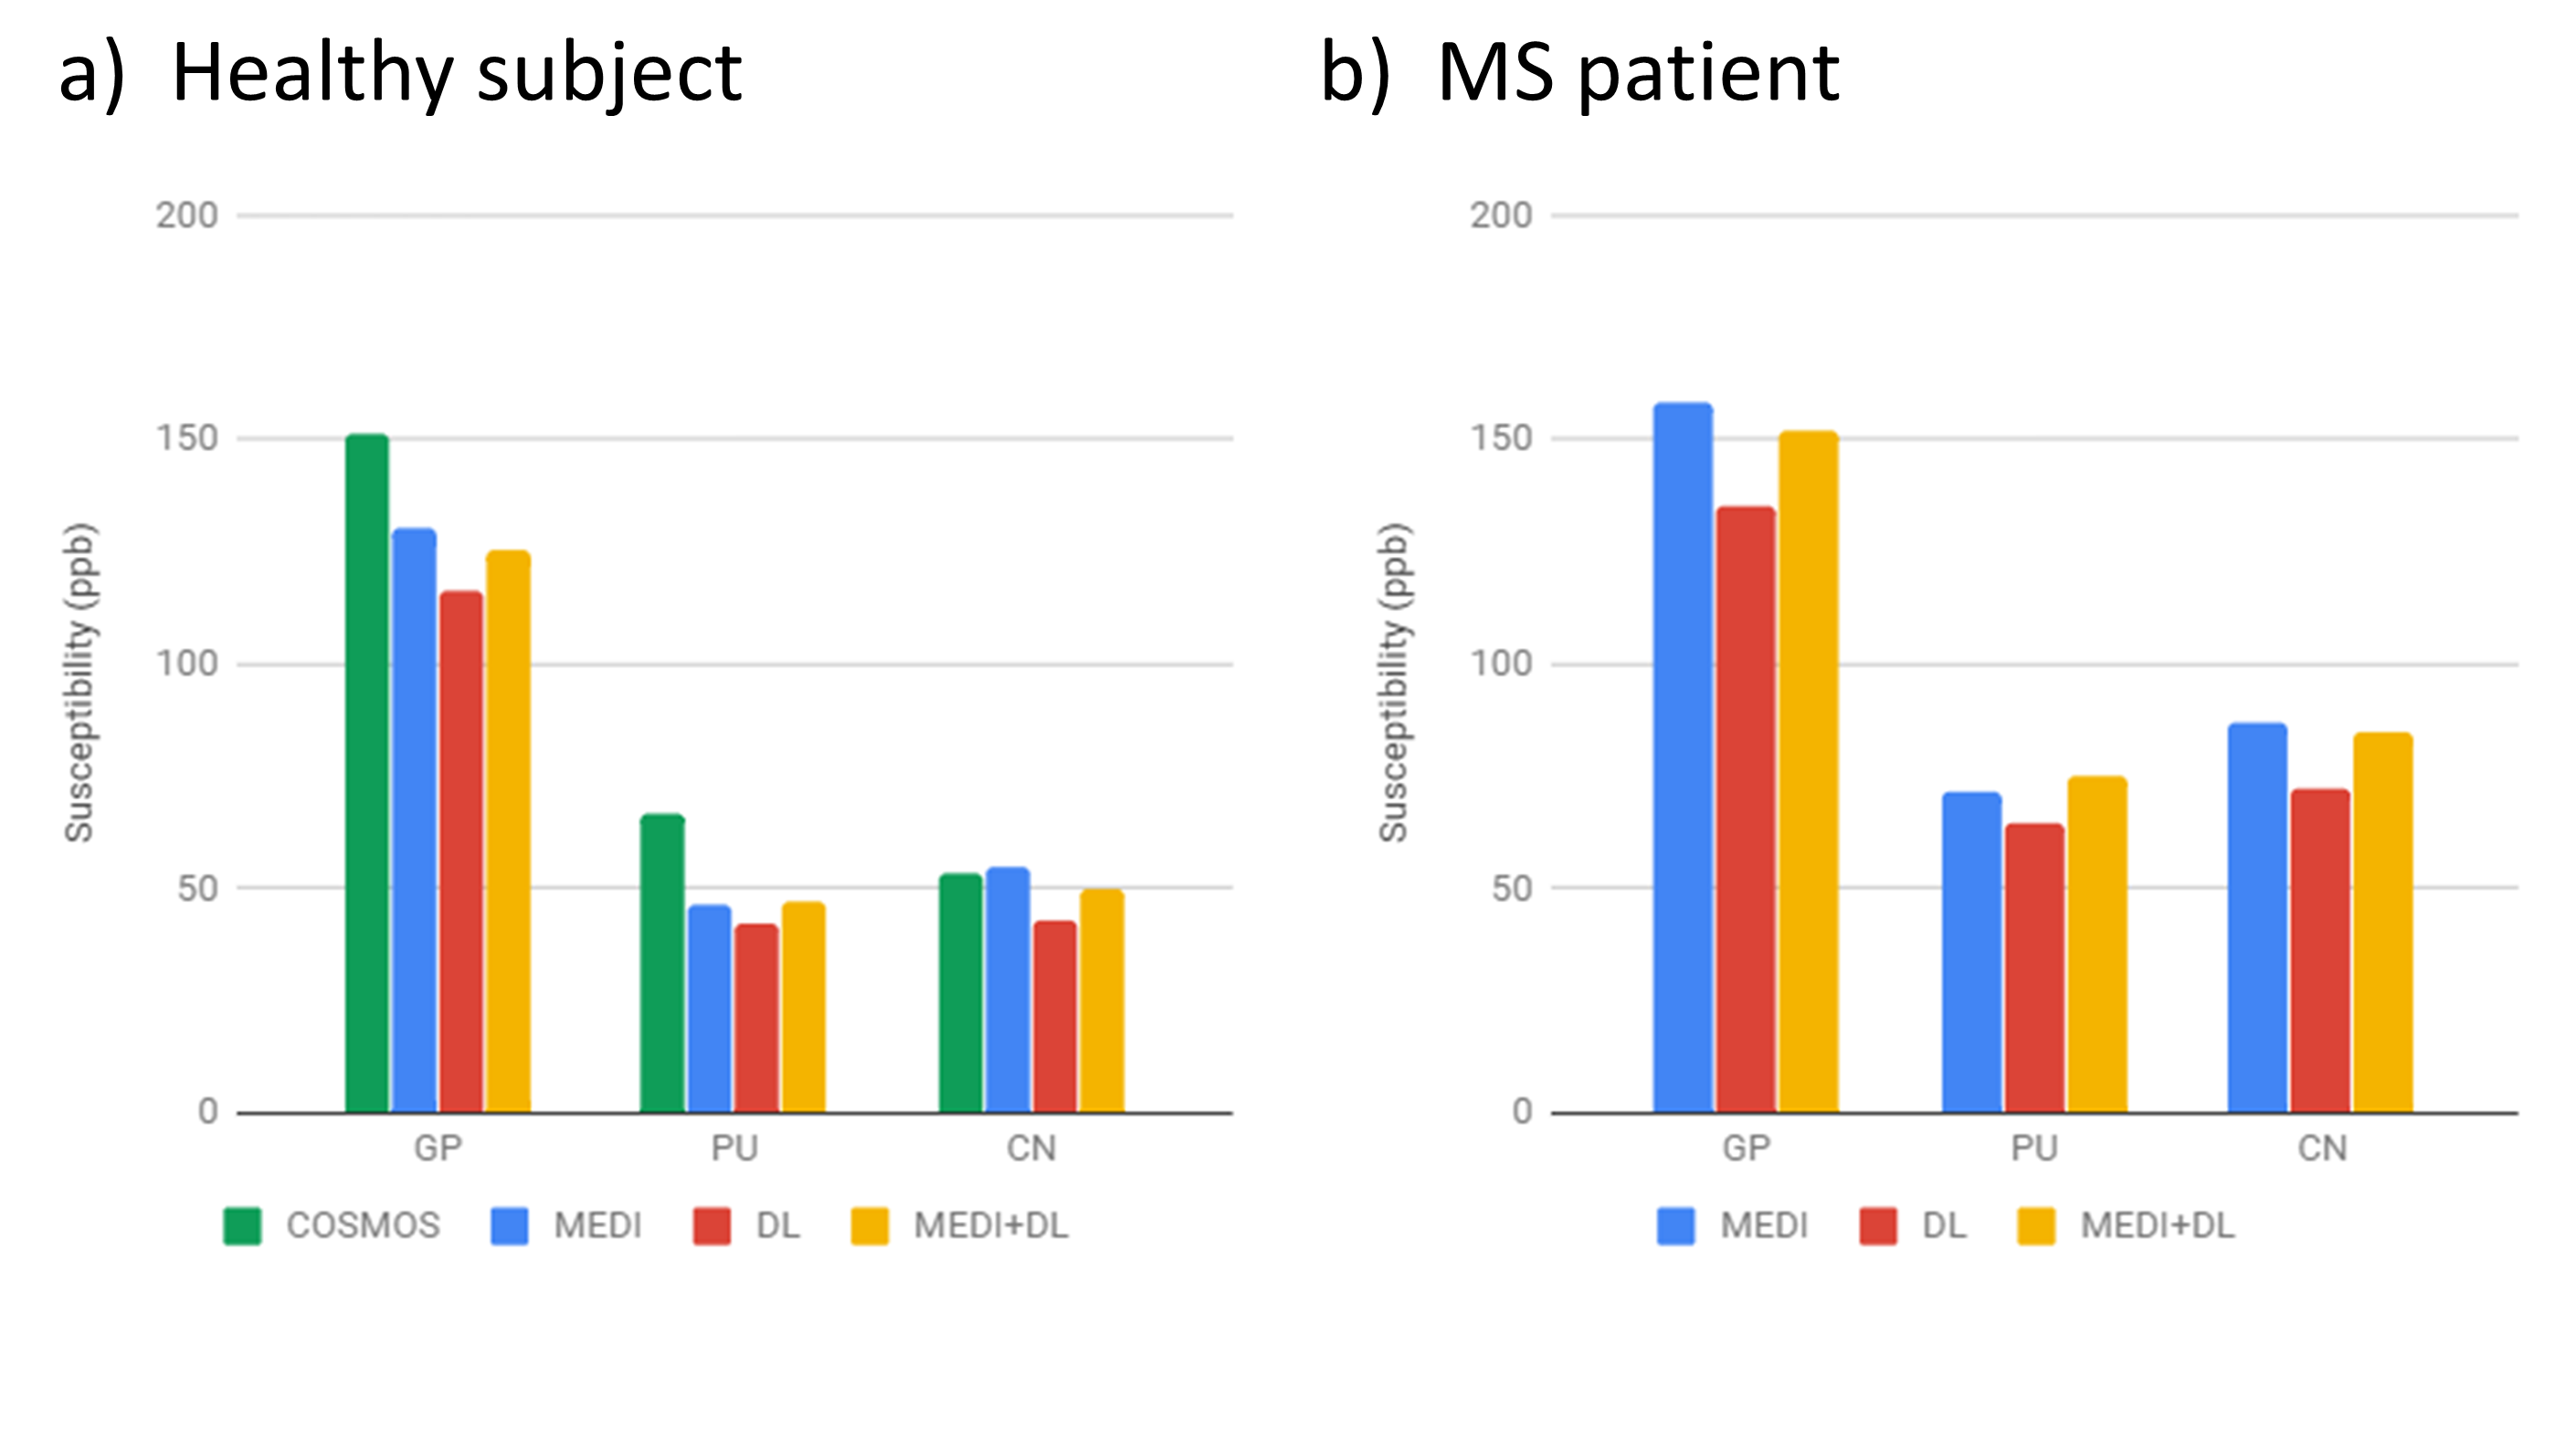
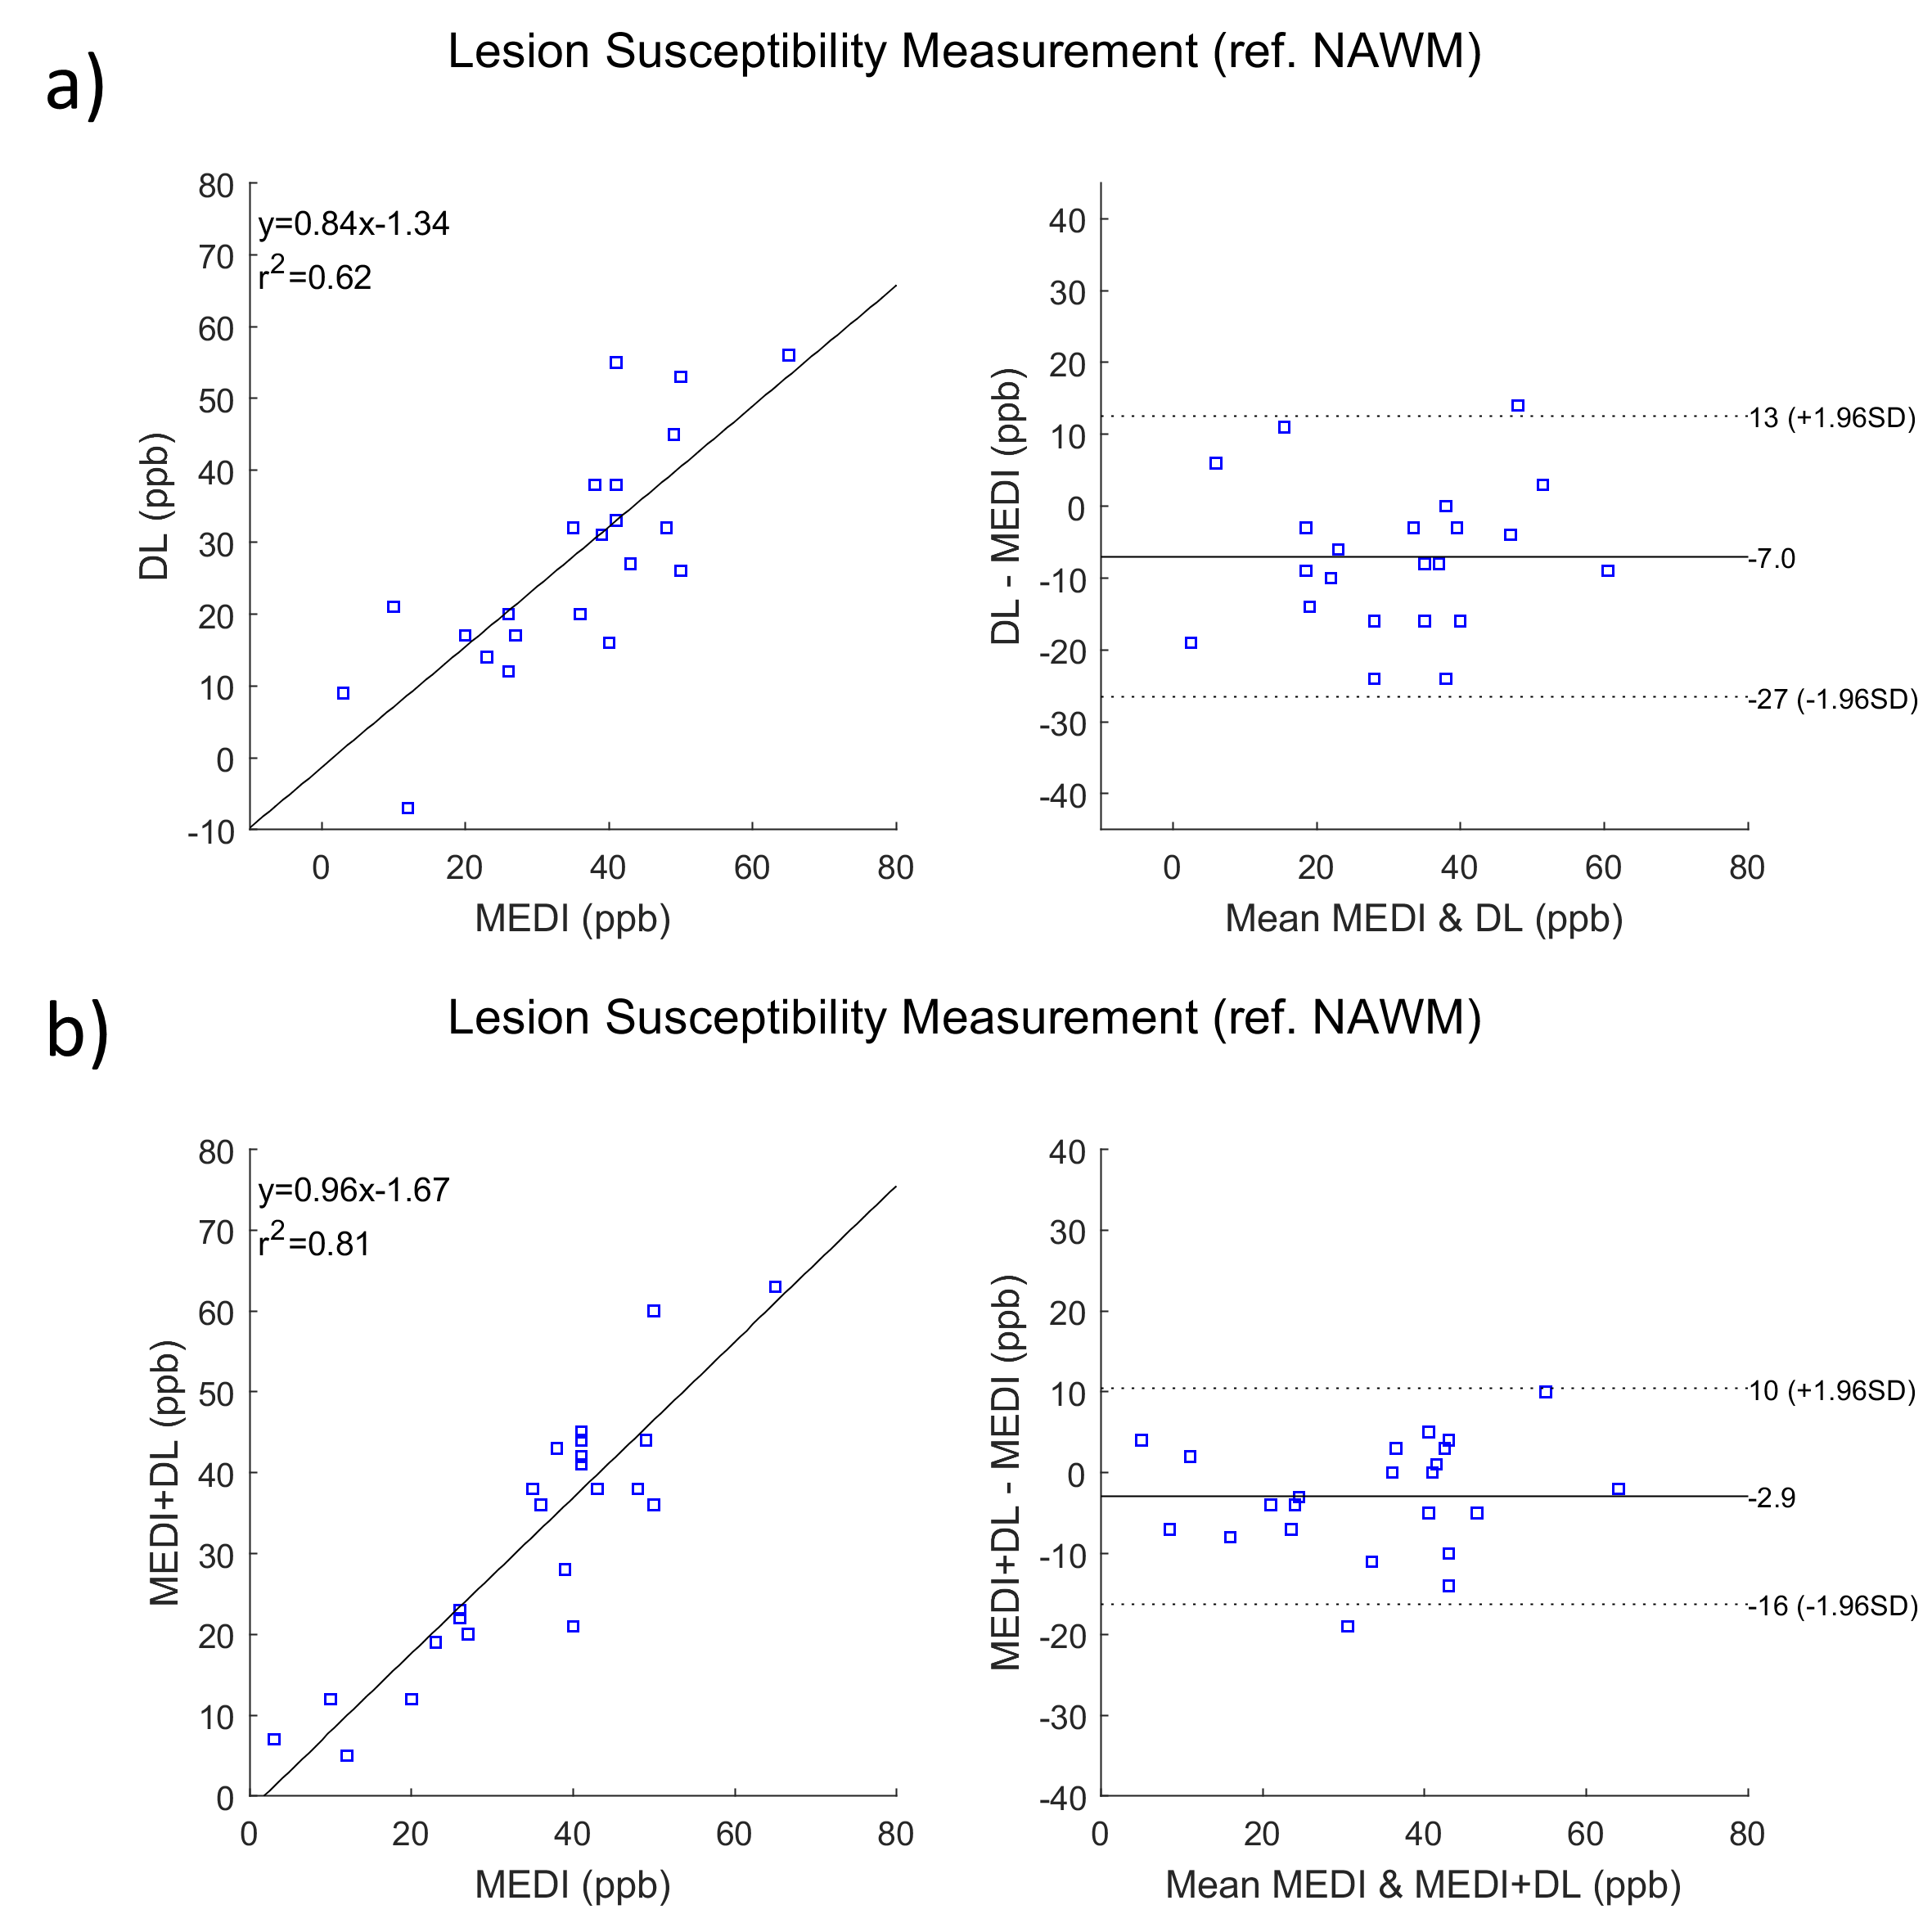
A comparison of QSM was shown in Figure 2. In both healthy subject and patient, the MEDI+DL outperformed MEDI or DL in depicting subtle veins at corpus callosum. SGM measurements were compiled in Figure 3. Compared to MEDI, the measurement by MEDI+DL maintained a difference of $$$-6\sim 3$$$ ppb, whereas DL underestimated more than -12ppb for GP and CN. Using COSMOS as the reference for healthy subjects, the relative susceptibility difference was (GP -14%, PU -30%, CN 3%) for MEDI, (GP -23%, PU -36%, CN -20%) for DL and (GP -17%, PU -29%, CN -7%) for MEDI+DL. Figure 4 indicated a better correlation ($$$R^2=0.81$$$), a smaller bias (-2.9 ppb) and narrower limits of agreement ([-16, 10] ppb) between MEDI and MEDI+DL, compared to those between MEDI and DL.Discussion and conclusion
We enforce data fidelity upon the outcome of a feed-forward neural network. Results suggest this produces more consistent quantification with the golden standard COSMOS. By replacing total variation with an L2 penalization with respect to the network outcome, the proposed method achieves superior contrasts for fine structures such as veins.Acknowledgements
The current work is supported by NIH grant R01 NS095562, R01 NS090464, S10 OD021782, and R01 CA181566.References
[1]. Kee Y, Liu Z, Zhou L, Dimov A, Cho J, de Rochefort L, Seo JK, Wang Y. Quantitative Susceptibility Mapping (QSM) Algorithms: Mathematical Rationale and Computational Implementations. IEEE Transactions on Biomedical Engineering 2017.
[2]. Liu T, Wisnieff C, Lou M, Chen W, Spincemaille P, Wang Y. Nonlinear formulation of the magnetic field to source relationship for robust quantitative susceptibility mapping. Magnetic Resonance in Medicine 2013;69(2):467-476.
[3]. Kressler B, de Rochefort L, Liu T, Spincemaille P, Jiang Q, Wang Y. Nonlinear regularization for per voxel estimation of magnetic susceptibility distributions from MRI field maps. IEEE transactions on medical imaging 2010;29(2):273-281.
[4]. Dong J, Liu T, Chen F, Zhou D, Dimov A, Raj A, Cheng Q, Spincemaille P, Wang Y. Simultaneous Phase Unwrapping and Removal of Chemical Shift (SPURS) Using Graph Cuts: Application in Quantitative Susceptibility Mapping. Medical Imaging, IEEE Transactions on 2015;34(2):531-540.
[5]. Liu T, Khalidov I, de Rochefort L, Spincemaille P, Liu J, Tsiouris AJ, Wang Y. A novel background field removal method for MRI using projection onto dipole fields (PDF). NMR in biomedicine 2011;24(9):1129-1136.
[6]. Liu T, Spincemaille P, de Rochefort L, Kressler B, Wang Y. Calculation of susceptibility through multiple orientation sampling (COSMOS): a method for conditioning the inverse problem from measured magnetic field map to susceptibility source image in MRI. Magnetic Resonance in Medicine 2009;61(1):196-204.
[7]. Ronneberger O, Fischer P, Brox T. U-net: Convolutional networks for biomedical image segmentation. 2015. Springer. p 234-241.
[8]. Kingma DP, Ba J. Adam: A method for stochastic optimization. arXiv preprint arXiv:14126980 2014.
Figures