4930
Evaluating the Relationship Between the Venous Magnetic Susceptibility ($$$\chi$$$) and $$$R_2^*$$$ of Brain Arteriovenous Malformations (AVMs)1Medical Physics and Biomedical Engineering, University College London, London, United Kingdom, 2Neuroradiological Academic Unit, UCL Institute of Neurology, University College London, London, United Kingdom, 3Leonard Wolfson Experimental Neurology Centre, UCL Institute of Neurology, University College London, London, United Kingdom
Synopsis
Arteriovenous malformations (AVMs) are characterised by arteriovenous shunting, which increases oxygenation in the veins draining the AVM compared to healthy veins. In healthy veins, a quadratic relationship is expected between the transverse relaxation rate ($$$R_2^*$$$) and the magnetic susceptibility ($$$\chi$$$). By calculating $$$\chi$$$ and $$$R_2^*$$$ we investigated whether this relationship holds in the AVM draining veins and superior sagittal sinuses of fourteen patients. We found a significant positive correlation between $$$R_2^*$$$ and $$$\chi^2$$$ in the healthy veins, but not in the AVM draining veins where the quadratic relationship is disrupted and $$$\chi$$$ values can be used to measure oxygenation.
Introduction
AVMs are characterised by arteriovenous shunting through a network of coiled and tortuous vessels called a nidus1. AVMs are detectable on MRI susceptibility mapping (SM) images2. Moreover, compared to healthy veins, $$$\chi$$$ is significantly lower in AVM draining veins, reflecting the increased oxygen content of arterial blood shunted into them3.
The apparent transverse relaxation rate ($$$R_2^*$$$) indirectly reflects the field perturbation induced by tissue $$$\chi$$$. $$$R_2^*$$$ is faster to calculate than $$$\chi$$$, as it requires fitting an exponential time decay as opposed to solving an ill-posed inverse problem. In this study, we aimed to investigate whether $$$R_2^*$$$ can reveal the same information about AVM draining vein oxygenation as $$$\chi$$$3. In vitro experiments have shown4 that venous $$$R_2^*$$$ is proportional to the square of the $$$\chi$$$ shift between veins and plasma: $$R_2^*\propto\chi^2_{vein-plasma}\quad[1]$$
Because $$$\chi_{plasma}\simeq\chi_{water}$$$5, venous $$$\chi$$$ measured in vivo using SM should also fulfil Equation [1].
Here, we evaluated the relationship described in Eq. [1] in both healthy veins and AVM draining veins. We also investigated whether $$$R_2^*$$$ and $$$\chi$$$ in an AVM’s draining veins are related to AVM nidus size, as this may determine the amount of blood shunted through the AVM and, therefore, the oxygenation of AVM draining veins.
Methods
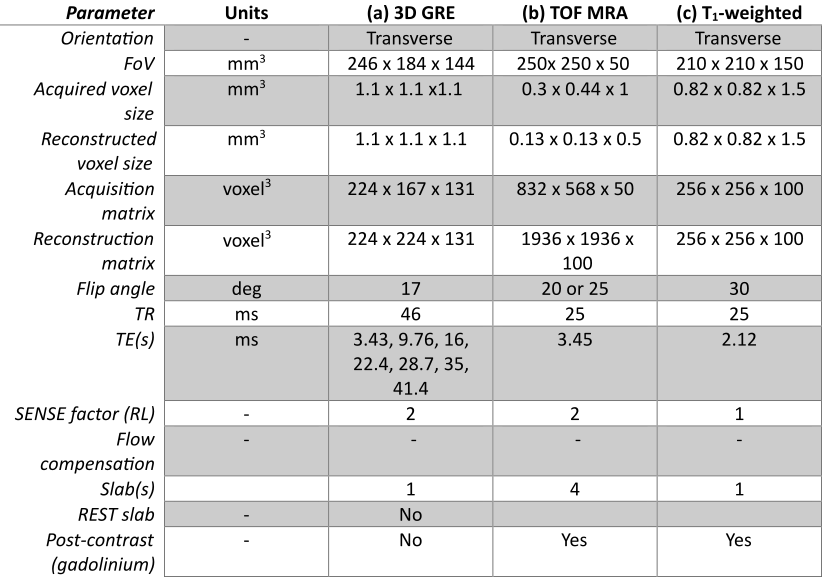
Fifteen subjects (average age: 38 years, five women) with a brain AVM underwent MRI with the protocols listed in Figure 1. Three subjects had been treated using partial glue embolization1. In fourteen subjects, the nidus size was measured on gold-standard digital subtraction angiography.
For each subject, $$$\chi$$$ was calculated using a previously optimised SM processing pipeline3. $$$R_2^*$$$ was calculated by linearly fitting the logarithm of the mono-exponential magnitude time decay with a method robust to strong field gradients6, which may occur near an AVM due to haemosiderin deposits from previous haemorrhages or if the AVM is near air-filled regions, e.g., the nasopharyngeal sinuses. One subject (05) was discarded from further analysis because, in and around the nidus, the $$$R_2^*$$$ and $$$\chi$$$ images had large artifacts probably associated with a glue embolisation.
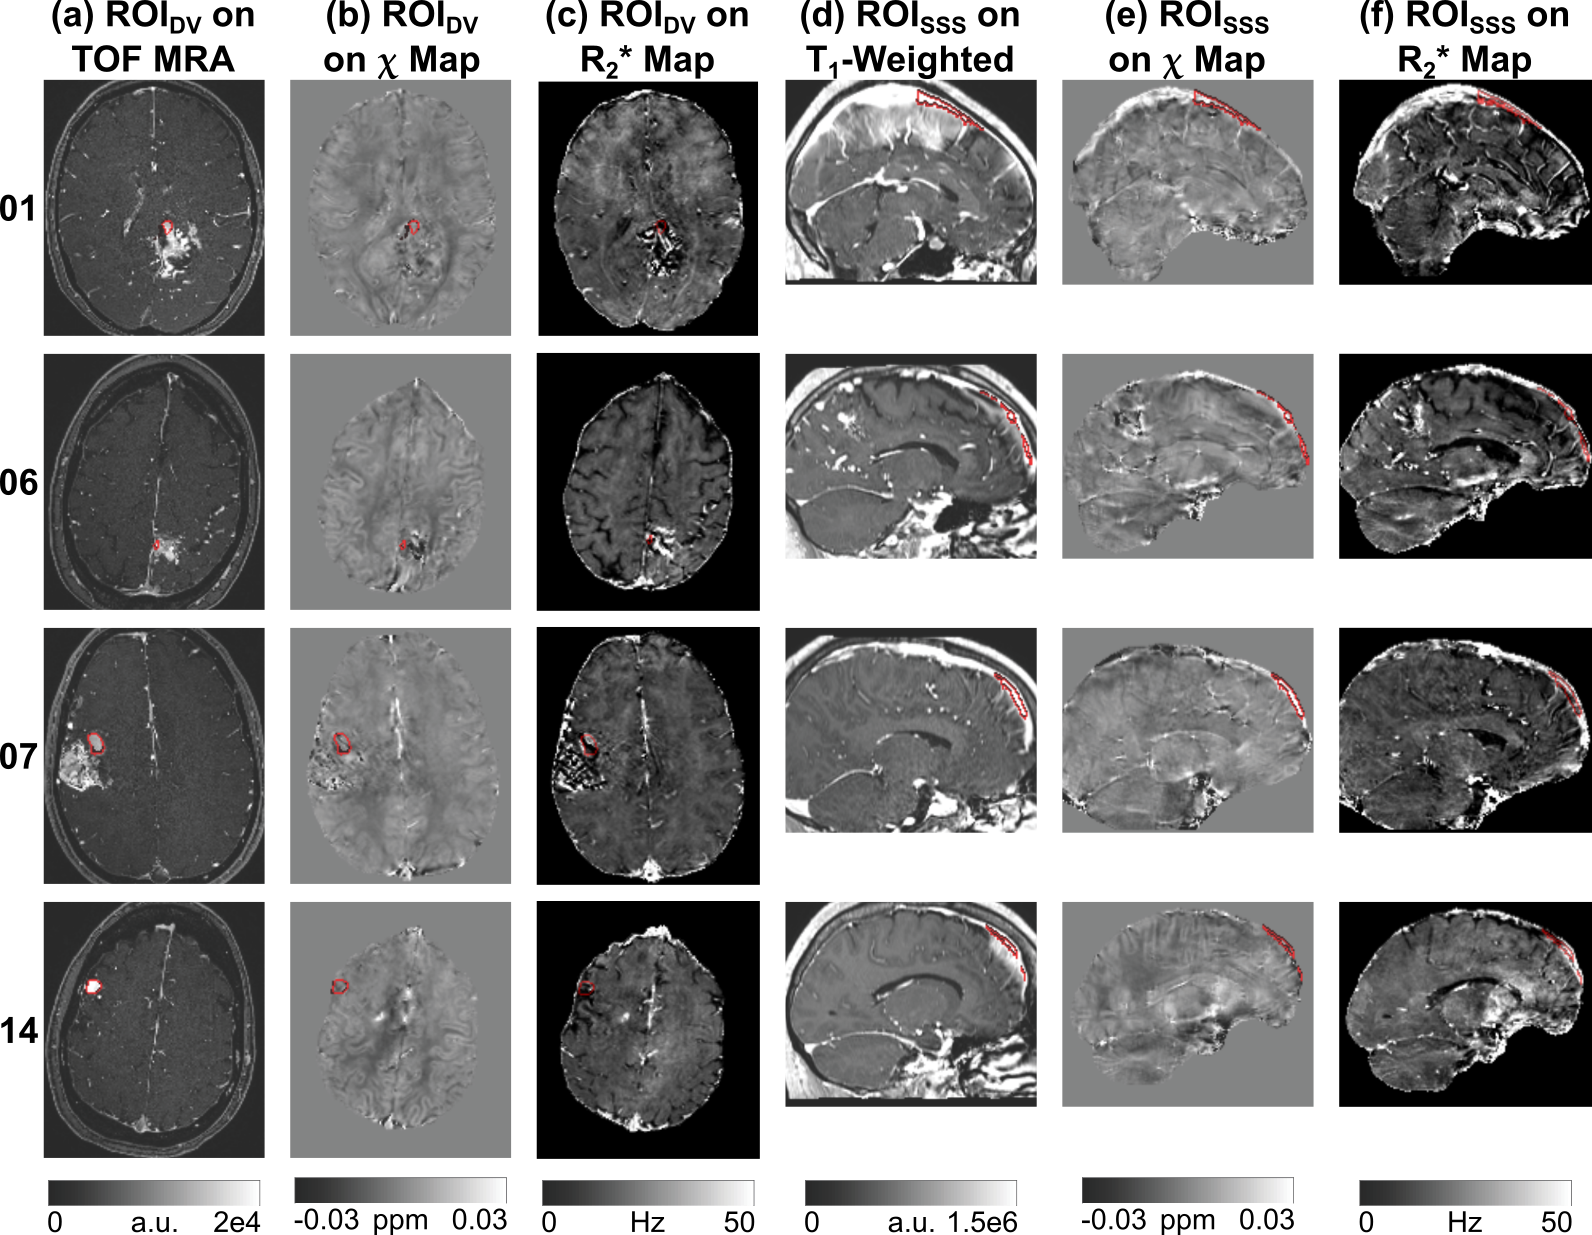
Two venous ROIs were delineated in each patient using ITK-Snap7: ROIDV was drawn based on the TOF MRA image on the largest vein exiting the AVM nidus; ROISSS was drawn on the T1-weighted image on a portion of the superior sagittal sinus (SSS) that could be regarded as healthy because it did not drain blood from the AVM. ROISSS and ROIDV were coregistered to the corresponding $$$\chi$$$ map using NiftyReg8,9.
For all subjects and ROIs, the average and standard deviation (SD) of $$$\chi$$$ and $$$R_2^*$$$ were calculated, along with the global means and SDs of $$$\chi$$$ and across subjects. Spearman’s correlation was calculated between $$$\chi^2$$$ and $$$R_2^*$$$ (Eq. [1]). In ROIDV, Spearman’s correlation was calculated between the means of $$$\chi$$$ and $$$R_2^*$$$ and the size of the AVM nidus.
Results and Discussion
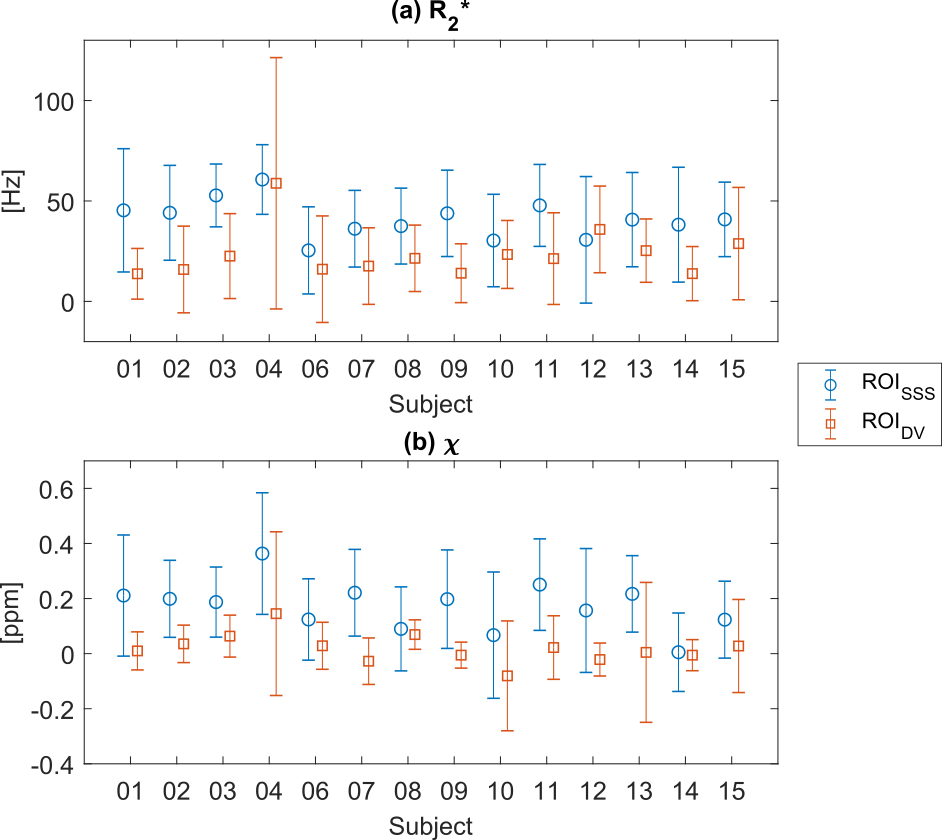
Figure 2 shows ROISSS and ROIDV on the$$$\chi$$$, $$$R_2^*$$$, TOF MRA and T1-weighted images for four representative subjects. In each subject, except subject 12, the average $$$R_2^*$$$ value was larger in ROISSS than in ROIDV (Figure 3a).
In each subject, the average $$$\chi$$$ value was larger in ROISSS than in ROIDV (Figure 3b). This was reflected in the global means of $$$R_2^*$$$ and $$$\chi$$$ (± SD) being larger in ROISSS ($$$R_2^*$$$: 41±9.3 Hz; $$$\chi$$$: 0.17±0.09 ppm) than in ROIDV ($$$R_2^*$$$: 23.5±11.2 Hz; $$$\chi$$$: 0.02±0.06 ppm). These results are consistent with increased oxygenation in the AVM draining pattern.
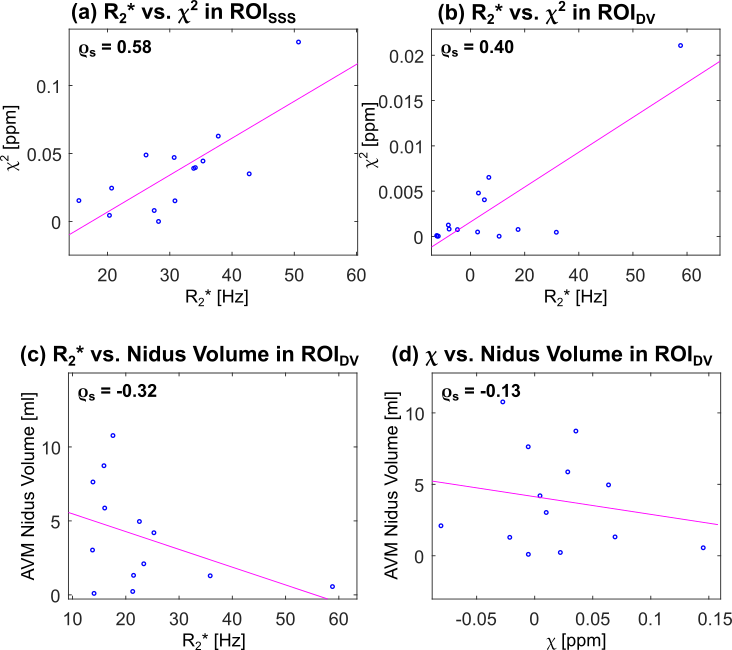
In ROISSS, there was a significant (p=0.03) positive correlation between $$$R_2^*$$$ and $$$\chi^2$$$ (Figure 4a). This result is in line with Eq. [1]. A weak positive correlation was also observed in ROIDV (Figure 4b).
The correlations between the volume of the AVM nidus and both $$$R_2^*$$$ and $$$\chi$$$ were not significant (Figures 4c and d), indicating that the size of the AVM nidus alone is insufficient to characterise blood oxygenation in AVM draining veins
Conclusions
Although the expected quadratic relationship between $$$\chi$$$ and $$$R_2^*$$$ holds in the healthy SSS, it is disrupted in AVM draining veins. This may be related to the decrease in the average $$$\chi$$$ and $$$R_2^*$$$ relative to healthy veins where $$$R_2^*$$$ originates mainly from microscopic $$$\chi$$$ gradients between deoxygenated red blood cells and plasma4,10. These gradients are negligible in highly oxygenated fast-flowing arterialised blood in AVM draining veins, disrupting the quadratic relationship between $$$R_2^*$$$ and $$$\chi$$$. Therefore, although $$$R_2^*$$$ provides some qualitative information on physiological changes in AVM draining veins, it cannot replace the quantitative values from SM which directly reflect the increased oxygenation in AVM draining veins.Acknowledgements
No acknowledgement found.References
- Friedlander, R. M. Arteriovenous Malformations of the Brain. N. Engl. J. Med. 356, 2704–2712 (2007).
- Biondetti, E. et al. Susceptibility Mapping Reveals Inter-Hemispheric Differences in Venous Density in Patients with Brain Arteriovenous Malformations. in Proc. Intl. Soc. Mag. Reson. Med. 1954 (2017).
- Biondetti, E., Rojas Villabona, A., Jäger, H. R., Thomas, D. L. & Shmueli, K. Magnetic Susceptibility Mapping Reveals Altered Vein Oxygenation in Patients with Brain Arteriovenous Malformations: A Preliminary Study. in Proc. Intl. Soc. Mag. Reson. Med. 4809 (2018).
- Spees, W. M., Yablonskiy, D. A., Oswood, M. C. & Ackerman, J. J. H. Water proton MR properties of human blood at 1.5 Tesla: Magnetic susceptibility, T1, T2*, T2, and non-Lorentzian signal behavior. Magn. Reson. Med. 45, 533–542 (2001).
- Weisskoff, R. M. & Kiihne, S. MRI susceptometry: image-based measurement of absolute susceptibility of MR contrast agents and human blood. Magn. Reson. Med. 24, 375–383 (1992).
- Storey, P., Lui, Y. W. & Novikov, D. S. Artifact-free T2* mapping without post hoc corrections. in Proc. Intl. Soc. Mag. Reson. Med. 0442 (2015).
- Yushkevich, P. A. et al. User-guided 3D active contour segmentation of anatomical structures: Significantly improved efficiency and reliability. Neuroimage 31, 1116–1128 (2006).
- Ourselin, S., Roche, A., Subsol, G., Pennec, X. & Ayache, N. Reconstructing a 3D structure from serial histological sections. Image Vis. Comput. 19, 25–31 (2001).
- Modat, M. et al. Fast free-form deformation using graphics processing units. Comput. Methods Programs Biomed. 98, 278–284 (2010).
- Thulborn, K. R., Waterton, J. C.,
Matthews, P. M. & Radda, G. K. Oxygenation dependence of the transverse
relaxation time of water protons in whole blood at high field. BBA - Gen.
Subj. 714, 265–270 (1982).
Figures