4929
Investigation of quantitative susceptibility mapping (QSM) in diagnosis of tuberous sclerosis complex (TSC) and assessment of associated brain injuries at 1.5 Tesla1Baoji Center Hospital, Baoji, China, 2GE Healthcare China, Beijing, China
Synopsis
Tuberous sclerosis complex (TSC) often progress to serious clinical consequences which
had close relationship with cortical/subcortical tubers and white matter
lesions. Quantitative susceptibility mapping (QSM) is capable of quantitatively measure the
susceptibility.
However, little is known about the susceptibility changes
of brain damage caused by TSC. This study aims
to investigated the diagnostic value
of QSM in TSC. Our results suggest that QSM can shown subependymal calcified nodules and provided the quantitative information of white
matter damage.
So, QSM sequence may have a
complementary role in the conventional
MRI evaluation of tuberous sclerosis patients.
Introduction
Tuberous sclerosis complex (TSC) often progress to serious clinical consequences which had close relationship with cortical/subcortical tubers and white matter lesions. Quantitative susceptibility mapping (QSM) is capable of quantitatively measure the susceptibility. However, little is known about the susceptibility changes of brain damage caused by TSC. This study aims to investigated the diagnostic value of QSM in TSC. Our results suggest that QSM can shown subependymal calcified nodules and provided the quantitative information of white matter damage. So, QSM sequence may have a complementary role in the conventional MRI evaluation of tuberous sclerosis patients.Methods
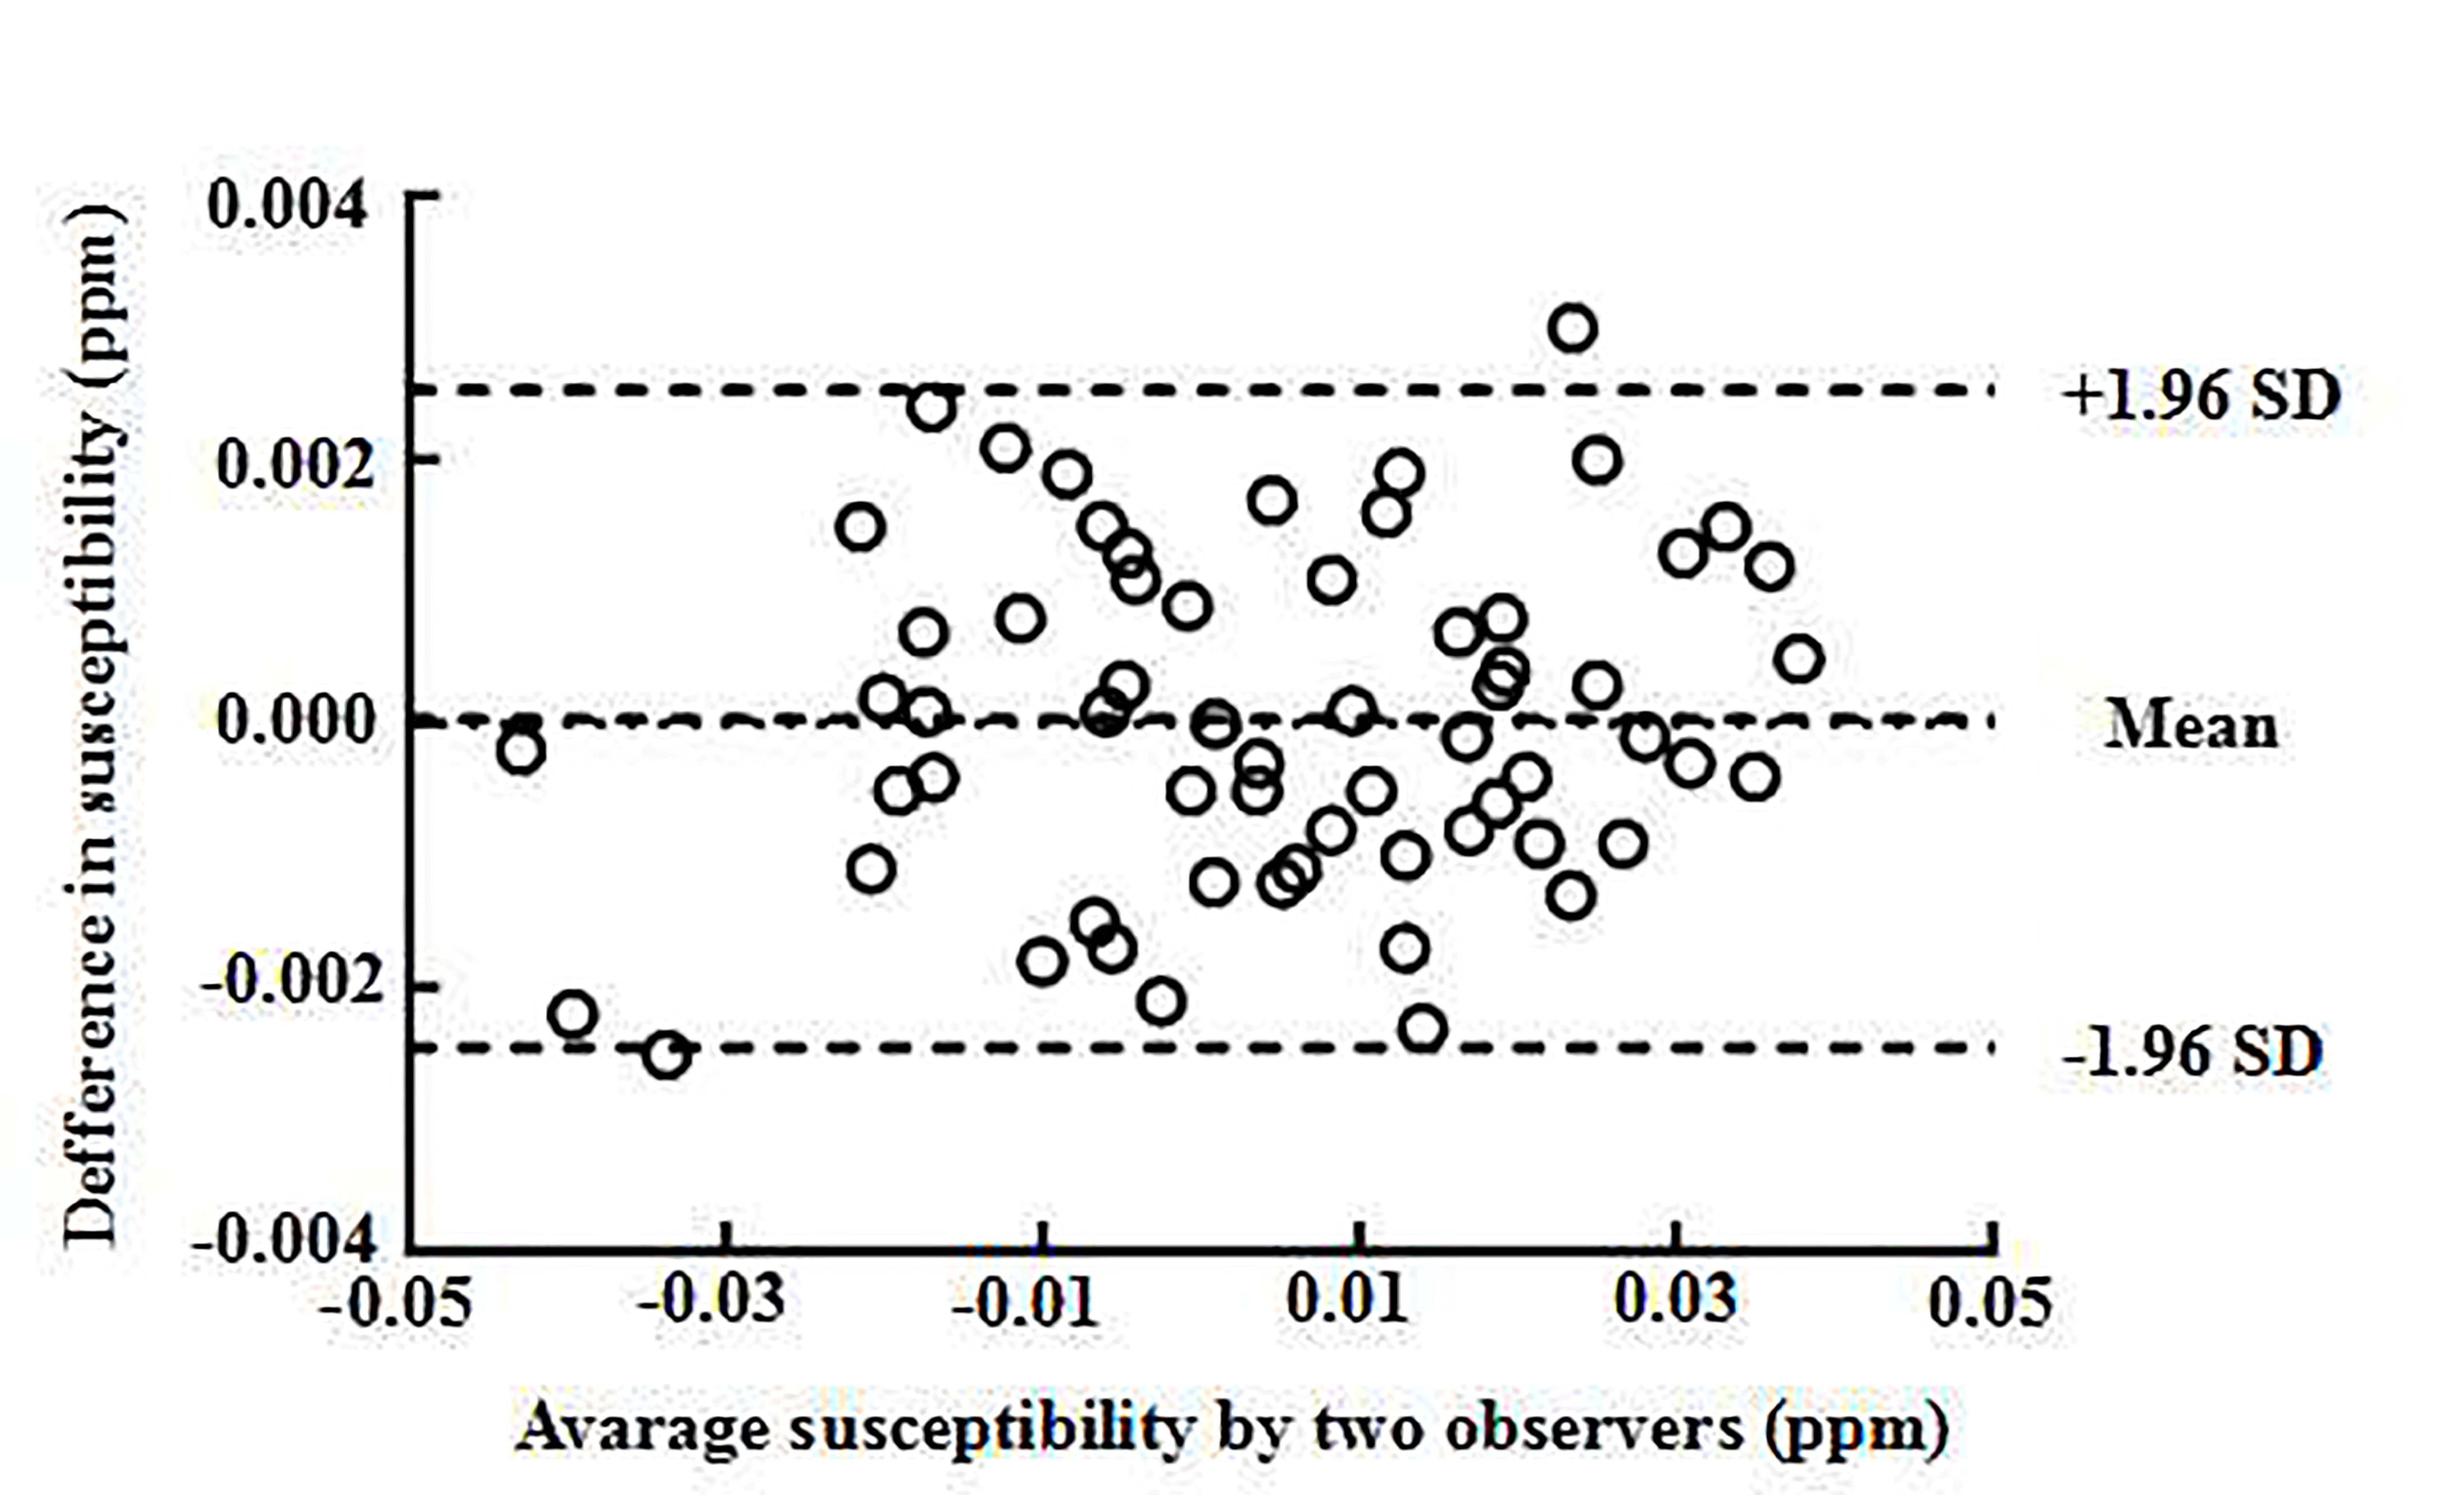
Seven clinical confirmed TSC patients were enrolled in this retrospective study (three males, age 12 - 33). Eight gender and age matched healthy subjects were recruited as control group (four males, age 12 - 27). All the participants underwent conventional MRI sequences consistingT1w, T2w, T2-FLARE, diffusion tensor imaging (DTI) and a multi-echo gradient echo sequence for QSM calculation. The TSC patients further underwent computed tomography (CT) scan. The amount and density of subependymal nodules were obtained based on conventional MR sequences, QSM and CT separately. The detection rates of subependymal nodules using conventional MR images, CT and QSM were tested by Chi square test; Bland-Altman analysis was used to examine the inter-rater consistency of the susceptibility values of cortical/subcortical regions in TSC patients and control subjects measured by two observers; independent t test was performed to compare the susceptibility from QSM and fractional anisotropy (FA) values from DTI between the patient and control groups; pearson correlation was performed to examine the correlation between the susceptibility and FA values of cortical/subcortical regions in TSC patients and control subjects.Results
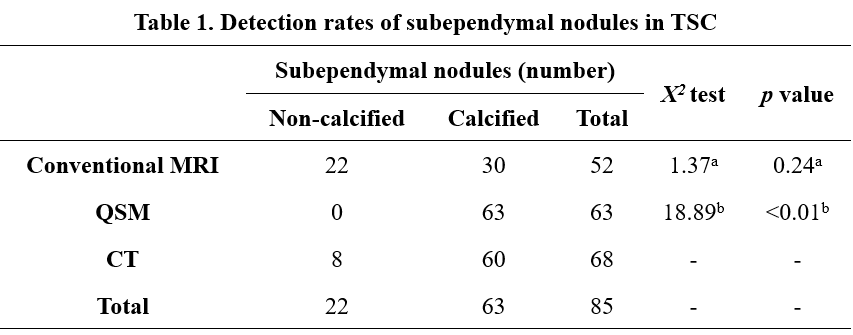
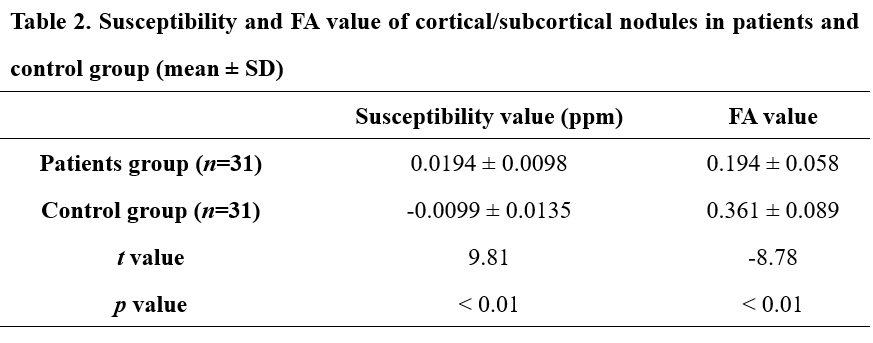
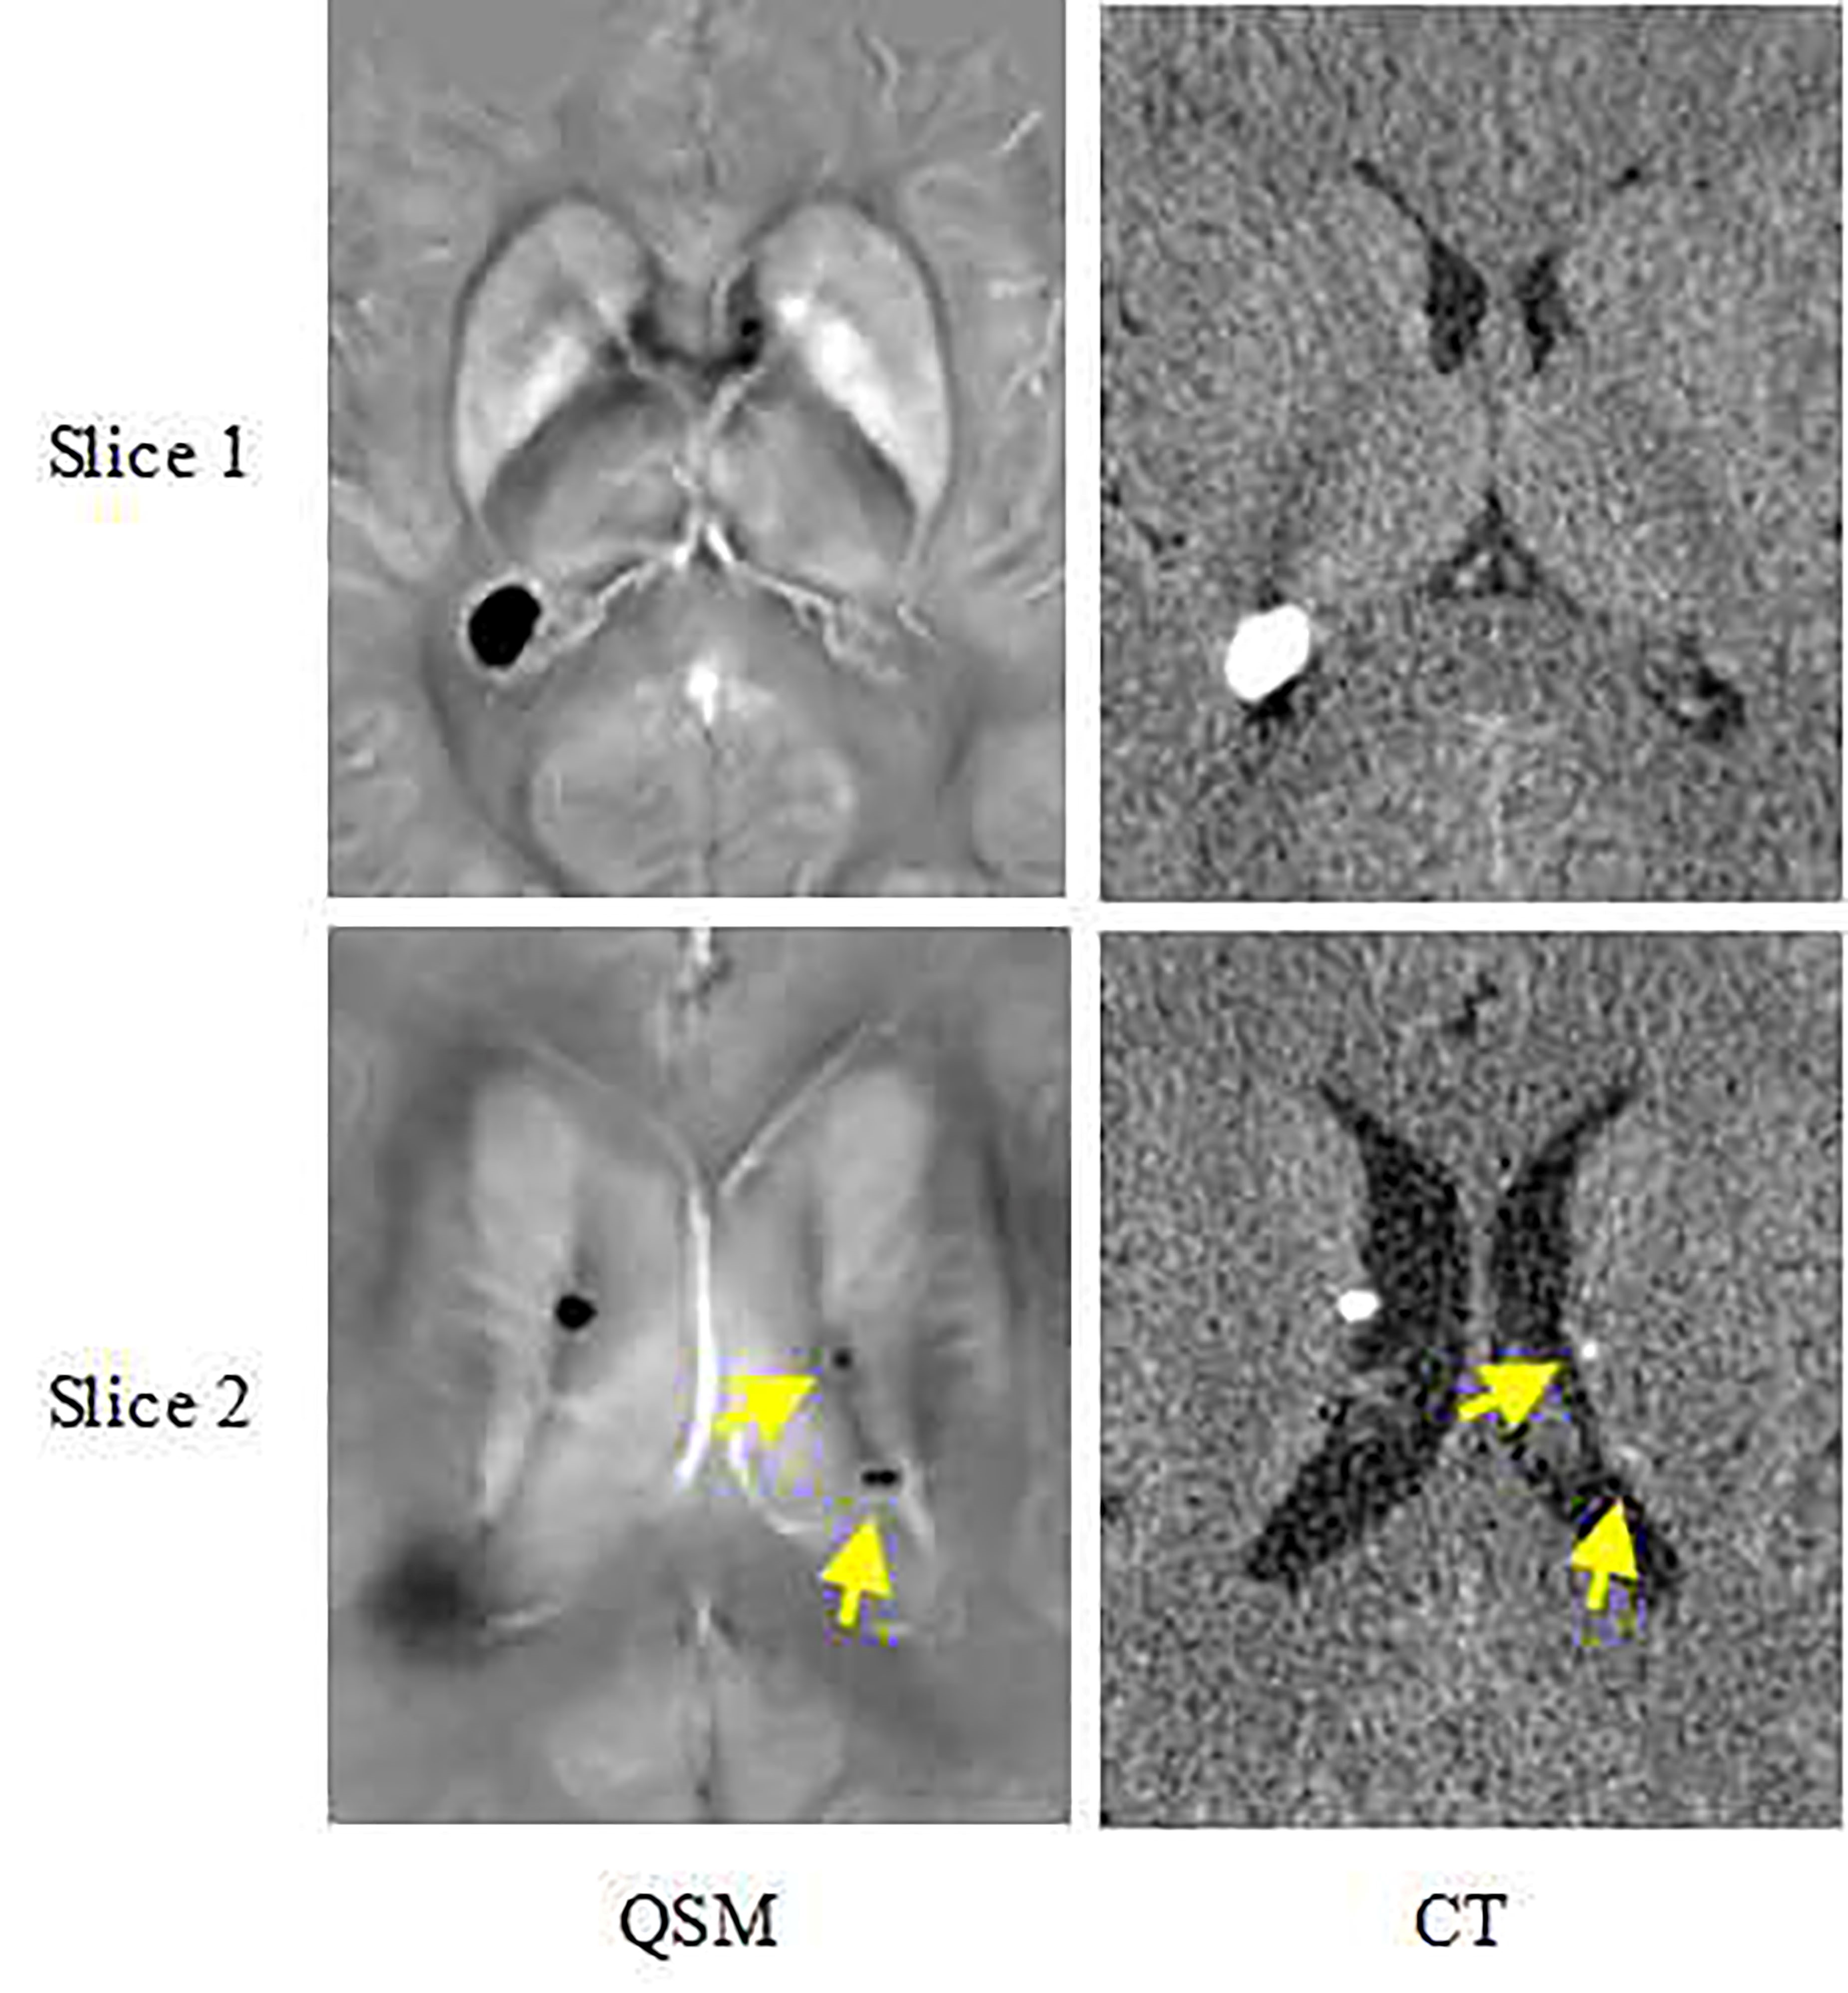
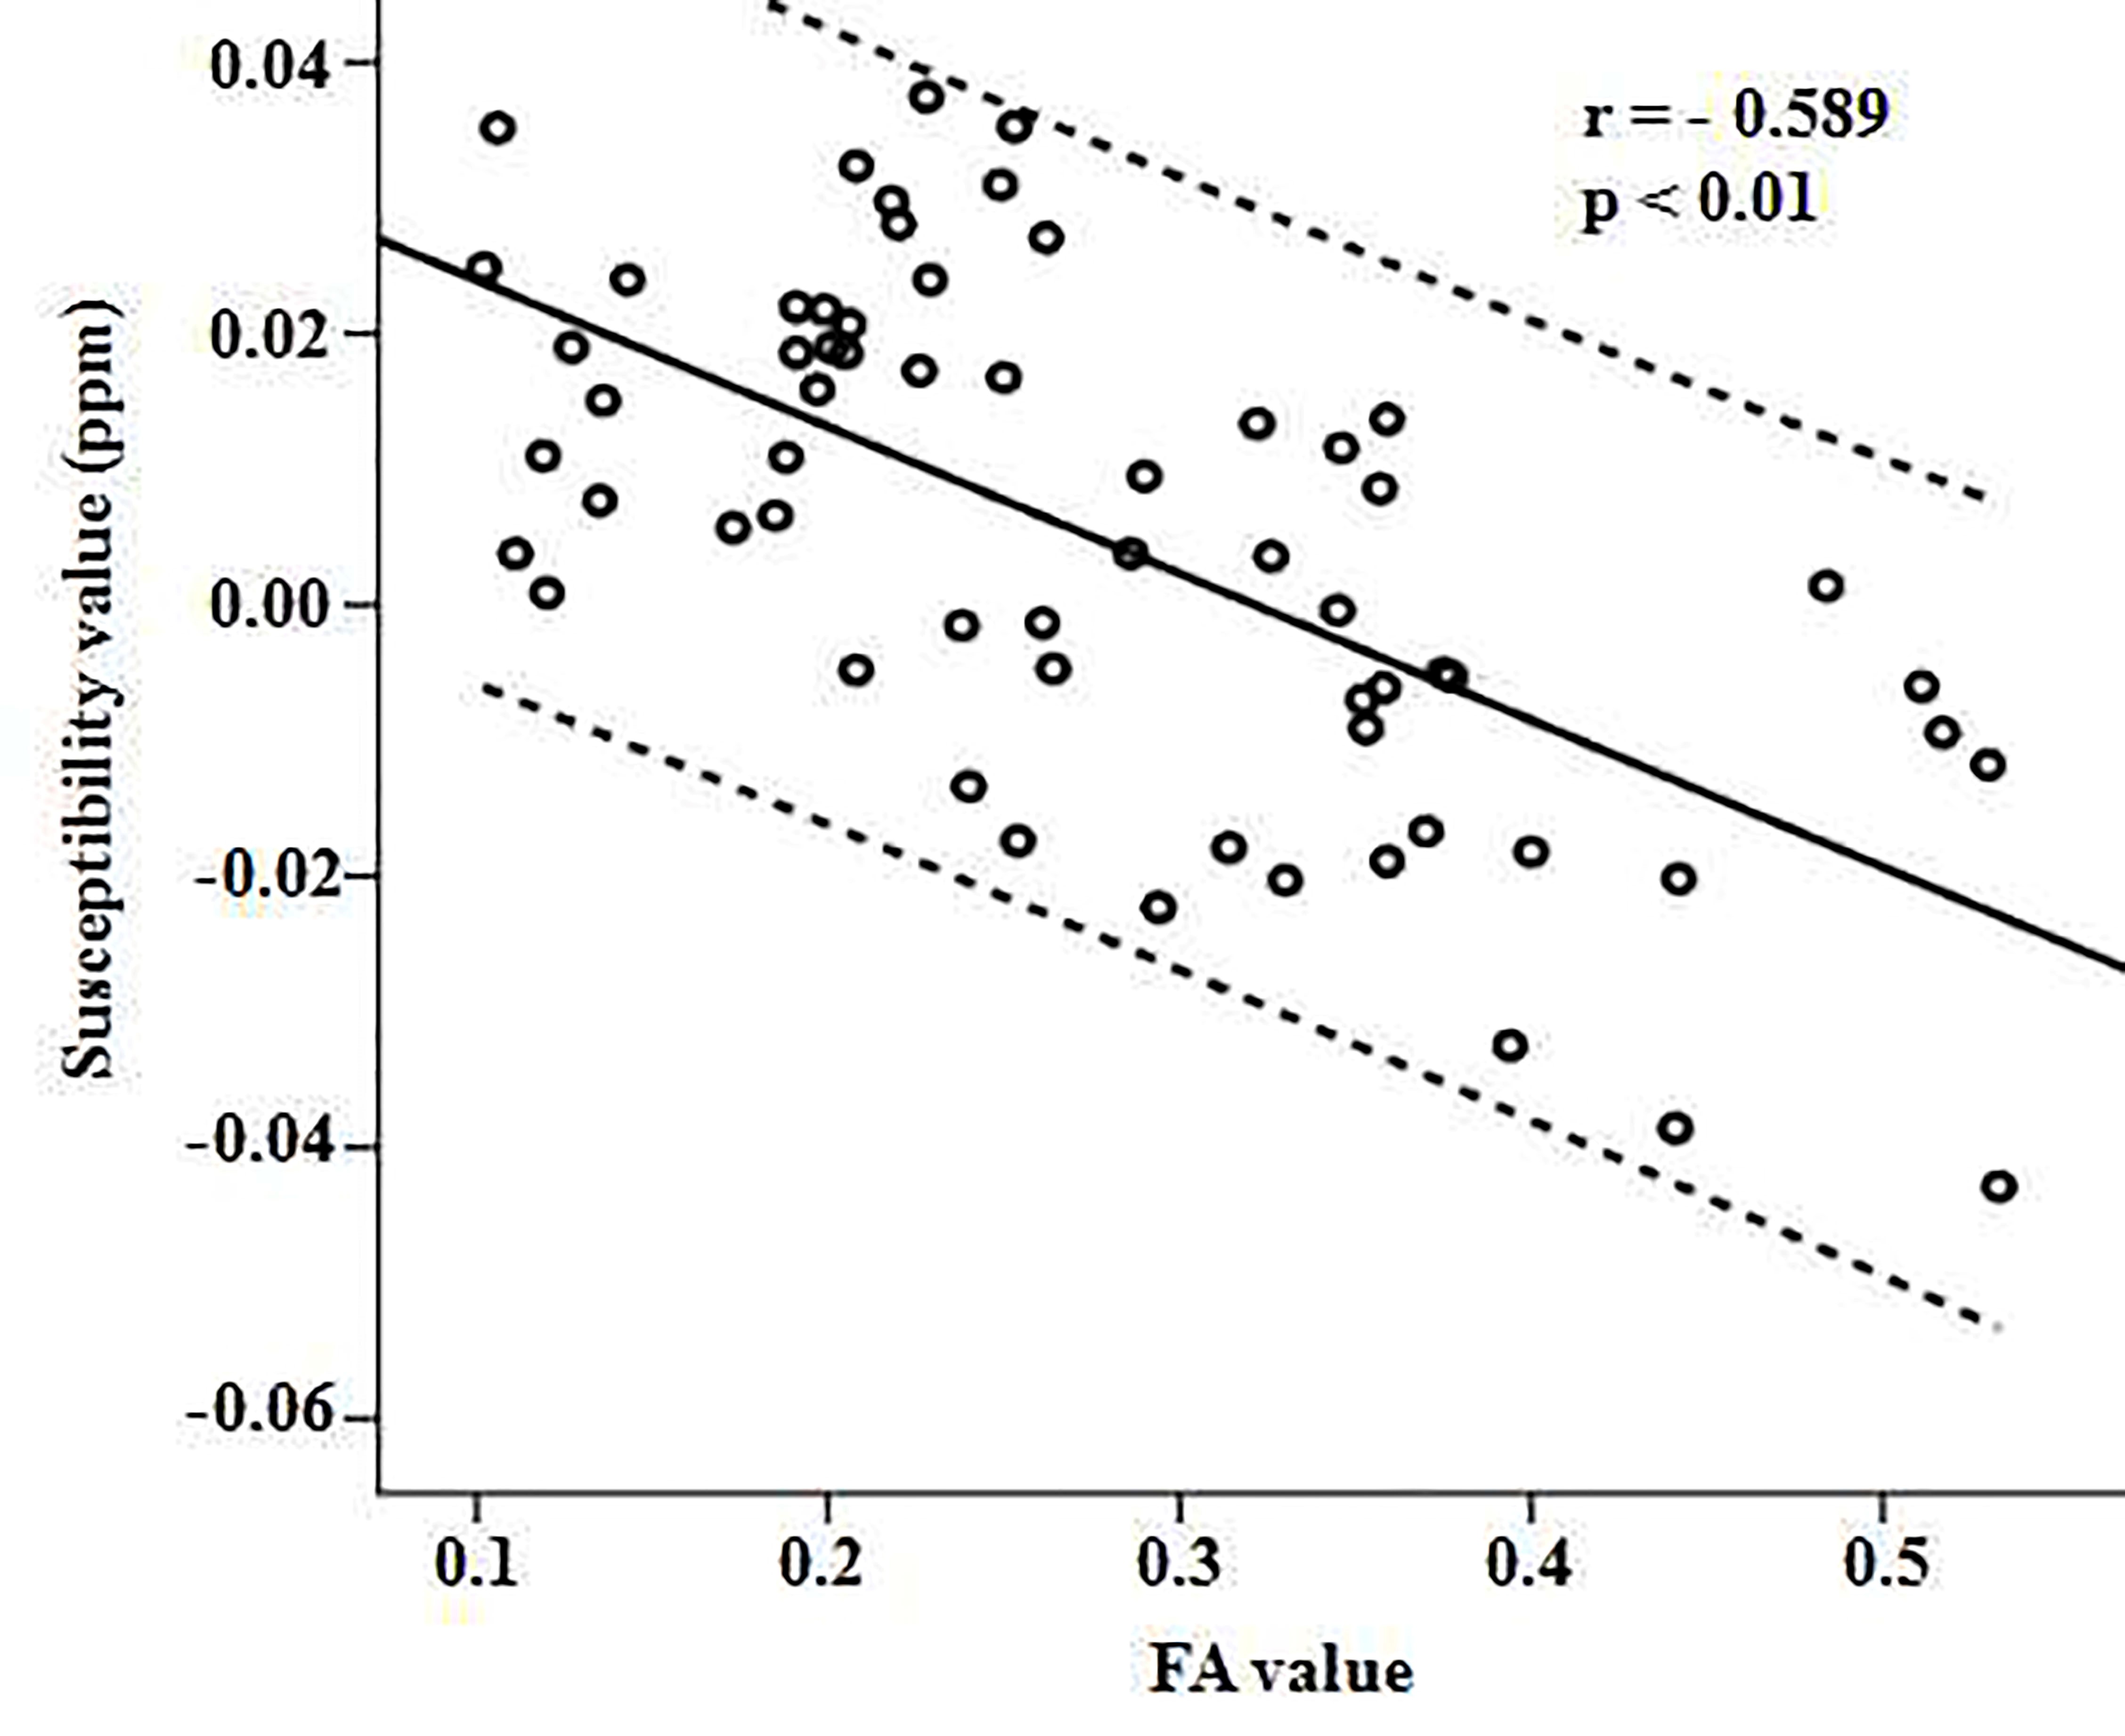
QSM performs equally well in detecting large subependymal calcified nodules compared to CT (p = 0.24), while was better in revealing micro and immature calcification lesions. Conventional MR sequences were beneficial in revealing the subependymal non-calcified and mature calcification nodules. The combination of QSM and conventional MR sequences outperformed CT in subependymal nodules detection (p < 0.01) (Table 1, Figure 1). Good inter-rater consistency was obtained in the measurements of susceptibility of cortical/subcortical regions (mean = 0.00, limit of agreement (LOA) = ±0.027) (Figure 2). The susceptibility value of cortical/subcortical tubers in TSC patients was significantly higher than those in control group (p < 0.01), while FA value was lower (p < 0.01) (Table 2). Pearson correlation test revealed negative correlation between susceptibility and FA values in all participants (r = -0.583, p < 0.01) (Figure 3). The results showed that susceptibility and FA values have similar ability in assessing TSC induced brain injuries.Discussion
The subependymal nodules and cortical/subcortical tubers are the most two commonly manifestations in nervous system, they are important in clinical diagnosis of TSC4, 5. CT is commonly used as the golden standard for examining coalification nodules. Calcification nodules are identified with a CT value higher than 100 Hu6. In this study, QSM had similar performance in identifying calcified nodules, and detected more micro and immature calcification nodules than CT. With the help of other conventional MR sequences in identifying non-calcified nodules, the combination of QSM and conventional MR sequences can significantly increase the detection rate of subependymal nodules compared to CT.
Traditionally, diffusion metrics derived from DTI are used to assess TSC related brain injuries. It is clinically approved that FA value can be used to assess cortex and sub-cortex microstructure change, which is closely related to demyelination7. This study showed that in cortical/subcortical nodules, a) TSC patient has higher susceptibility value compared to control group and b) the susceptibility value is inversely correlated to FA value in all participants. Therefore, the susceptibility value derived from QSM could be a reliable biomarker for assessing the brain tissue injuries induced in cortical/subcortical lesions.
Conclusion
The use of QSM in addition to conventional MR sequences can increase the detection rate of the subependymal nodules in TSC patients, and provides quantitative measurements of the cortical/subcortical tubers related brain tissue injuries.Keywords
Magnetic resonance imaging; Quantitative susceptibility mapping; Fractional anisotropy; Tuberous sclerosis complexAcknowledgements
No acknowledgement found.References
1.Caban C, Khan N, Hasbani DM, et al. Genetics of tuberous sclerosis complex: Implications for clinical practice. Appl Clin Genet 2016;10:1-8.
2.Curatolo P, Jozwiak S, Nabbout R.TSC Consensus Meeting for SEGA and Epilepsy Management. Management of epilepsy associated with tuberous sclerosis complex (TSC): Clinical recommendations. Eur J Paediatr Neurol 2012;16:582-6.
3.Filippi M, Rocca MA. MR imaging of multiple sclerosis. Radiology, 2011, 259:659-81.
4.Northrup H, Kruger D; International Tuberous Sclerosis Complex Consensus Group. Tuberous sclerosis complex diagnostic criteria update: recommendations of the 2012 International Tuberous Sclerosis Complex Consensus Conference. Pediatr Neuro. 2013;49:243-54.
5.Pinto Gama HP, da Rocha AJ, Braga FT, da Silva CJ, Maia AC Jr, de Campos Meirelles RG, et al. Comparative analysis of MR sequences to detect structural brain lesions in tuberous sclerosis. Pediatr Radiol 2006;36:119-25.
6.Wu Z, Mittal S, Kish K, Yu Y, Hu J, Haacke EM. Identification of calcification with MRI using susceptibility‐weighted imaging: a case study. J Magn Reson Imaging 2009;29:177-82.
7.Zikou AK, Xydis VG, Astrakas LG, Nakou I, Tzarouchi LC, Tzoufi M, et al. Diffusion tensor imaging in children with tuberous sclerosis complex: tract-based spatial statistics assessment of brain microstructural changes. Pediatr Radiol 2016;46:1158-64.
Figures