4924
Altered Brain Iron Content and Deposition Rate in Huntington Disease Indicated by Quantitative Susceptibility MRI1Department of Radiology and Radiological Sciences, Johns Hopkins University, BALTIMORE, MD, United States, 2F.M. Kirby Research Center for Functional Brain Imaging, Kennedy Krieger Institute, BALTIMORE, MD, United States, 3Department of Electronic Science, Fujian Provincial Key Laboratory of Plasma and Magnetic Resonance, Xiamen, China, 4Department of Psychiatry, Division of Neurobiology, and Departments of Neurology, Neuroscience and Pharmacology,Johns Hopkins University, BALTIMORE, MD, United States
Synopsis
We investigated the natural history of brain iron content at different stages of premanifest and manifest Huntington disease (HD) as indicated by changes of magnetic susceptibility values measured by quantitative susceptibility mapping (QSM). Higher susceptibilities were observed in striatum and globus pallidus of closer-to-onset premanifest HD and early HD patients, but not in the further-from-onset premanifest HD group as compared to controls using 1-way MANCOVA. Analysis using a general linear model showed significantly higher iron deposition rates (11.9%/yr in caudate and 6.1%/yr in globus pallidus) in closer-to-onset premanifest HD and early HD as compared to controls over a one-year follow-up.
Introduction
Huntington disease (HD) is a devastating inherited neurodegenerative disorder, caused by a cytosine-adenine-guanine (CAG) repeat expansion of the huntingtin (HTT) gene.1 Brain atrophy and iron accumulation have been recognized as important biomarkers for HD that can be detected before onset of disease symptoms.2 However, when extra iron starts to deposit in the striatum during the long premanifest stage, and how the iron deposition rate changes as the disease progresses has not been reported. In this study, altered brain iron content (as measured indirectly through magnetic susceptibility values from quantitative susceptibility mapping (QSM)) was investigated in premanifest HD patients at different time length to onset and in early stage HD patients, and the iron deposition rate in these patients was assessed through a one-year follow-up test.Methods
Twenty-four HD gene carriers (44.8 ± 15.8 y/o, 13 males) which can be divided into ‘> 8yr pre-HD’ (further-from-onset, N = 9), ‘< 8yr pre-HD’ (closer-to-onset, N = 6) and ‘early HD’ (N = 9) groups were recruited. Sixteen age-matched healthy controls (42.5 ± 12.9 y/o, 8 males) were also recruited. For the longitudinal study, 14 out of the 24 HD gene carriers and 7 out of the 16 controls participated in a one-year follow-up exam. Subjects were scanned at 7T (Philips Healthcare, Best, Netherlands) using a three-dimensional (3D) multi-echo gradient-recalled echo sequence (TR/TE1/∆TE = 68/4/2 ms, 8 echoes, flip angle = 9°, voxel size = 1×1×1 mm3, FOV = 220×220×100 mm3, bandwidth = 1530 Hz/voxel). QSM processing involved Laplacian-based phase unwrapping3, VSHARP-background field removal4 and SFCR5. Selected ROI masks in caudate nucleus, putamen, globus pallidus, hippocampus, substantia nigra and red nucleus were extracted using a multi-atlas matching approach with manual corrections. One-way MANCOVA was performed to investigate the differences in brain iron content between the HD subgroups and controls. The p value in multiple comparisons after Benjamini-Hochberg correction was considered significant at p ≤ 0.05. Pearson partial correlation analysis was conducted between magnetic susceptibility and CAG and age product score (CAPs, CAPs = Age × (CAG-33.66) /432.3326) controlling for gender. Longitudinal changes in susceptibility measures were analyzed using a General Linear Model (GLM) framework.Results
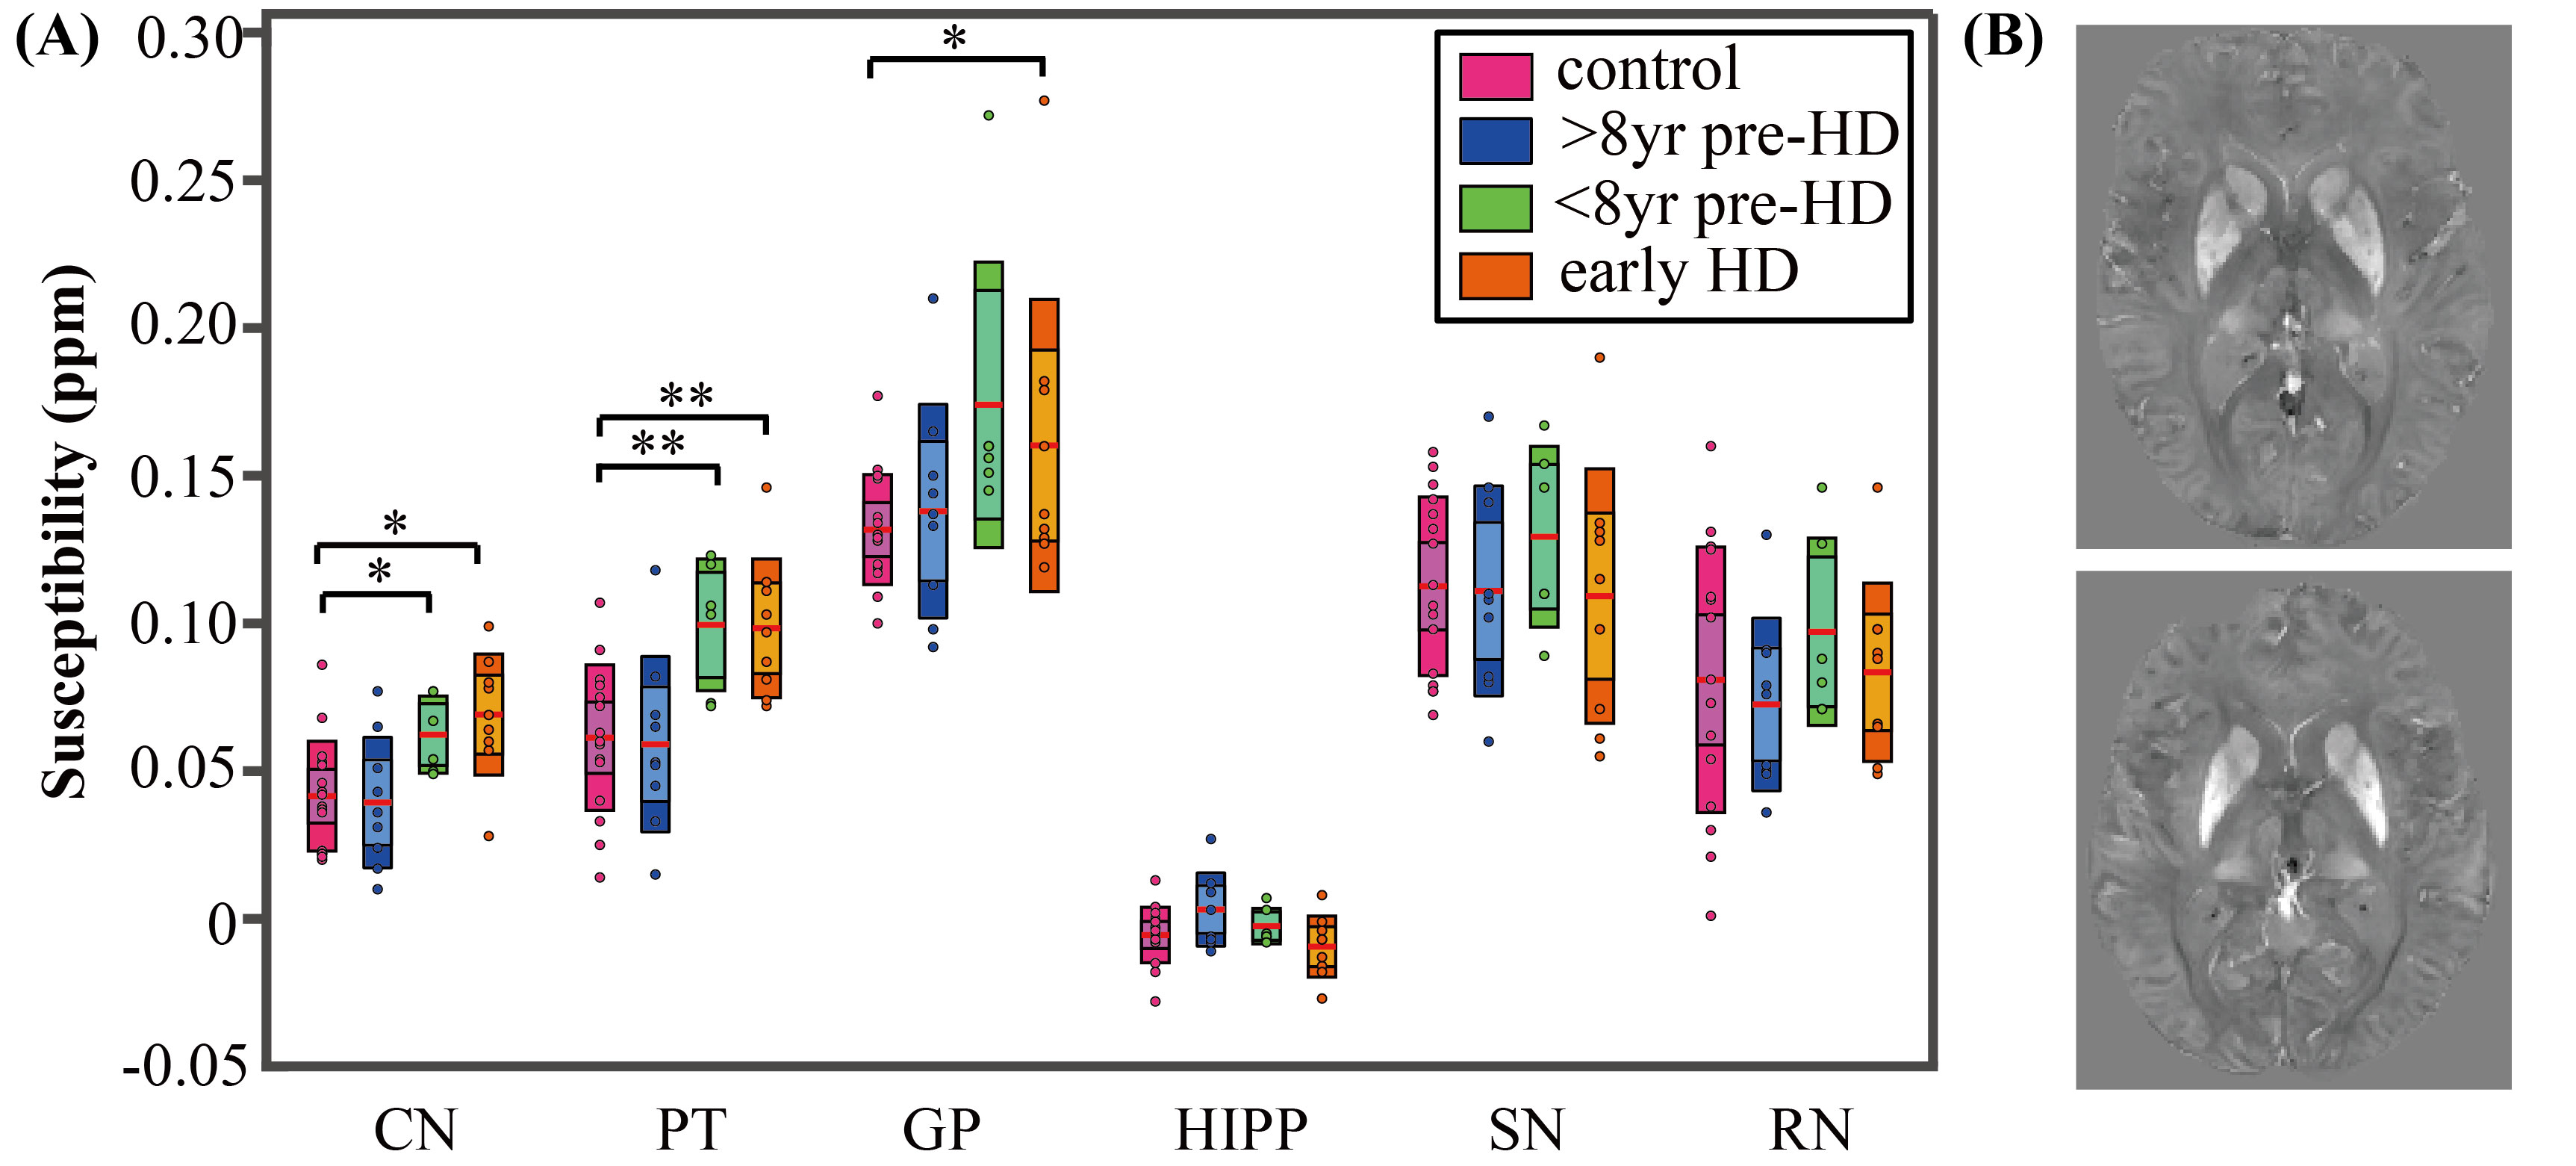
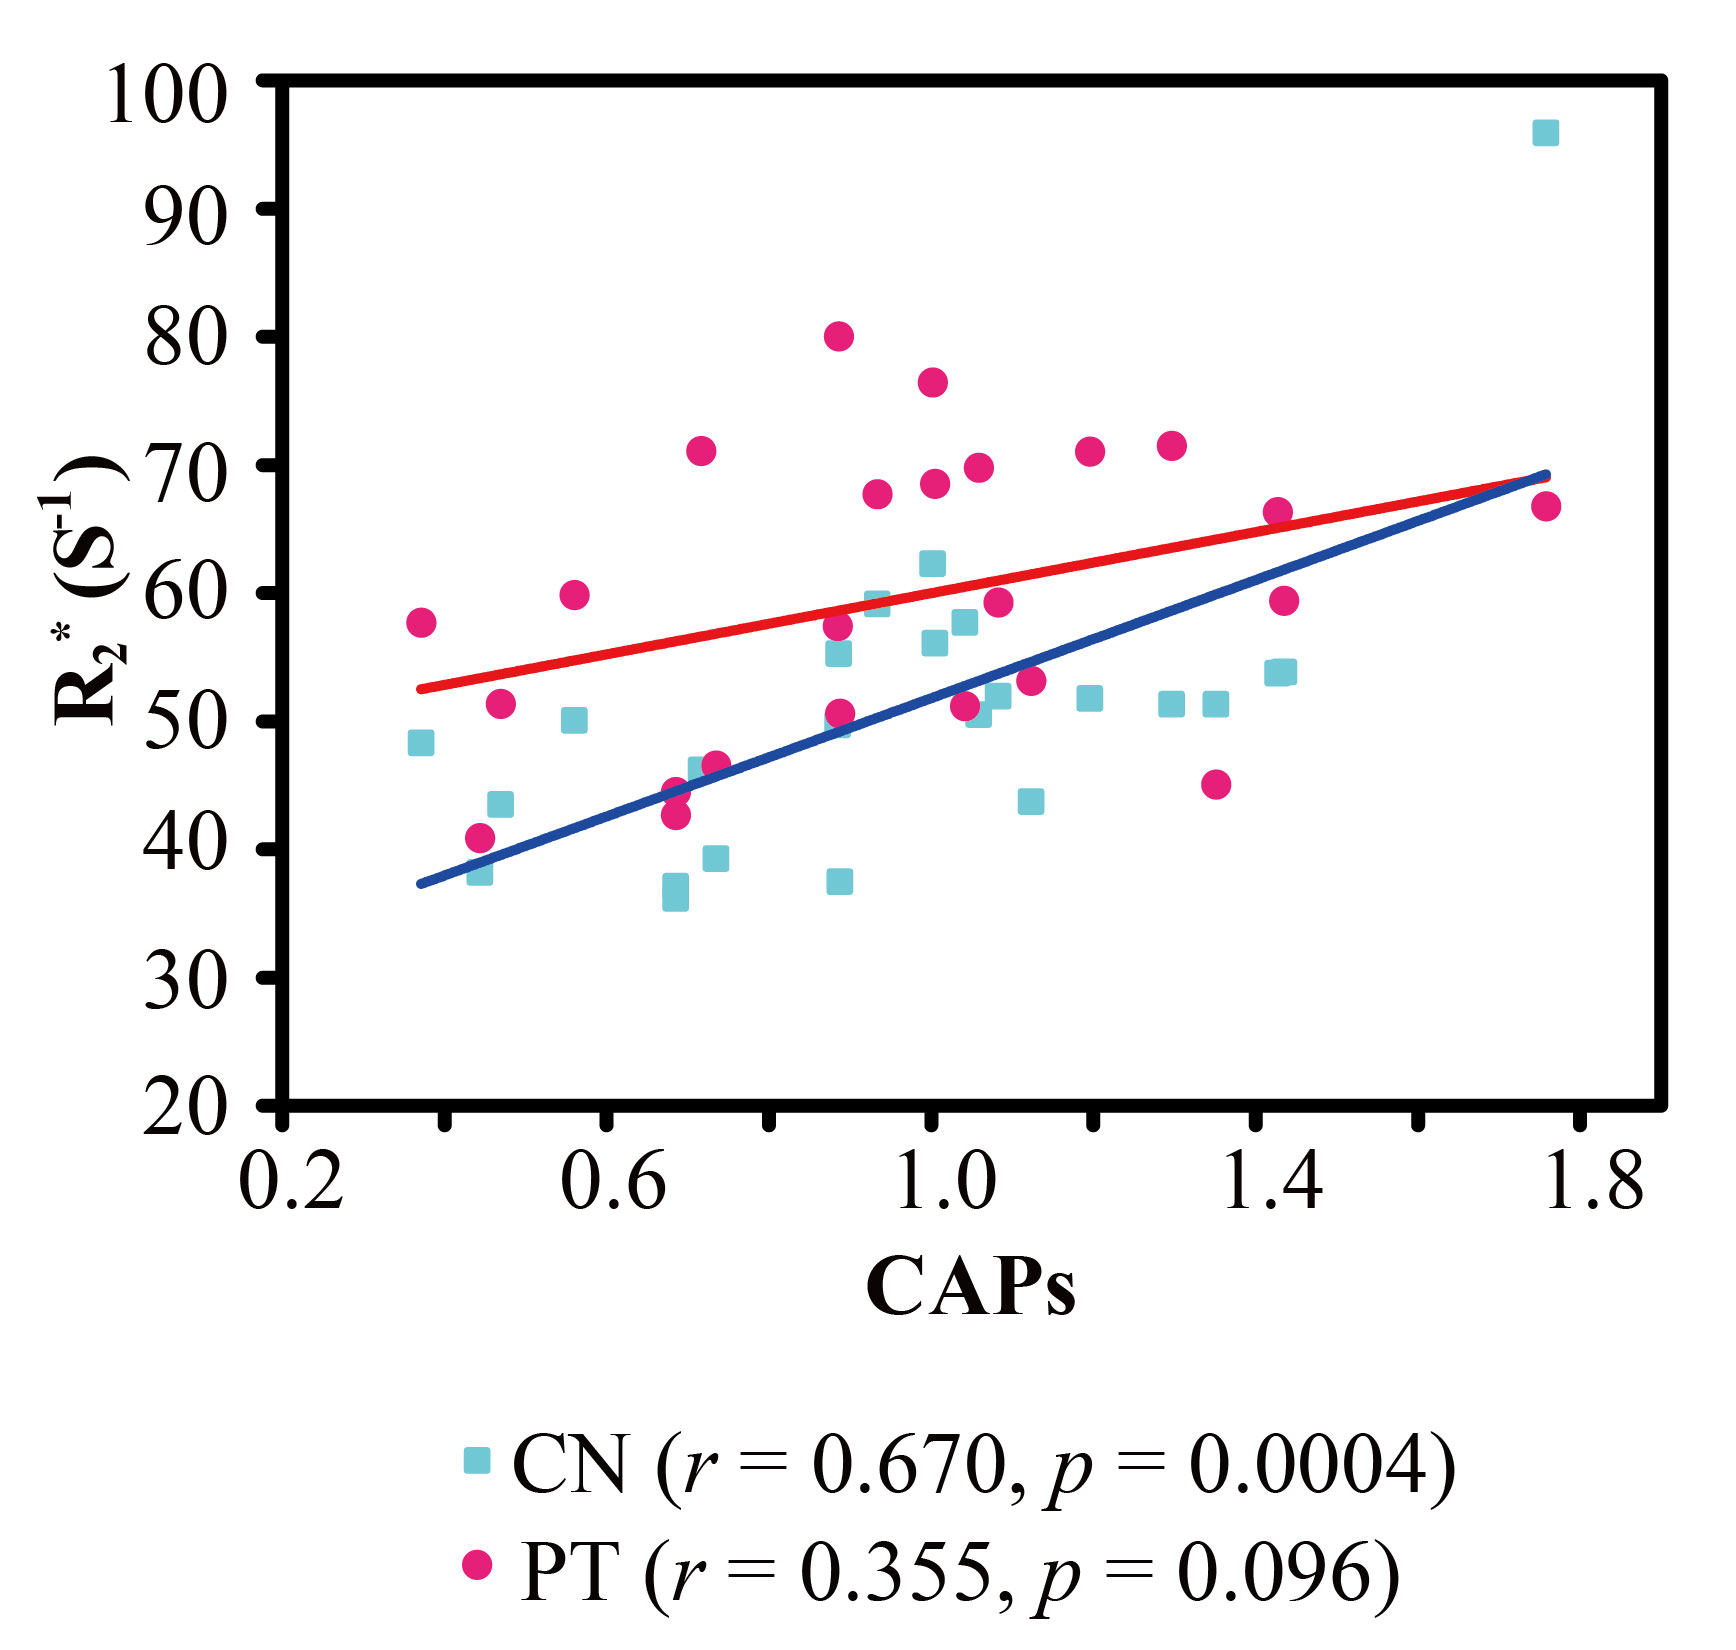
Figure 1(A) summarizes the multiple comparisons of magnetic susceptibility between HD subgroups and controls in each selected brain regions. We found that the <8yr pre-HD group showed significant susceptibility increases in caudate (p < 0.05) and putamen (p < 0.01), and the early HD group showed significant increases in caudate, globus pallidus (p < 0.05), and putamen (p < 0.01) as compared to controls, with age and gender as covariates. Fig. 1(B) shows example QSM maps demonstrating higher magnetic susceptibility (represented by higher image intensity in QSM) in the basal ganglia in an early HD patient (bottom) as compared to a control subject (upper). As shown in Fig. 2, the CAPs showed significant positive correlations with magnetic susceptibility values in caudate (r = 0.622, p = 0.002) and putamen (r = 0.557, p = 0.006) in all HD patients, with gender as covariate. In the longitudinal study, when considering a combined HD-2 group (<8yr pre-HD plus early HD patients), GLM analysis for repeated measures showed a group × time interaction effect for the susceptibility of caudate [F(1,13) = 4.94; p = 0.045] and globus pallidus [F(1,13) = 5.03; p = 0.043]. Post-hoc analyses revealed an increase in susceptibility of caudate [F(1,7) = 23.35; p = 0.002] and globus pallidus [F(1,7) = 5.70; p = 0.048] in this HD-2 group (Fig. 3). The changes in tissue magnetic susceptibility in the HD-2 group were 11.9%/yr in caudate and 6.1 %/yr in globus pallidus. No significant longitudinal changes were observed in control and >8yr pre-HD group.Discussion
It is widely known that CAPs can be a useful way of tracking the extent of CAG repeat expansion mutation and is related to the disease progression.6 Considering the correlation with CAPs, iron content may serve as a potential alternative marker for monitoring therapy for disease intervention. Significantly higher one-year iron-deposition rate in caudate and globus pallidus in our longitudinal study suggests that the iron deposition rate in the striatum may follow a similar pattern of acceleration of striatal atrophy in HD.Conclusion
The present study shows that the altered iron content in striatum is more obvious in the closer-to-onset stage and less so in further-from-onset stage. Iron deposition is related to disease progression as indicated by the correlations with CAPs. A one-year longitudinal study indicates that iron deposition rate in caudate and globus pallidus is higher in the closer-to-onset and early stage HD patients than controls.Acknowledgements
Funding Support: P41 EB015909; Dana Foundation and the Huntington’s Disease Society of America (HDSA); Chinese Scholarship Council (201706310087 to LC).References
[1] Macdonald ME, Ambrose CM, Duyao MP, et al. A novel gene containing a trinucleotide repeat that is expanded and unstable on huntingtons-disease chromosomes. Cell 1993; 72(6):971-983. [2] Dixon SJ, Stockwell BR. The role of iron and reactive oxygen species in cell death. Nat Chem Biol 2014;10(1):9-17. [3] Li W, Wu B, Liu CL. Quantitative susceptibility mapping of human brain reflects spatial variation in tissue composition. Neuroimage 2011;55(4):1645-1656. [4] Schweser F, Deistung A, Lehr BW, et al. Quantitative imaging of intrinsic magnetic tissue properties using MRI signal phase: an approach to in vivo brain iron metabolism? Neuroimage 2011;54(4):2789-2807. [5] Bao LJ, Li X, Cai CB, Chen Z, van Zijl PCM. Quantitative susceptibility mapping using Structural Feature based Collaborative Reconstruction (SFCR) in the human brain. Ieee T Med Imaging 2016;35(9):2040-2050. [6] Zhang Y, Long JD, Mills JA, et al. Indexing disease progression at study entry with individuals at-risk for Huntington disease. Am J Med Genet B 2011;156(7):751-763.Figures