4923
R2, R2* and quantitative susceptibility mapping (QSM) changes of corpus callosums in aging rats: Possible contributions from myelin thickness1Department of Biomedical Engineering, Ulsan National Institute of Science and Technology (UNIST), Ulsan, Korea, Republic of
Synopsis
Myelin is essential component for complex motor, sensory and cognition function.1 Among many quantitative magnetic resonance imaging (MRI) techniques investigating myelin structure, direct MR parameter influenced by the myelin thickness is rarely investigated.1 Here, we study the effect of myelin thickness on R2, R2* and susceptibility using the finite perturber method (FPM)-based simulation and post-mortem aging rat brains. It is observed from simulations that both myelin thickness and myelin volume fraction (MVF) affects R2 and R2* values, whereas the phase change (QSM) showed a significant change only by the change of MVF. In preliminar experiments, consistent results were observed.
Purpose
In myelin structure quantification using magnetic resonance imaging (MRI), myelin volume fraction (MVF) and g-ratio measurements utilizing diffusion and magnetization transfer (MT) techniques effectively provide in vivo surrogates of volumetric myelin structures.1,2 On the other hand, it is rather difficult to find an MR surrogate, which directly reflects myelin thickness information as previous methods offer volumetric estimation, not the myelin thickness. To theoretically and experimentally investigate the thickness-dependent effect of myelin, we performed the finite perturber method (FPM)-based simulation and ex-vivo aging rat model study.Methods
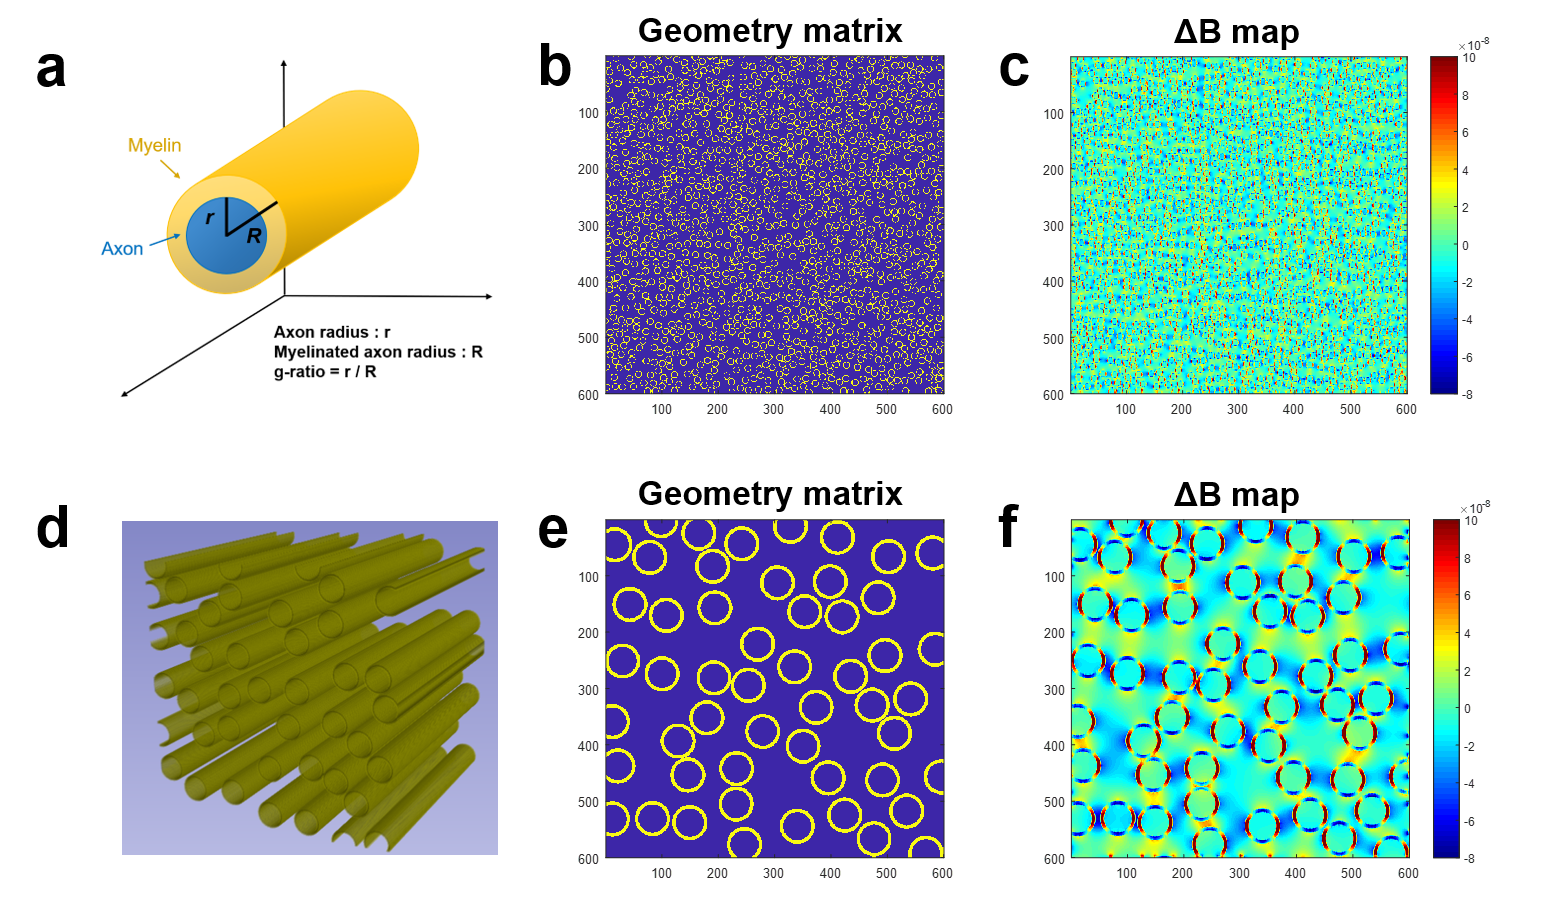
FPM-based Monte Carlo simulation was implemented using MATLAB (Mathworks, Natick, MA) on an R2017a environment.3 Simulation parameters: number of repetition = 2, 600x600x600 matrix with voxel size = 0.2μm, number of protons = 5.4x10⁷, magnetic field strength = 7T, spin echo time (TE) = 8, 16, 32, 64, 100ms and gradient echo TE = 12, 24, 36, 48, 60ms with unit time = 0.2ms. Myelin geometry parameters: axon radius = 1 to 5μm with fixed g-ratio = 0.8 (so, myelin thickness = 0.25 to 1.25μm), MVF = 5% and 15% with Δχ = -0.26ppm (SI unit).4 Cylinders are randomly distributed along y-axis direction.
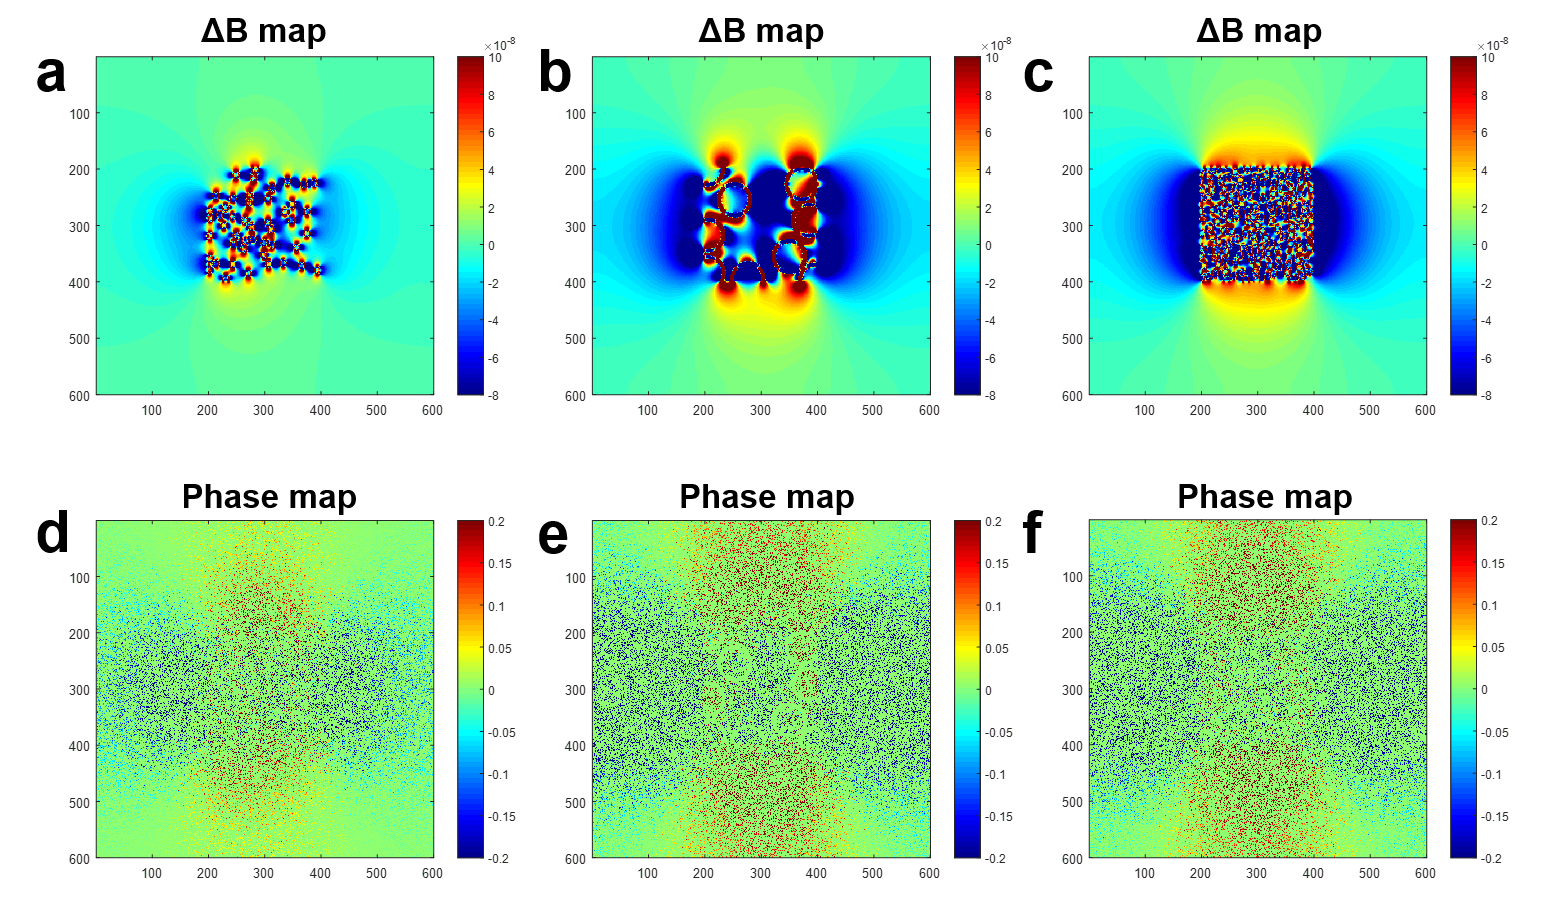
To observe the phase variation of the voxels around the structure geometry, we setup the 200x200x200 matrix in the center of the original matrix and constructed another simulation geometry with the same parameters.
Since both myelin thickness and MVF are known to increase with aging for rodents, we setup the aging-rat model study.5 6 weeks (n=3), 4 months (n=3), and 20 months (n=3) old groups female Spraque Dawley rats were used to identify age-related myelin thickness changes. All of brains were fixed and stored in formaldehyde solution. Selected white matter region was corpus callosum for the analysis.
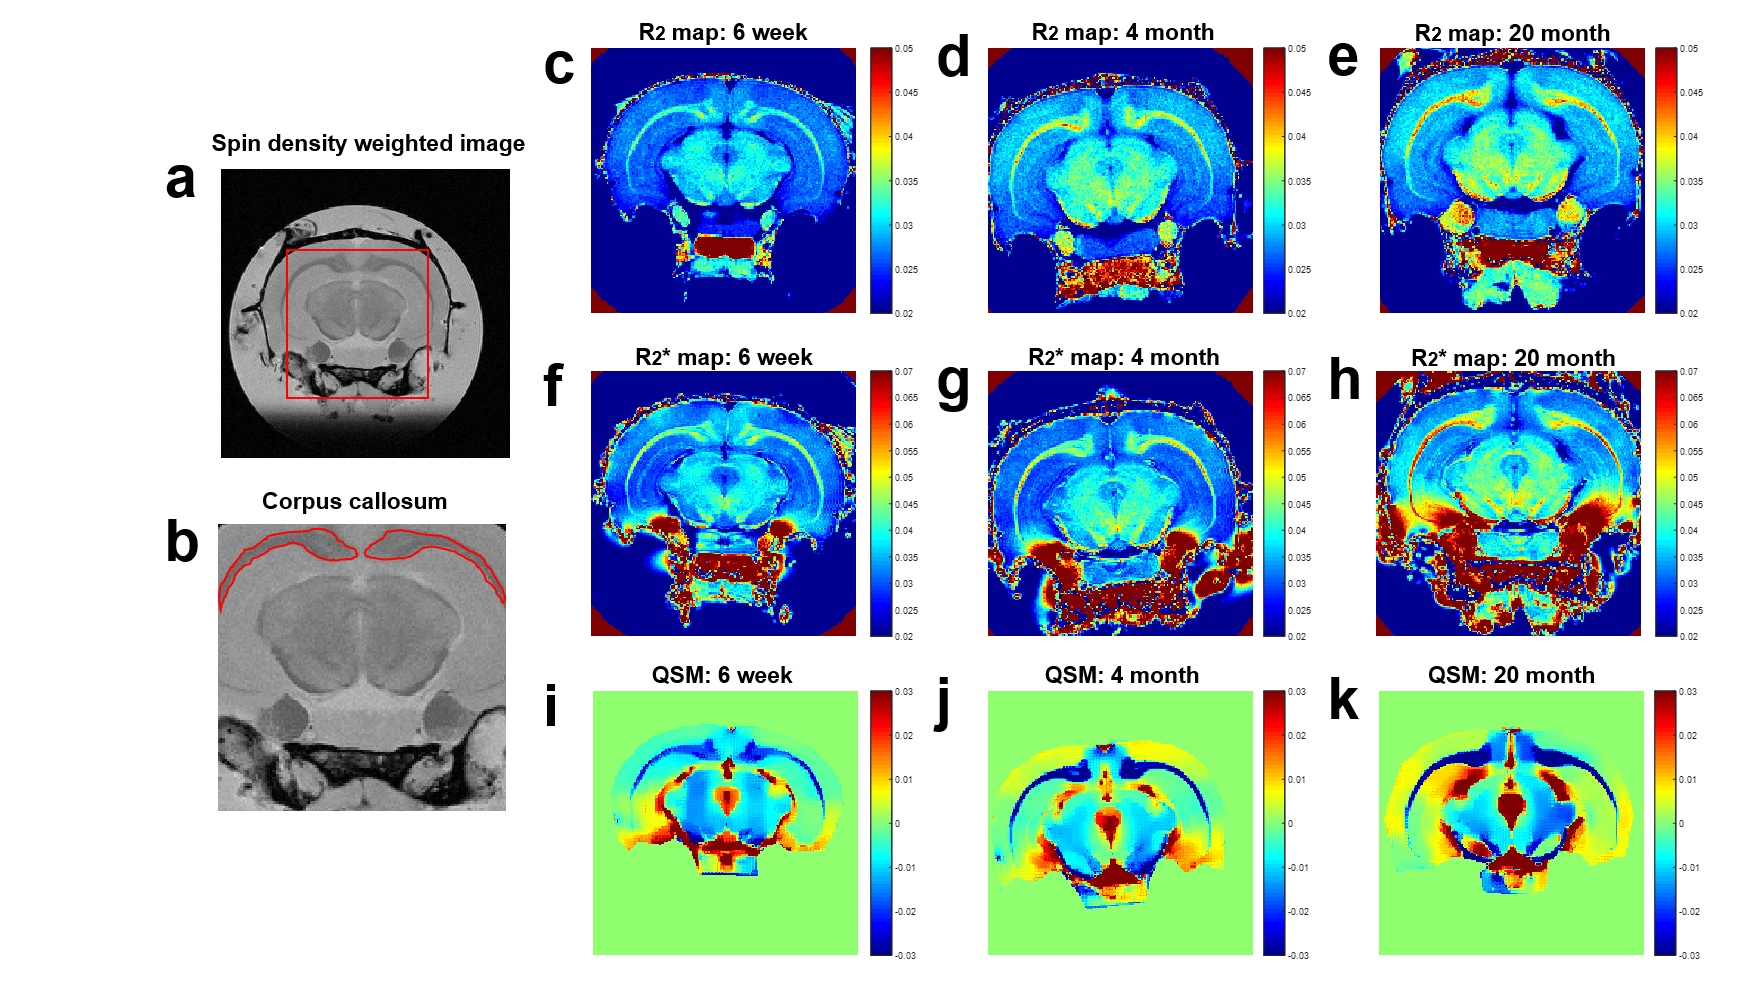
T2-weighted multi-slice-multi-echo (MSME) images and T2*-weighted multi-gradient-echo (MGE) images were acquired at 7T MRI scanner (Bruker), and quantitative susceptibility mapping (QSM) were computed from the MGE phase data with non-skull region of interest (ROI). MSME parameters: repetition time (TR) = 4000ms, TE = 8 to 384ms with echo spacing 8ms. MGE parameters: TR = 4000ms, TE = 2.7 to 50.3ms with echo spacing 3.4ms. Both sequences used matrix size = 256x256 and field of view (FOV) = 25x25mm2.
Results
The simulation geometry and ΔB maps according to MVF and thickness are shown in figure 1. Figure 2 shows the representative results of R2, R2* mapping and QSM of each one of 6 weeks, 4 months, and 20 months rat brains. At the corpus callosum region, both R2, R2* and susceptibility values have shown significant changes with age (Fig 2c-2k).
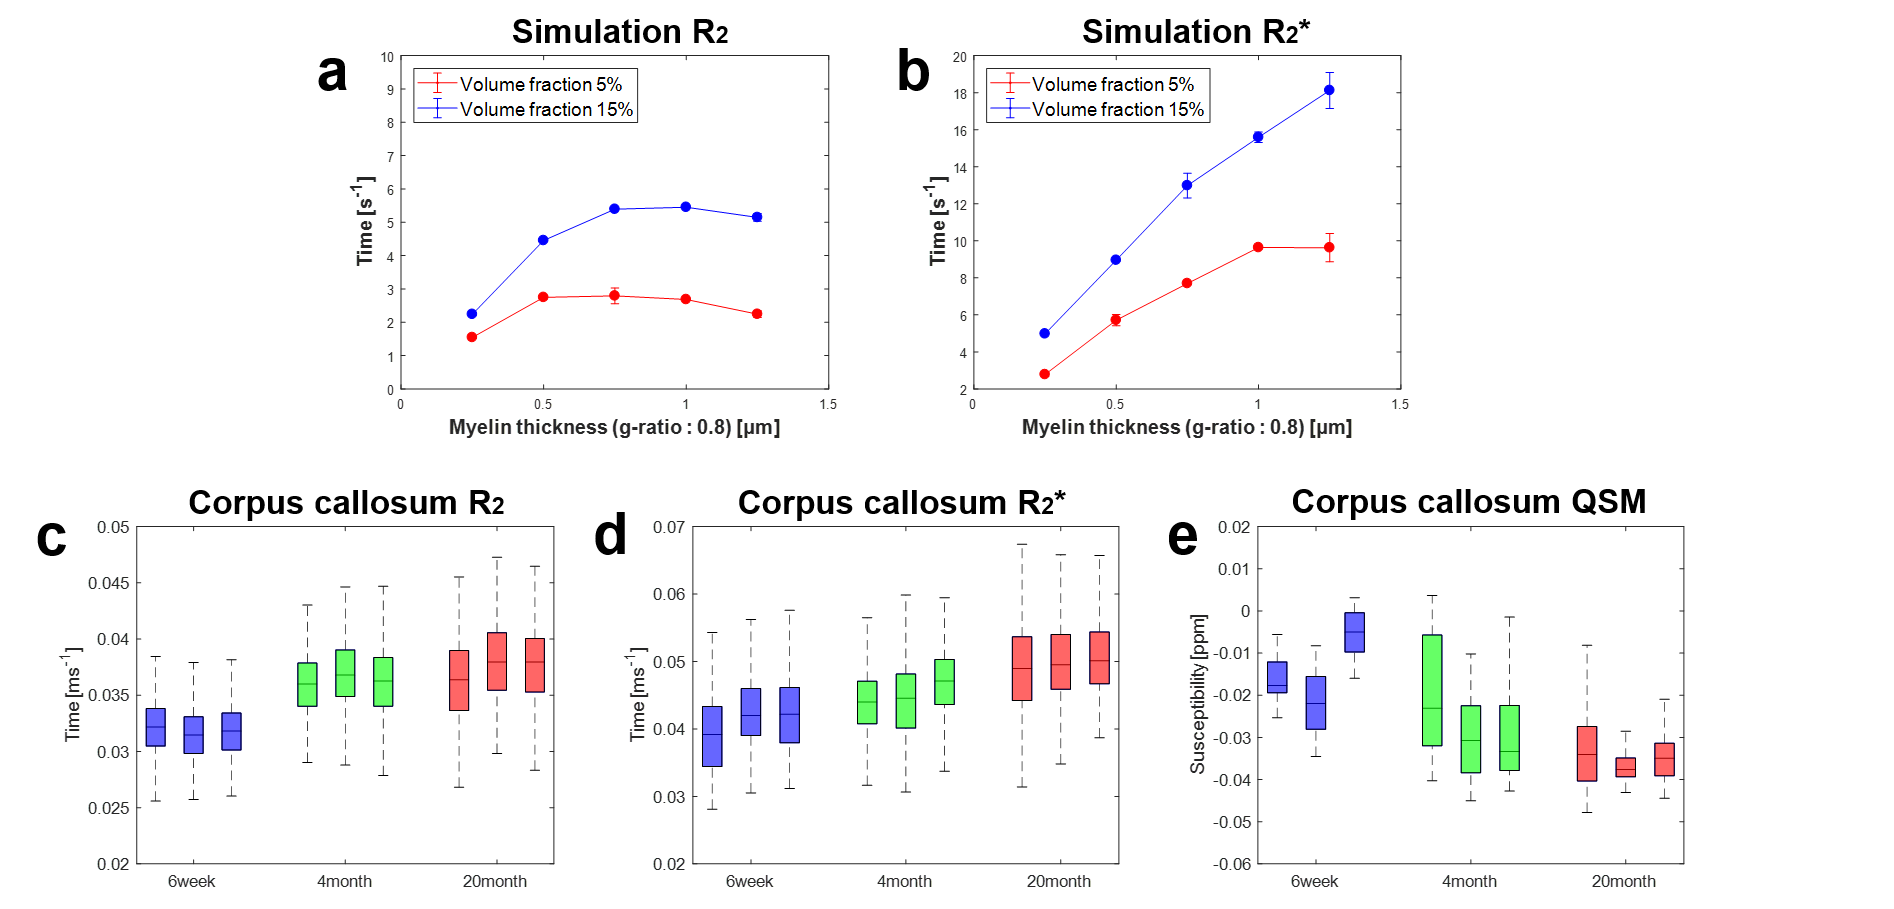
According to the simulation results, R2* values were observed to linearly increase but R2 values were observed to increase and saturate at some specific thickness, when both values were plotted with respect to increasing myelin thickness (Fig 3a-3b). This tendency was similarly observed in the rat experimental R2 and R2* results (Fig 3c-3d). At the corpus callosum, R2* values were observed to linearly increase with aging, but R2 values have significantly increased in the interval from 6 weeks to 4 months and the increasement was less in the interval from 4 months to 20 months (Fig 3c-3d). As the MVF increased in the simulations, the values of R2 and R2* have increased maintaining similar behaviors with increasing thickness (Fig 3a-3d). In the case of QSM, although the standard deviation is large, it has shown decreasing magnetic susceptibility with aging corpus callosum, which is the signature of enlarging MVF (Fig 3e).
Figure 4 shows the changes of ΔB and phase maps by variations of myelin thickness and MVF. In case of ΔB maps, the field is affected by both myelin thickness and MVF changes (Fig 4a-4c). However, the phase maps are sensitive to changes in MVF (Fig 4d-4e), not to myelin thickness (Fig 4e-4f).
Conclusion and discussion
We can see through the simulation results that both the myelin thickness and MVF affect to R2 and R2* values (Fig 3a-3b, 4a-4c), and these tendencies were consistent with the aging-rat study (Fig 3c-3d). Also, simulation results show that the change of phase field occurs only by the change of MVF regardless of the axon thickness (Fig 4). These results suggest that if the effects of relaxation and phase changes are mutually combined, the MVF effect may be able to offset, then information on myelin thickness may be obtained using MRI with further validations.
Acknowledgements
This work was supported by the Korea Health Industry Development Institute by the 2018 Research Fund (HI18C0713).References
1. Laule C, Vavasour IM, Kolind SH, Li DKB, Traboulsee TL, Moore GR, Mackay AL. Magnetic resonance imaging of myelin. Neurotherapeutics, 2007; 4, 460–484.
2. Campbell JSW, Leppert IR, Narayanan S, Boudreau M, Duval T, Cohen-Adad J, Pike GB, Stikov N. Promise and pitfalls of g-ratio estimation with MRI. NeuroImage, 2017; 1-17
3. Pathak AP, Ward BD, Schmainda KM. A novel technique for modeling susceptibility-based contrast mechanisms for arbitrary microvascular geometries: the finite perturber method. NeuroImage. 2008; 40(3): 1130-1143.
4. Sati P, van Gelderen P, Silva AC, Reich DS, Merkle H, de Zwart JA, Duyn JH. Micro-compartment specific T2* relaxation in the brain. NeuroImage, 2013; 77, 268–278.
5. Stahon KE, Bastian C, Griffith S, Kidd GJ, Brunet S, Baltan S. Age-related changes in axonal and mitochondrial ultrastructure and function in white matter. The Journal of Neuroscience, 2016; 36(39):9990-10001.
Figures