4921
Quantitative Susceptibility Mapping of the Brain – A Comparative In vivo Study of Humans and Nonhuman Primates1Functional Imaging Laboratory, German Primate Center, Goettingen, Germany, 2Center for Systems Neuroscience, Goettingen Graduate School for Neurosciences, Biophysics, and Molecular Biosciences, University of Goettingen, Goettingen, Germany
Synopsis
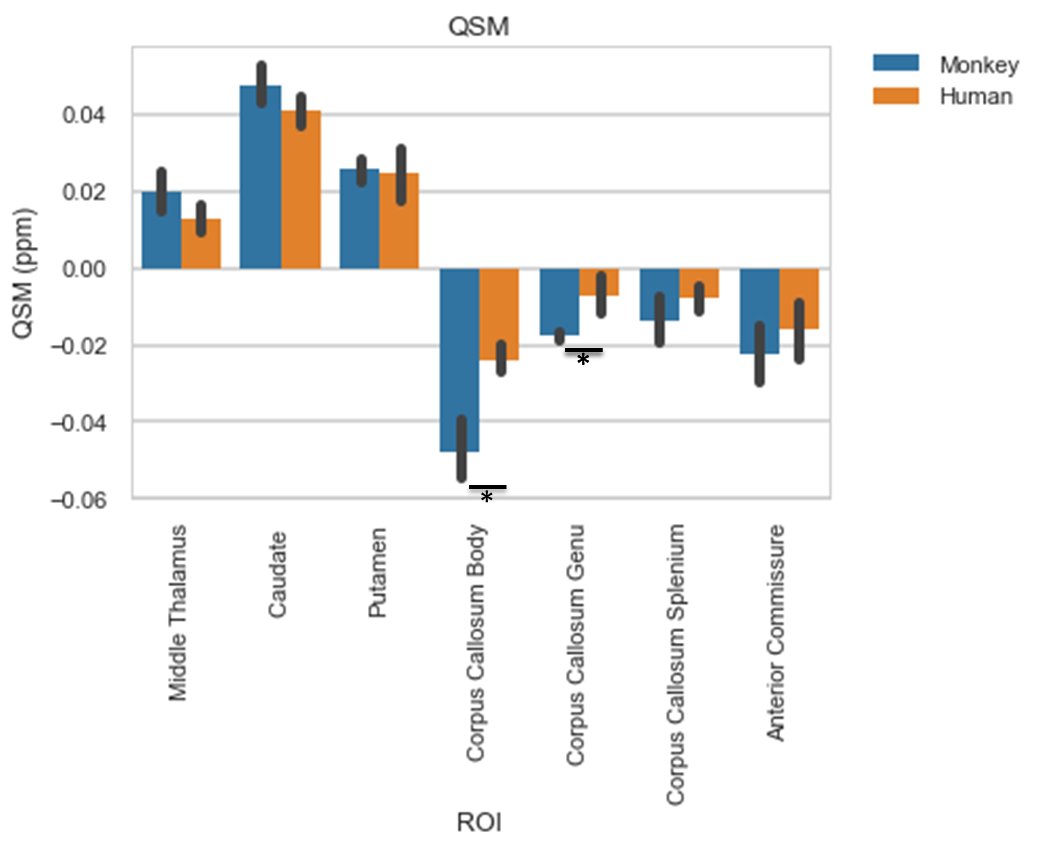
Quantitative susceptibility mapping of the brain was performed in healthy humans and cynomolgus monkeys at comparable age using almost identical MR parameters, including the magnetic field strength. This comparative study revealed very similar values of magnetic susceptibility in gray matter structures between the two species, but a significantly lower magnetic susceptibility in parts of the corpus callosum of monkeys compared to the humans. This difference may be related to differences in the position of fiber tracts relative to the magnetic field lines, but it may also reflect differences in iron content, fiber density, and myelination.
Methods:
Subjects: 6 healthy young adult female volunteers with an age range of 23 - 29 years and 5 healthy young adult female cynomolgus monkeys with an age range of 7 - 9 years were included in the study.
Data Acquisition: QSM acquisitions were carried out at 3T (MAGNETOM Prisma, Siemens) using a 3D multi-echo gradient echo (GRE) sequence with TE1/ spacing/ TE9/ TE10 of 3.7/ 4.9/ 43/ 50.4 ms, TR=57 ms, and FA = 20°. The spatial resolutions for humans and monkeys were 0.75 x 0.75 x 0.75 mm³ and 0.312 x 0.312 x 0.312 mm³ respectively.
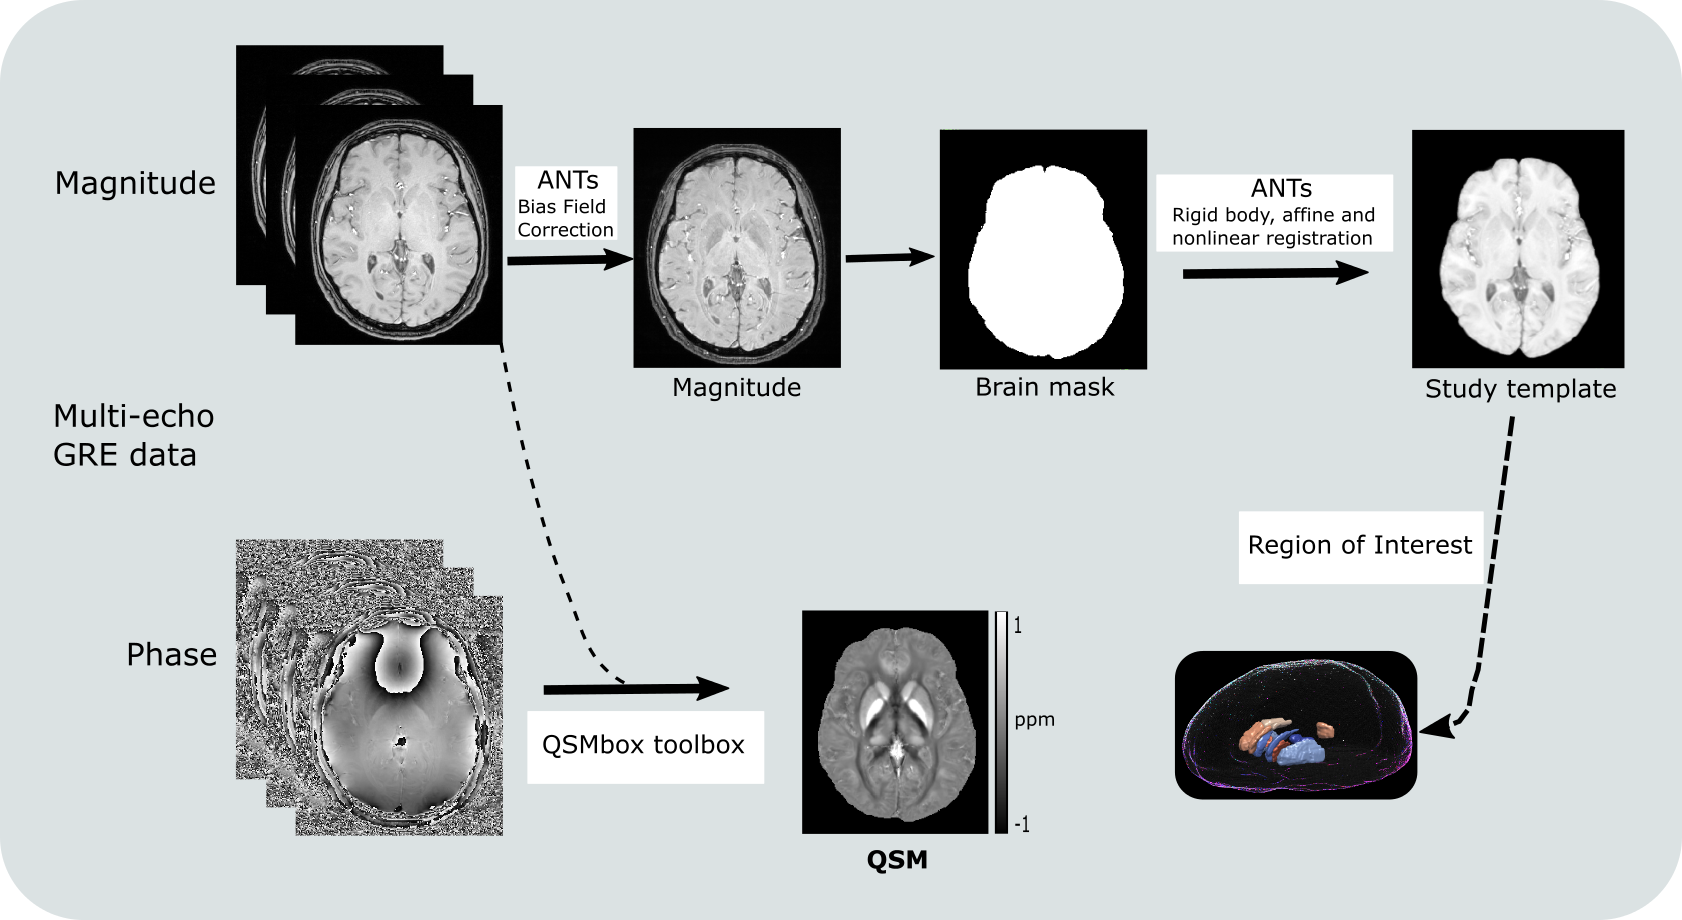
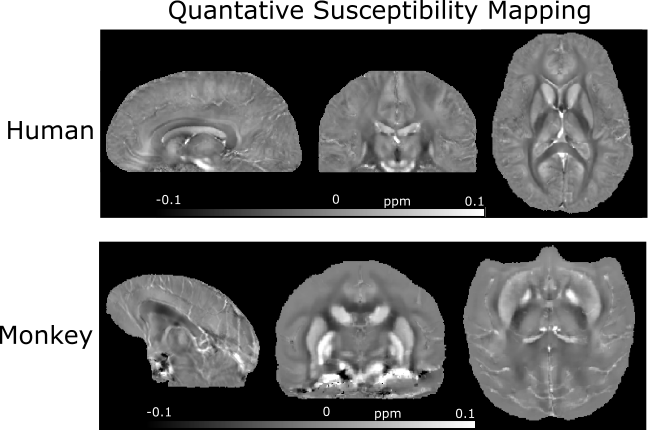
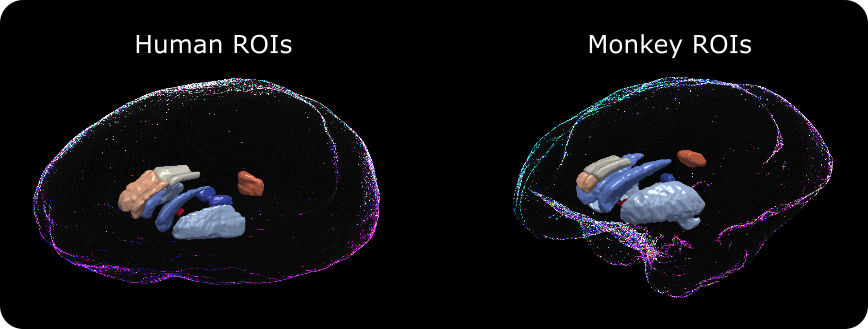
Data analysis: The data analysis pipeline used likewise for human and monkeys is illustrated in Figure 1. Multi-echo GRE magnitude data was corrected for bias field using ANTs tool2 and was averaged for all echo times. The respective averaged magnitude data was then utilized to create brain masks using FSL bet tool3. A study template was constructed by registering the magnitude images of all subjects. QSM reconstruction was performed on multi-echo phase data using the QSMbox toolbox1. Subject to template ANTs registration transformation files were used to build a QSM study template for human and monkey data, respectively (Fig. 2) on which regions of interests were drawn manually using the ITK-SNAP tool4 (Fig. 3).
Acknowledgements
No acknowledgement found.References
1. Acosta-Cabronero, J et al. A robust multi-scale approach to quantitative susceptibility mapping. NeuroImage, 2018.
2. Avants, B B et al. A reproducible evaluation of ANTs similarity metric performance in brain image registration. NeuroImage, 2010.
3. Smith, S M et al. Fast robust automated brain extraction. Human Brain Mapping, 2002.
4. Yushkevich, Paul A et al. User-guided 3D active contour segmentation of anatomical structures: Significantly improved efficiency and reliability. NeuroImage 2006.
Figures