4918
Non-invasive detection of molecular profiles in the human brain.1The Edmond and Lily Safra Center for Brain Sciences, The Hebrew University of Jerusalem, Jerusalem, Israel
Synopsis
Lipids makes more than 40% of the human brain in dry weight, and have broad information carrying roles in the CNS. In-vivo quantitative MRI (qMRI) aims at characterizing the biological properties of brain tissue. However, it lacks specificity to the molecular environment. Here, we present a novel biophysical framework that allows to decode the lipid composition of brain tissue from the MRI signal. First, we tested our approach on lipid samples of known composition. Next, by comparing the our molecular-specific measures to postmortem histological data, we were able to predict in-vivo lipidomic profiles in the human brain.
Introduction
Lipids makes more than 40% of the human brain in dry weight, and have broad information carrying roles in the CNS1. Lipidome changes are associated with a wide spectrum of neurological and psychiatric diseases2–6. Unfortunately, such molecular changes are not readily accessible by current in-vivo imaging methods.
In-vivo quantitative MRI (qMRI) aims at characterizing the biological properties of brain tissue7. However, the specificity of current qMRI measurements to the molecular environment is hampered by the profound effect of the water content on the MRI signal8,9. We recently developed a novel qMRI analysis that separately evaluates the tissue composition and the water content of the human brain10. For this purpose, we computed the Multidimensional Dependency on MTV ("MDM") of several qMRI parameters. Here, we present a novel MDM biophysical framework that allows to decode the lipid composition of brain tissue from the MRI signal. First, we tested our approach on lipid samples of known composition. Next, by comparing the molecular-specific MDM measures to postmortem histological data, we modeled the connection between these novel qMRI parameters and lipidomic profiles in the human brain.
Methods
Phantoms: We prepared lipid mixtures containing common brain lipids (phosphatidylcholine (PtdCho), sphingomyelin (Spg) and phosphatidylserine (PS)) in varying volume ratios (1:1,1:2,2:1,0:1,1:0). The non-water fraction of these samples can be estimated by the qMRI measurement of lipid and macromolecular tissue volume (MTV)11. The phantoms were scanned using the same protocols used for the human subjects (below).
Human subjects: 23 healthy volunteers (aged 27 ± 2 years, 11 females) were scanned on a 3T MRI scanner for multi-parametric mapping: MTV and R111, MT saturation (MTsat)12, R213 and MD. Different brain regions were segmented using FreeSurfer14.
Results
We evaluated the linear relationships between different qMRI parameters and the non-water fraction estimated by MTV ("MDM measurements"). We then developed a biophysical model relating these strong linear dependencies to the molecular composition.
First, we formulated the problem on a controlled system of lipid mixtures. We found that the qMRI measurements of a mixture can be predicted by summing the MDM measurements of pure lipids (Fig. 1). This linear model can be further developed to allow prediction of the lipid composition of a mixture from its MDM measurements (Fig. 2). This model provided a good estimation of the Spg and PS content but failed to predict PtdCho content.
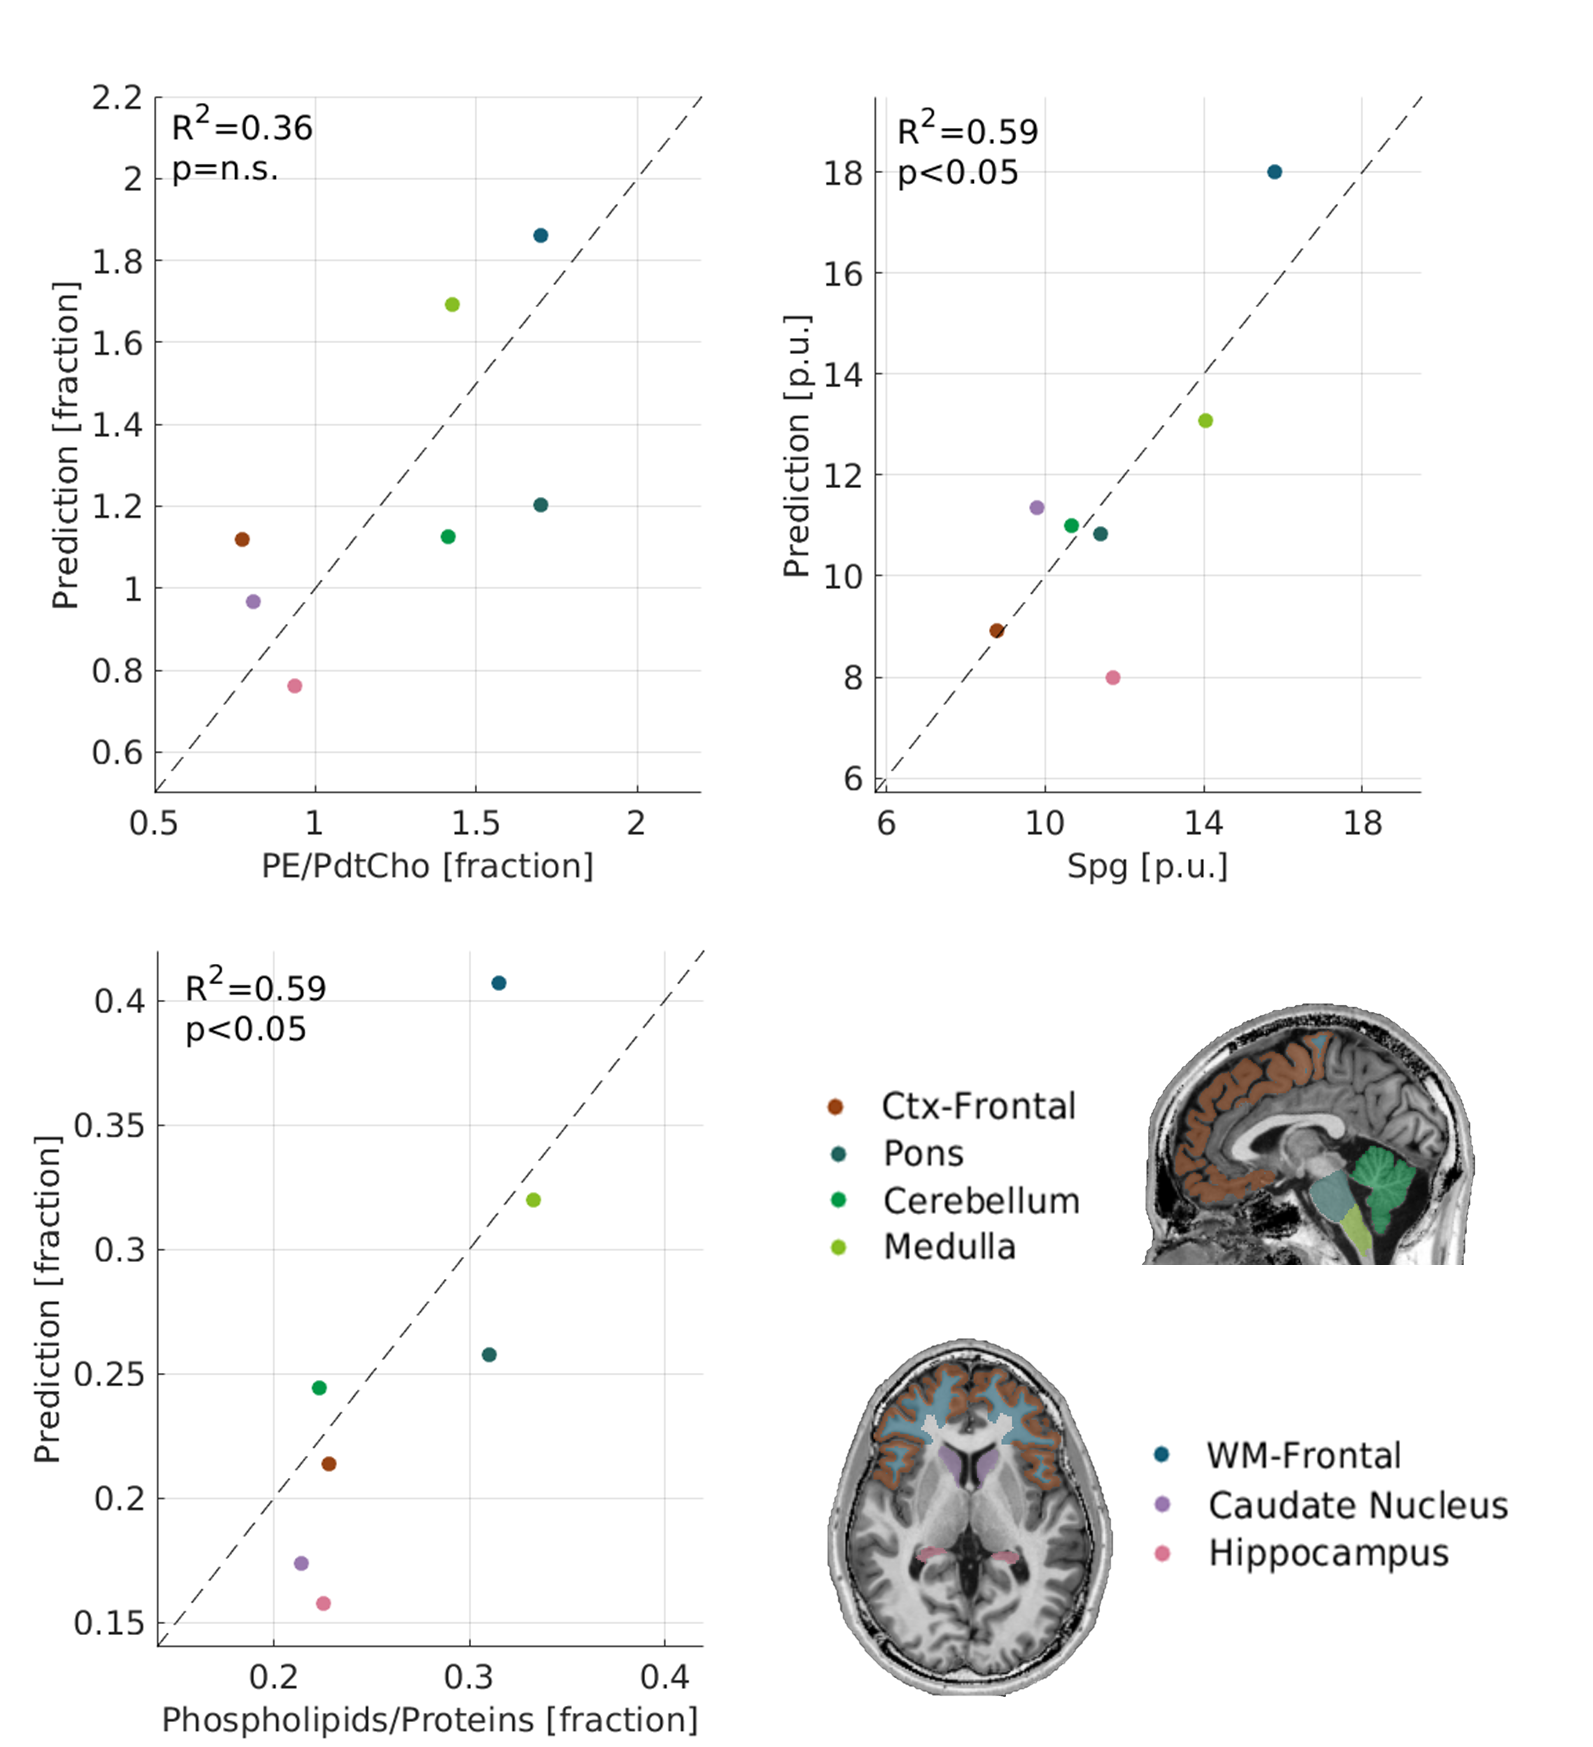
Next, we used the MDM approach to predict the molecular composition of the human brain. We therefore compared the MDM measurements to a previous study that reported the phospholipid composition of the human brain4. First, we established the comparability between the in-vivo MRI measurements and the reported postmortem data. We found good agreement between the in-vivo measurement of MTV and the total phospholipid content (Fig. 3A). Söderberg et al. (1990) identified a unique phospholipid composition for different brain regions along with diverse ratios of phospholipids to proteins and cholesterol4. We compared this regional molecular variability to the variability in the MDM measurements. Since there are multiple ex-vivo molecular and in-vivo MDM measurements we performed principal component analysis (PCA) on each dataset to capture the main axes of variation across brain regions. We found that these regional projections are highly correlated (Fig. 3B). Therefore, brain regions with a similar molecular composition have similar MDM measurements. Standard qMRI parameters were not as strongly correlated with the molecular composition as the MDM (Fig. 4). Following our content predictions for lipids samples, we constructed a linear model for the human brain. To avoid over fitting, we reduced the number of fitted parameters by including only the MDM and the molecular features that accounted for most of the regional variability. Remarkably, MRI-driven MDM measurements provided good predictions for the regional sphingomyelin composition and the regional ratio of phospholipids to proteins (Fig. 5).
Conclusion
Here we present a novel qMRI approach for non-invasive mapping of the molecular composition of the human brain, which was validated on lipids samples and compared with histological measurements. Our work is part of a major paradigm shift in the field of MRI toward in-vivo histology15–17. We contribute to this important change by providing a hypothesis-driven biophysical framework that was rigorously developed starting from simple lipid mixtures to the overly complex human brain. Early observations relate different qMRI parameters to changes in the fraction of myelin7,15,17,18. The current approach enriches this view and provides better sensitivity to the molecular composition and fraction of myelin and other cellular tissues. We present theoretical and experimental evidence for the promising predictive power of our approach, which may further advance in-vivo human brain research.Acknowledgements
This work was supported by the ISF grant 0399306, awarded to A.A.M. We acknowledge Ady Zelman for the assistance in collecting of the human MRI data. We thank Assaf Friedler for assigning research lab space and advising for the lipids samples experiments. We thank Magnus Soderberg for advising on histological data interpretation.References
1. Piomelli, D., Astarita, G. & Rapaka, R. A neuroscientist’s guide to lipidomics. Nat. Rev. Neurosci. 8, 743–754 (2007).
2. Lauwers, E. et al. Membrane Lipids in Presynaptic Function and Disease. Neuron 90, 11–25 (Elsevier, 2016).
3. Fantini, J. (Jacques) & Yahi, N. Brain lipids in synaptic function and neurological disease : clues to innovative therapeutic strategies for brain disorders. (Academic Press, 2015).
4. Söderberg, M., Edlund, C., Kristensson, K. & Dallner, G. Lipid Compositions of Different Regions of the Human Brain During Aging. J. Neurochem. 54, 415–423 (1990).
5. Sethi, S., Hayashi, M. A., Sussulini, A., Tasic, L. & Brietzke, E. Analytical approaches for lipidomics and its potential applications in neuropsychiatric disorders. World J. Biol. Psychiatry 18, 506–520 (2017).
6. Naudí, A. et al. Lipidomics of Human Brain Aging and Alzheimer’s Disease Pathology. Int. Rev. Neurobiol. 122, 133–189 (2015).
7. Cercignani, M., Dowell, N. G. & Tofts, P. S. Quantitative MRI of the Brain : Principles of Physical Measurement. (CRC Press, 2018).
8. Fullerton, G. D., Potter, J. L. & Dornbluth, N. C. NMR relaxation of protons in tissues and other macromolecular water solutions. Magn. Reson. Imaging 1, 209–26 (1982).
9. Filo, S. & Mezer, A. A. in Quantitative MRI of the Brain : Principles of Physical Measurement (eds. Cercignani, M., Dowell, N. G. & Tofts, P. S.) 55–72 (CRC Press, 2018). doi:10.1201/B21837-4
10. Filo, S., Shtangel, O. & Mezer, A. Disentangling the contributions of brain tissue fraction and composition to quantitative MRI. in Joint Annual Meeting ISMRM-ESMRMB 2018
11. Mezer, A. et al. Quantifying the local tissue volume and composition in individual brains with magnetic resonance imaging. Nat. Med. 19, 1667–72 (2013).
12. Helms, G., Dathe, H., Kallenberg, K. & Dechent, P. High-resolution maps of magnetization transfer with inherent correction for RF inhomogeneity and T 1 relaxation obtained from 3D FLASH MRI. Magn. Reson. Med. 60, 1396–1407 (2008).
13. Ben-Eliezer, N., Sodickson, D. K. & Block, K. T. Rapid and accurate T 2 mapping from multi-spin-echo data using Bloch-simulation-based reconstruction. Magn. Reson. Med. 73, 809–817 (2015).
14. Fischl, B. FreeSurfer. Neuroimage 62, 774–781 (2012).
15. Does, M. D. Inferring brain tissue composition and microstructure via MR relaxometry. Neuroimage (2018). doi:10.1016/J.Neuroimage.2017.12.087
16. Callaghan, M. F., Helms, G., Lutti, A., Mohammadi, S. & Weiskopf, N. A general linear relaxometry model of R1 using imaging data. Magn. Reson. Med. 73, 1309–14 (2015).
17. Weiskopf, N., Mohammadi, S., Lutti, A. & Callaghan, M. F. Advances in MRI-based computational neuroanatomy. Curr. Opin. Neurol. 28, 313–322 (2015).
18. Schmitt, S., Cantuti Castelvetri, L. & Simons, M. Metabolism and functions of lipids in myelin. Biochim. Biophys. Acta - Mol. Cell Biol. Lipids 1851, 999–1005 (2015).
Figures
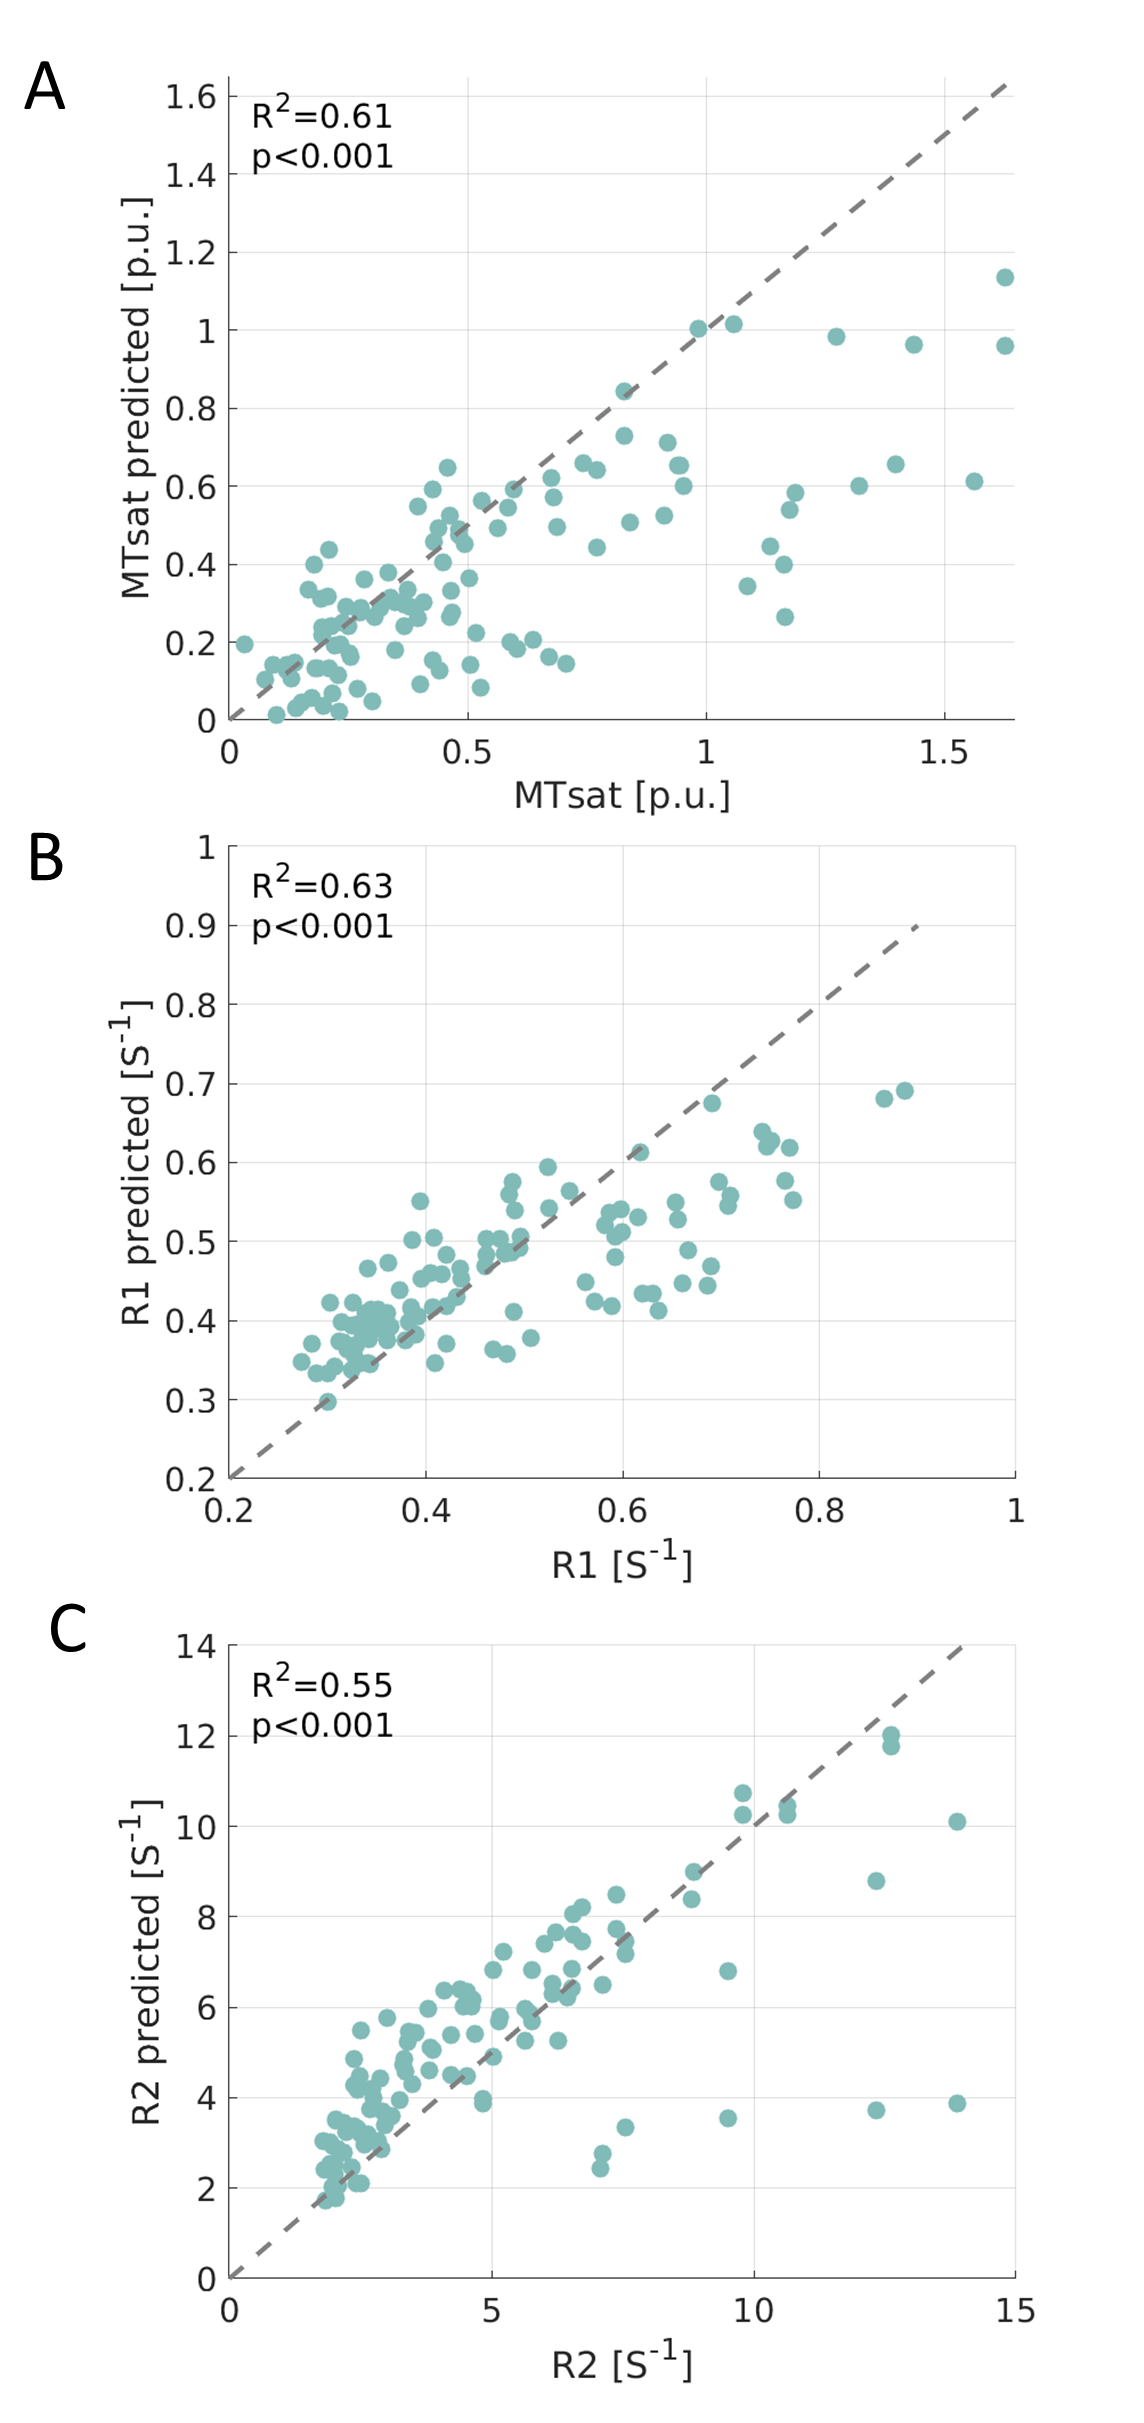
Predicting the MRI signal of a lipid mixture from the signal of pure lipids.
MTsat (A) R1 (B) and R2 (C) measurements of lipid mixtures were predicted from the MTV dependencies of pure lipids:
qMRI=∑fi(dqMRI/dMTVi*MTV+bi)
Where the sum is over the number of lipids in the mixture and fi is the fraction of the i'th lipid from the total lipid volume. dqMRI/dMTVi and bi are the slope and the intersection of the relationship between qMRI parameters and MTV (MDM measurments) in the pure lipids. Predicted qMRI measures (y axis) are compared to the true values (x axis).
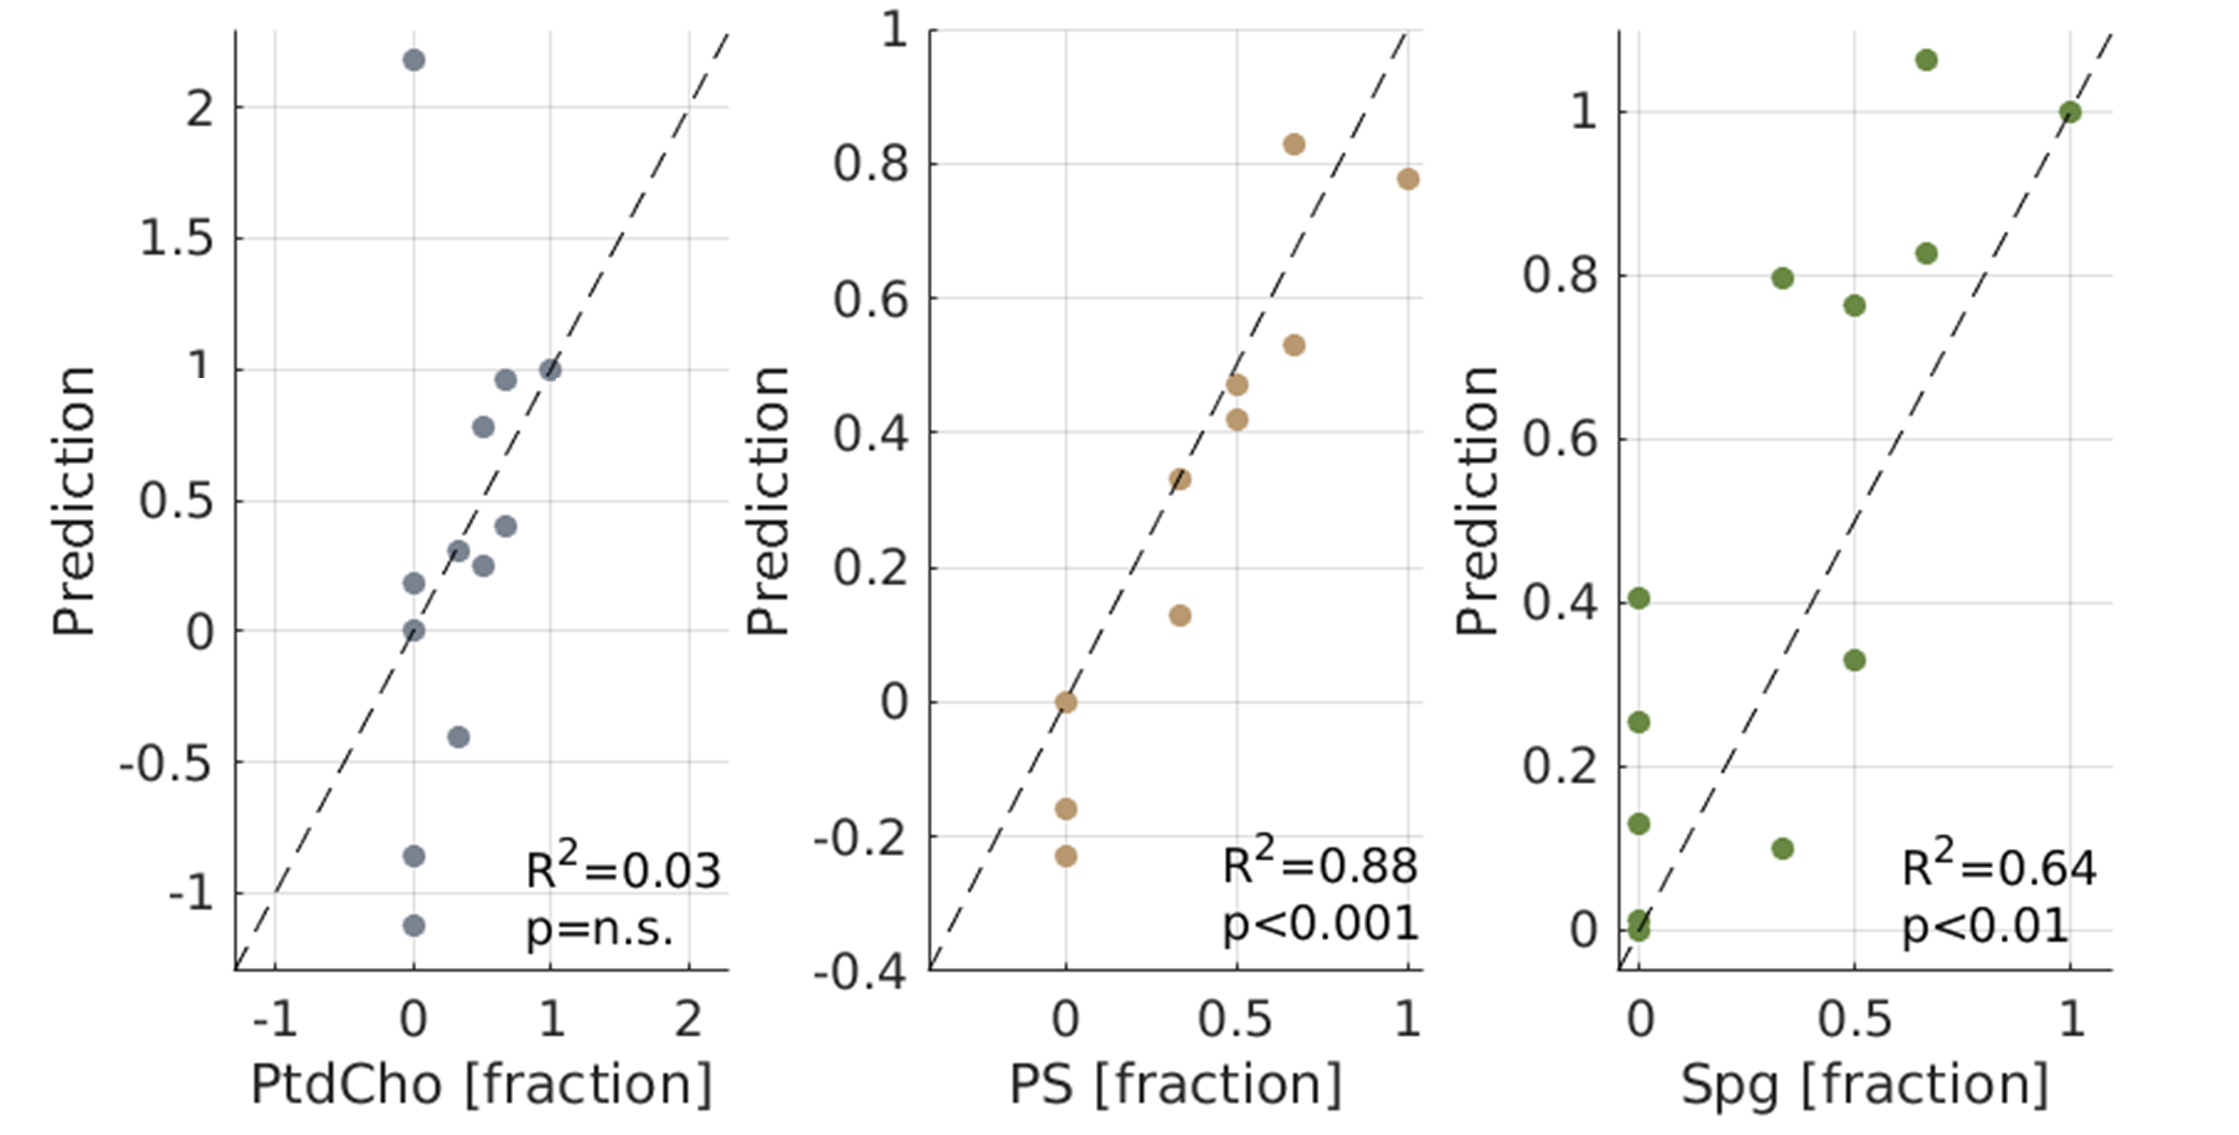
Predicting the composition of lipid mixtures using the MDM method.
The mixtures were composed of different PtdCho:PS:Spg ratios. MDM-based predictions were computed according to a biophysical model as a linear combination of the MDM measurements of the mixtures and the pure lipids:
[F]=[Mpure]-1·[Mmix]
Where Mmix is a vector of MDM measurements of a lipid mixture. F is a vector of the lipid fractions of the mixture, and Mpure is a matrix of the MDM measurements of the pure lipids. Predicted fractions (y axes) are compared to the true fraction (x axes). Dashed lines mark the identity line.
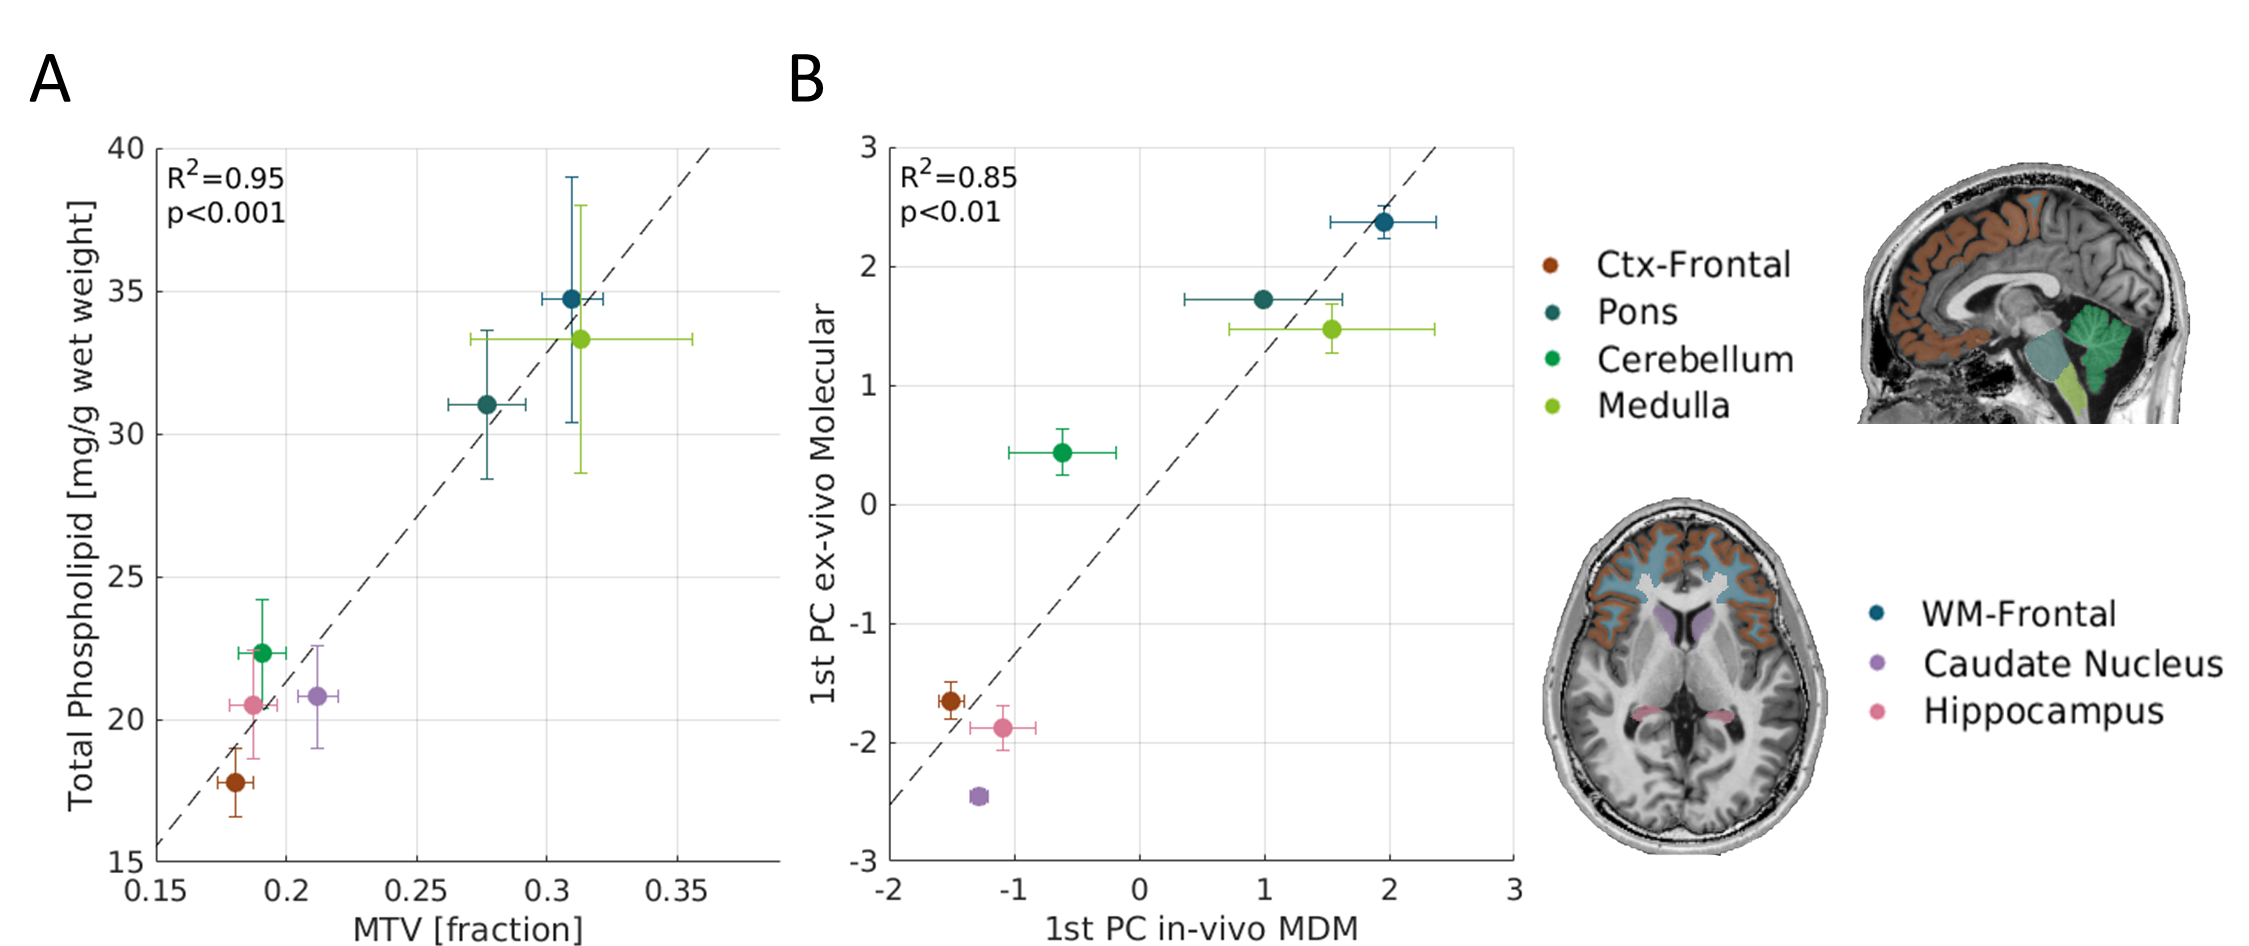
Establishing the agreement between the postmortem dataset and the in-vivo MDM measurements.
(A) Comparison of the total phospholipid content derived from the literature (y-axis) and the average MTV measurement across the human subjects (x-axis) in 7 different brain regions. MTV measures the non-water fraction of the tissue, which is directly related to the total phospholipid content.
(B) The similarity between the ex-vivo molecular variability and the in-vivo MDM variability across 7 brain regions. The projection of different brain regions on the 1st PC of ex-vivo molecular variability (y-axis) vs. their projection on the 1st PC of in-vivo MDM (x-axis).
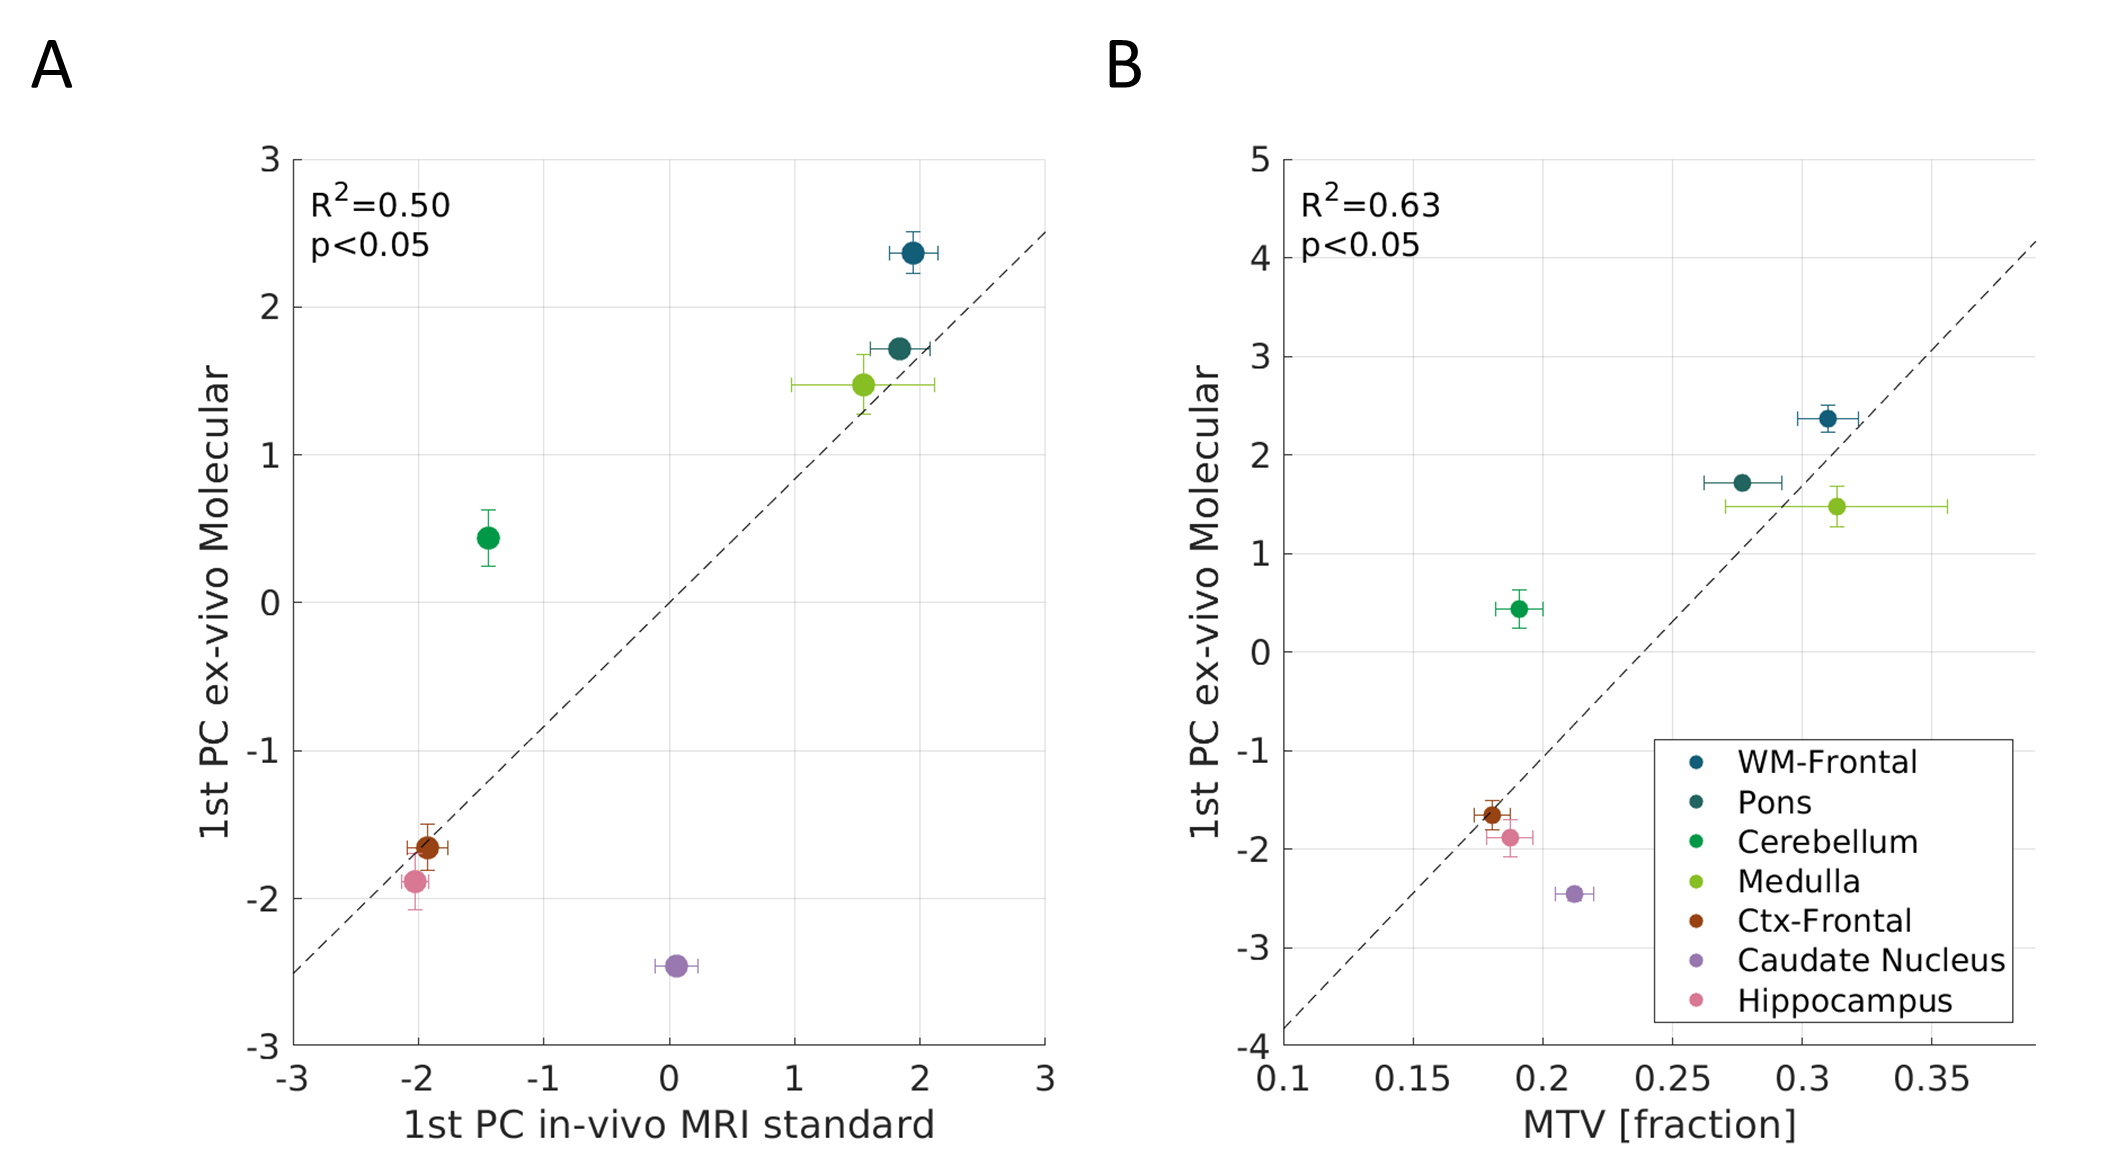
Correlation of the molecular variability with standard qMRI parameters and MTV.
The projection of different brain regions on the 1st PC of molecular variability (y-axis) vs. their projection on the 1st PC of standard qMRI parameters (A, x-axis) and MTV (B, x-axis). These correlations are lower than the correlation of the molecular variability with the PC of MDM (Fig.3B). Note that the cerebellum and the caudate nucleus have different molecular compositions. This tissue property was not detected by conventional in-vivo qMRI methods. Nonetheless, the MDM projection reflects the molecular variability of these brain regions (Fig. 3B).