4911
An inhomogeneous magnetization transfer (ihMT) quantification method robust to B1 and T1 variations in magnetization prepared acquisitions1Radiology, Division of MR Research, Beth Israel Deaconess Medical Center, Harvard Medical School, Boston, MA, United States, 2Aix Marseille Univ, CNRS, CRMBM, Marseille, France
Synopsis
Standard MT and ihMT ratio (ihMTR) measures can be sensitive to B1 and T1, making them less specific to tissue microstructure. Using the inverse signal, i.e. one divided by the signal, and a high flip-angle reference image in calculation of an ihMTR metric has been proposed as a metric with improved insensitivity to T1 and B1 in steady-state gradient-echo sequences. We present a modified method for use in prepared sequences such as magnetization prepared rapid gradient echo (MPRAGE). The sensitivity of ihMT MPRAGE metrics to T1 and B1 was tested using simulations and acquisitions in brains of healthy volunteers.
Introduction
The inhomogeneous magnetization transfer (ihMT) signal can be used to characterize myelinated tissues and extract information on dipolar order1. IhMT sensitive images can be acquired either by interleaving RF irradiation into a stead-state acquisition2, e.g. spoiled gradient echo (SPGR)3, or by applying irradiation in a preparation module prior to acquisition4, such as magnetization prepared rapid gradient echo acquisition5 (MPRAGE) (Fig. 1a). IhMT prepared MPRAGE (or ihMTRAGE) can utilize the low duty cycle preparation that increases the ihMT signal while maintaining or lowering specific absorption rates4.
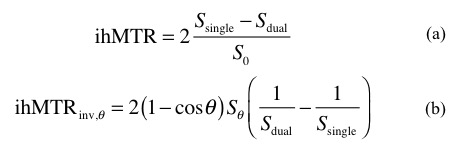
The approach to quantifying ihMT can affect its specificity and sensitivity. The ratio of the ihMT signal over that with no MT preparation, i.e. ihMTR, provides a semi-quantitative metric (Fig. 2a), but is dependent on a combination of quantitative parameters1. Use of the inverse ihMT signal along with a high flip-angle (FA) reference in a steady-state ihMT sequence has been proposed as a more B1 and T1 independent measure3,6. The B1 independence depends on a linear relationship of the inverse subtraction with power, as achieved in low duty cycle preparations4. In this work, we demonstrate the (in)dependence of the ihMTRAGE sequence to T1 and B1 using the inverse ihMT signal multiplied by a reference acquisition with an SPGR like preparation. We carry out simulations and in vivo experiments to study the combination of the inverse ihMT signal with an SPGR preparation before the MPRAGE acquisition to mimic a high FA reference.
Methods
The MT preparation for ihMTRAGE consisted of 5ms pulses (rectangular/trapezoid-like for simulations/experiments) repeated ten times (every 100ms for 1s), with peak B1 of 14μT (for single frequency RF irradiation at off-resonance Δ) (Fig. 1a). The SPGR-like module consisted of RF-spoiled on-resonance pulses with a 25ms repetition time (TR) applied 40 times over 1s (Fig. 1b). Several FAs for the on-resonance pulses were evaluated. An adiabatic spectrally selective inversion (ASPIR) pulse was also included in the last TR of the reference to mitigate fat signal contamination in the reference. IhMT signals were simulated using numerical integration of the differential equations associated with a model for ihMT, and parameters based on white matter (WM)4.
All experiments were carried out on a 3T scanner with a 32-channel receive coil. Data were collected from the brains of healthy volunteers (n=5). IhMTR and inverse ihMT, ihMTRinv,θ metrics were calculated (Figs. 2a-b). Acquisition of high FA SPGR-like preparations with two FAs (25° and 45°) along with the zero power reference allowed construction of a pseudo-T1 map7. B1 mapping was conducted based on the Bloch-Siegert shift8 and calculated as the ratio of the actual FA to that prescribed.
Results
Simulations provide a guide as to the response of the ihMT signal metrics to variations in parameters. Both ihMTR and the inverse ihMT signal show an increase with B1 and T1 (Figs. 3a-b). Multiplication of the inverse ihMT by the signal from SPGR-like preparations (Fig. 2b) compensates for changes in simulated T1. The sensitivity of ihMTRinv,θ to B1 was dependent on FA (Figs. 3c-d): IhMTRinv,45° showed good insensitivity around the nominal B1. IhMTRinv,25° showed insensitivity to increases in B1, but greater sensitivity to decreases in B1 than ihMTRinv,45°.
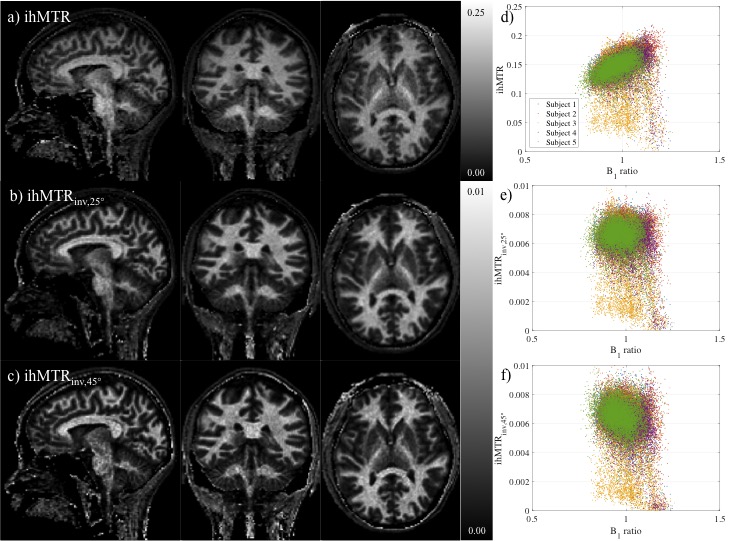
IhMTRAGE data were of good image quality but ihMTRinv,45° images appeared noisier than ihMTRinv,25° (Figs. 4b-c). This is a result of the low signal from extreme T1 weighting of the 45° reference data. Both ihMTRinv metrics showed greater insensitivity to the variation in B1 in WM, with a variance divided by the mean value across manually selected WM regions in all subjects of 3x10⁻⁴, compared with 4x10⁻³ for ihMTR (Figs. 4d-f). WM in and around the CC only was used to assess the effect of T1 variation to limit contribution from B1 inhomogeneity (Figs. 5a-c). IhMTRinv,25° provided the smallest variance divided by mean value of 7x10⁻⁴. A negative correlation was observed between T1 and all three ihMT metrics (Figs. 5d-f), which was strongest for ihMTRinv,45°. The implications of this correlation are uncertain, since higher myelin density should decrease T1 and increase ihMT measures.
Discussion
Inverse subtraction and a high FA reference can provide a simple, more robust measure for myelin imaging. Though simulations suggest use of a 45° FA is more robust to B1, the poor SNR of the resultant acquisition makes use of a lower FA reference, such as 25°, preferable. Further validation of the inverse metric by comparison with quantitative ihMT model fitting should be evaluated.Conclusion
The inverse ihMT signal from the ihMTRAGE acquisition continues to provide a metric that is robust to T1 and B1, and thus more specific to microstructural properties of myelin that determine dipolar order relaxation. For magnetization prepared acquisitions, there is a trade-off between simulated robustness and SNR.Acknowledgements
No acknowledgement found.References
1. Varma, G. et al. Interpretation of magnetization transfer from inhomogeneously broadened lines (ihMT) in tissues as a dipolar order effect within motion restricted molecules. J. Magn. Reson. 260, 67–76 (2015).
2. Mchinda, S. et al. Whole brain inhomogeneous magnetization transfer (ihMT) imaging: Sensitivity enhancement within a steady-state gradient echo sequence. Magn. Reson. Med. 79, 2607–2619 (2018).
3. Geeraert, B. L. et al. A comparison of inhomogeneous magnetization transfer, myelin volume fraction, and diffusion tensor imaging measures in healthy children. Neuroimage [Epub ahead of print] (2017). doi:10.1016/j.neuroimage.2017.09.019
4. Varma, G. et al. Low duty-cycle pulsed irradiation reduces magnetization transfer and increases the inhomogeneous magnetization transfer effect. J. Magn. Reson. (2018). doi:10.1016/j.jmr.2018.08.004
5. Saranathan, M., Tourdias, T., Bayram, E., Ghanouni, P. & Rutt, B. K. Optimization of white-matter-nulled magnetization prepared rapid gradient echo (MP-RAGE) imaging. Magn. Reson. Med. 73, 1786–1794 (2015).
6. Varma, G., Girard, O. M., Prevost, V., Duhamel, G. & Alsop, D. C. Extracting a robust inhomogeneous magnetization transfer (ihMT) rate parameter, ihMT-Rex. in Proceedings 23rd Scientific Meeting, International Society for Magnetic Resonance in Medicine 3357 (2015).
7. Preibisch, C. & Deichmann, R. Influence of RF Spoiling on the Stability and Accuracy of T1 Mapping Based on Spoiled FLASH With Varying Flip Angles. Magn. Reson. Med. 61, 125–135 (2009).
8. Sacolick, L. I., Wiesinger, F., Hancu, I. & Vogel, M. W. B 1 mapping by Bloch-Siegert shift. Magn. Reson. Med. 63, 1315–1322 (2010).
Figures