4909
Stain-free histology to validate quantitative MRI1Ecole Polytechnique de Montreal, Montreal, QC, Canada, 2Montreal Health Institute, Montreal, QC, Canada, 3Department of Clinical Neuroscience, Karolinska Institutet, Sweden, Sweden, 4Division of Neuroradiology, Department of Radiology, Karolinska University Hospital, Stockholm, Sweden, 5Functional Neuroimaging Unit, CRIUGM, Université de Montréal, Montreal, QC, Canada
Synopsis
Quantitative MRI (qMRI) is reproducible but often lacks calibration and/or specificity to the underlying microstructure. Light transmission optical histology of stained tissue is a popular method for validation, however, it is hampered by calibration issues and inhomogeneous penetration of staining agents. We propose a method to validate quantitative MRI metrics using stainless histology by utilizing the innate autofluorescence spectra of tissues when excited with ultraviolet laser. We demonstrate a proof-of-concept application of a qMRI validation pipeline on a pig spinal cord section with in vivo and ex vivo qMRI followed by histological autofluorescence microscopy to quantify myelin content.
Purpose:
Quantitative MRI (qMRI) is designed to measure intrinsic MR properties of tissue with high repeatability and accuracy across different scanners, sites and over time. However, qMRI is often hampered by poor tissue-specificity as it only provides indirect measures of the underlying microstructure. T1 and T2 relaxations times, proton density (PD) and magnetization transfer (MT) are commonly used in studies of the central nervous system. However, these techniques do not directly relate to histopathological features such as the density and volume of axons, neuronal somas and glial cells, nor do they directly relate to myelin content. This disconnect makes it difficult to interpret the underlyings processes of qMRI measures. Efforts in linking qMRI to histology measurements (e.g., electron microscopy, immunostaining techniques) are often hampered by histology biases such as issues related to the specificity of the staining technique and inhomogeneous penetration of the staining agents [1].
In this study, we establish a fast and accurate qMRI validation protocol based on a staining-free, high resolution (~300 nm) single-photon multi-spectral UV-autofluorescence, adapted from Christensen et al [2]. In short, tissues are discriminated based on their specific auto-fluorescence spectra. In addition, we propose a proof-of-concept application on a pig spinal cord section in order to perform validation of multiple qMRI techniques ability to quantify myelin.
Methods:
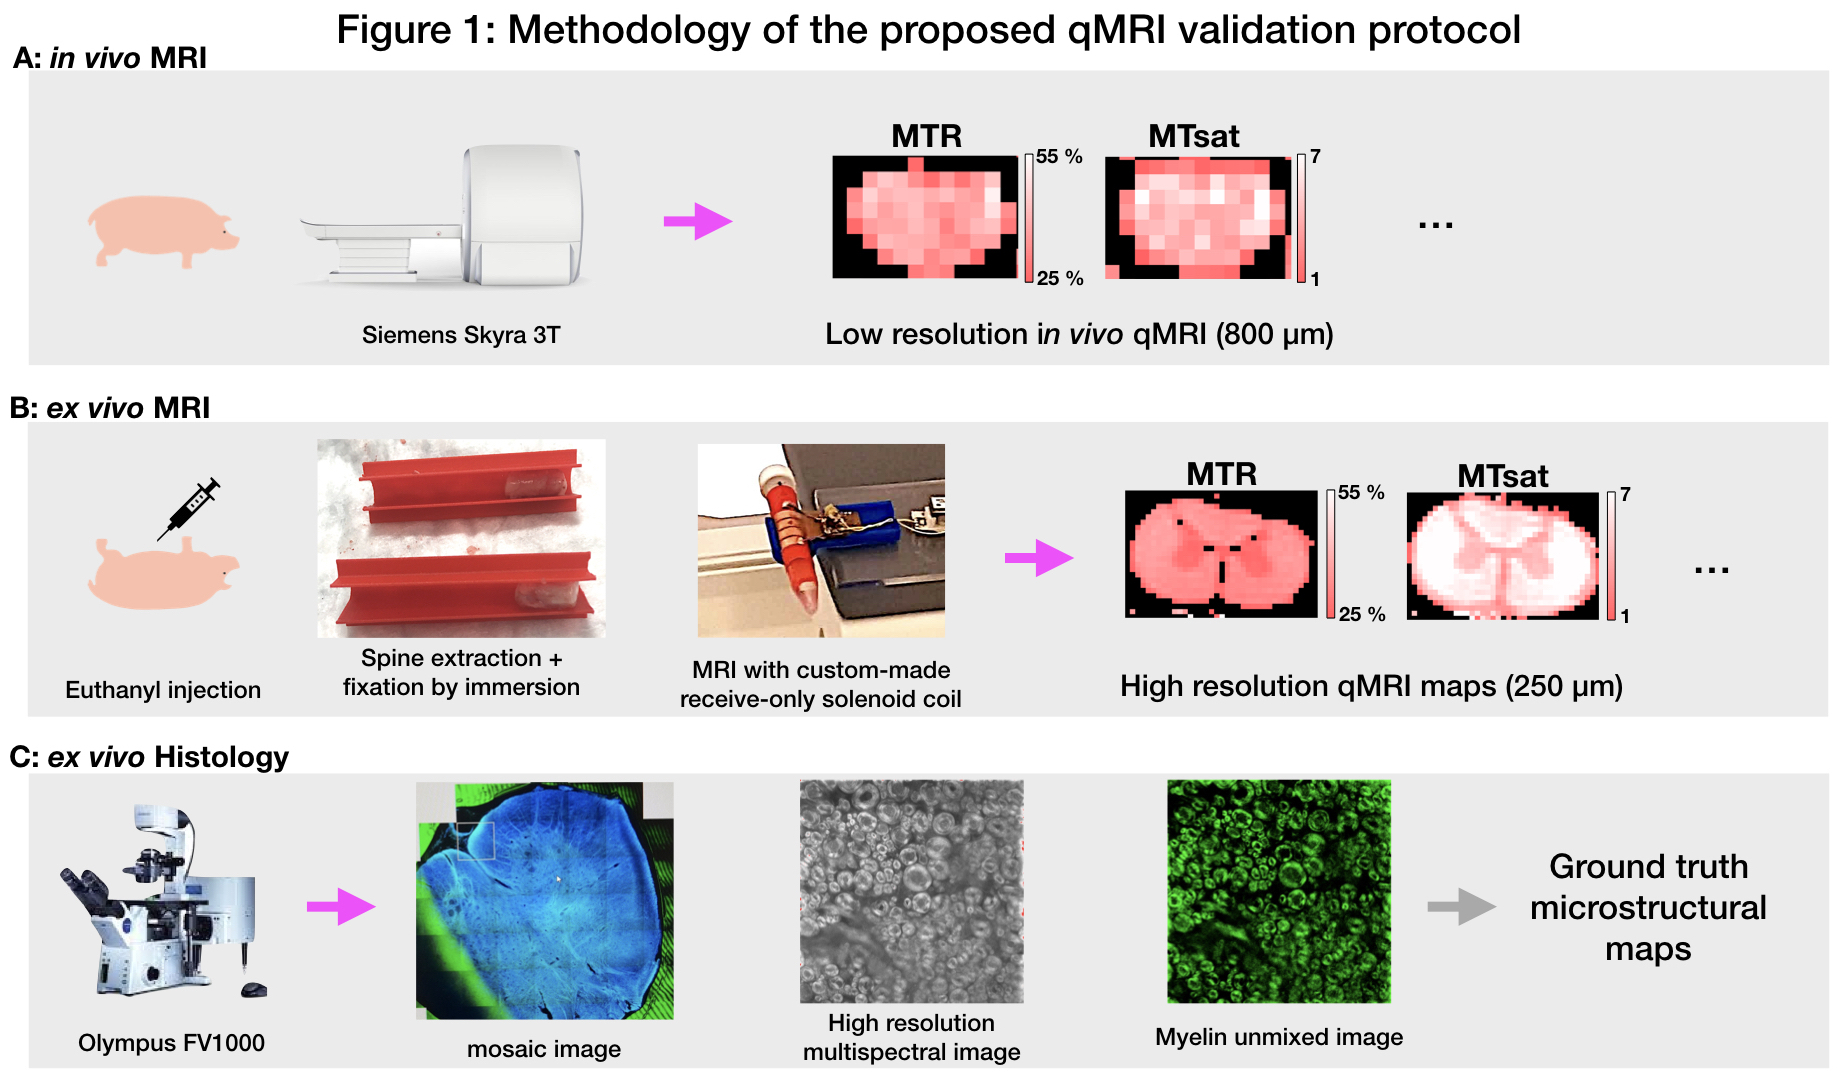
qMRI acquisitions. A pig (24 kg) was scanned in vivo on a 3T Siemens Skyra with a 24-channel spine coil. The following axial qMRI protocol was used: MTR/MTsat (0.8×0.8×5.0 mm, TR 35 ms, TE 3.13 ms, FA 9°), Synthetic MR [3] (0.8×0.8×5.0 mm, TR 4000 ms, TE1 25 ms, TE2 99 ms, TI 100 ms, FA 150°) and Diffusion-weighted imaging (0.9×0.9×5.0 mm, TR 3300 ms, TE 89 ms, 30 directions).
Tissue extraction. After the scan, the pig was sacrificed by euthanyl injection. The cervical area of the spinal cord was extracted within 2 h and fixed by immersion in a 3% paraformaldehyde and 3% glutaraldehyde solution. After 4 days, the sample was scanned on the same MRI using a custom solenoid coil, with a higher resolution protocol: MTR/MTsat (0.24×0.24×3.0 mm, TR 45 ms, TE 4.52 ms, FA 9°), Synthetic MR (0.24×0.24×3 mm, TR 4000.0 ms, TE1 30 ms, TE2 106 ms, TI 100 ms, FA 150°) and Diffusion-weighted imaging (voxel size 0.7×0.7×3 mm, TR 2200 ms, TE 92 ms, 6 directions). Figure 1 illustrates the whole procedure.
Histology acquisition. A 300 µm thick slice was mounted on a cover slip and scanned using a confocal laser-scanning microscope, Olympus FV1000. A 405 nm laser was used for the UV-autofluorescence excitation and multi-spectral detection was performed on 16 channels in the wavelength range of 410-650 nm. In-plane resolution limit was 300 nm, with a 40× apochromatic objective of NA=0.95 (in air). The integration time per pixel was 20 µs and 5 averages were recorded for each frame. An automatic mosaic scan mode was used to cover the full spinal cord section.
Processing. The 16 spectral channels from the microscopy were used to unmix the fluorescence signal of myelin from surrounding tissue. Thereafter, the ground truth myelin volume fraction could be computed. The Spinal Cord Toolbox [4] was used to compute the following quantitative MRI maps: MTR, MTsat, FA and MD. The software SyMRI [3] was used to compute the quantitative T1, T2 and PD maps.
Results.
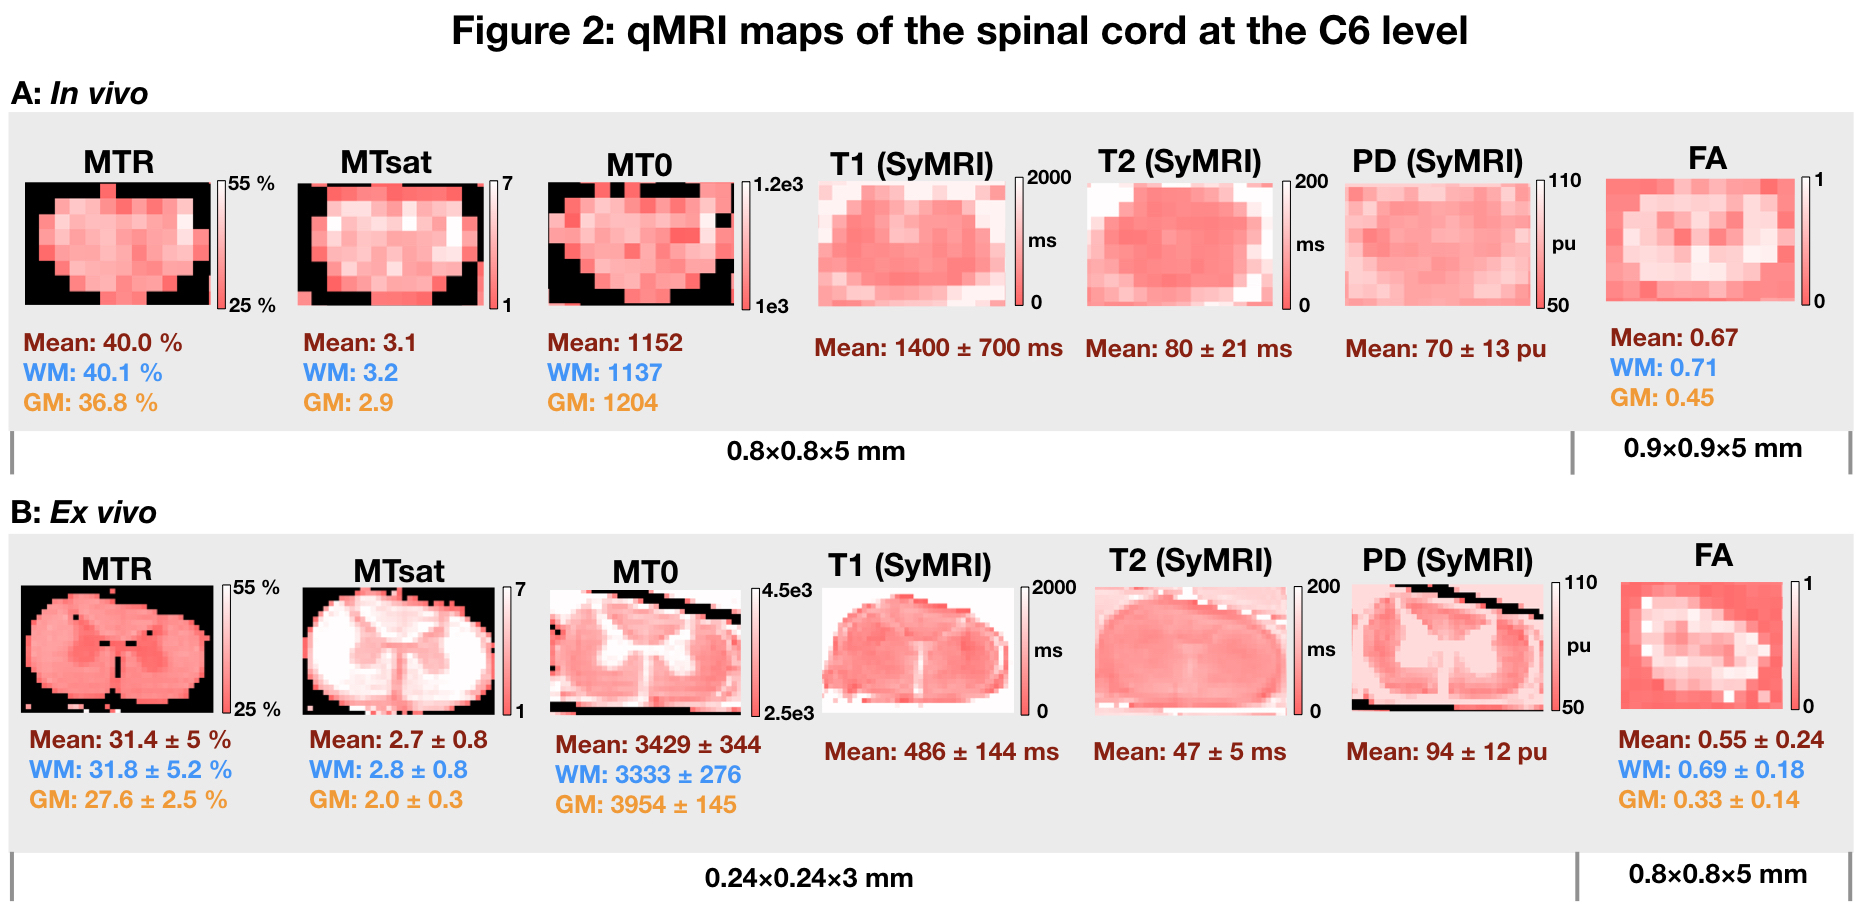
Figure 2 shows the qMRI maps of the spinal cord at the C6 level, in vivo and ex vivo. We observe a qMRI shift between in vivo and ex vivo for the T1, T2, PD and MT0 maps, while similar ranges of qMRI values are observed in MTR, MTsat and FA maps.
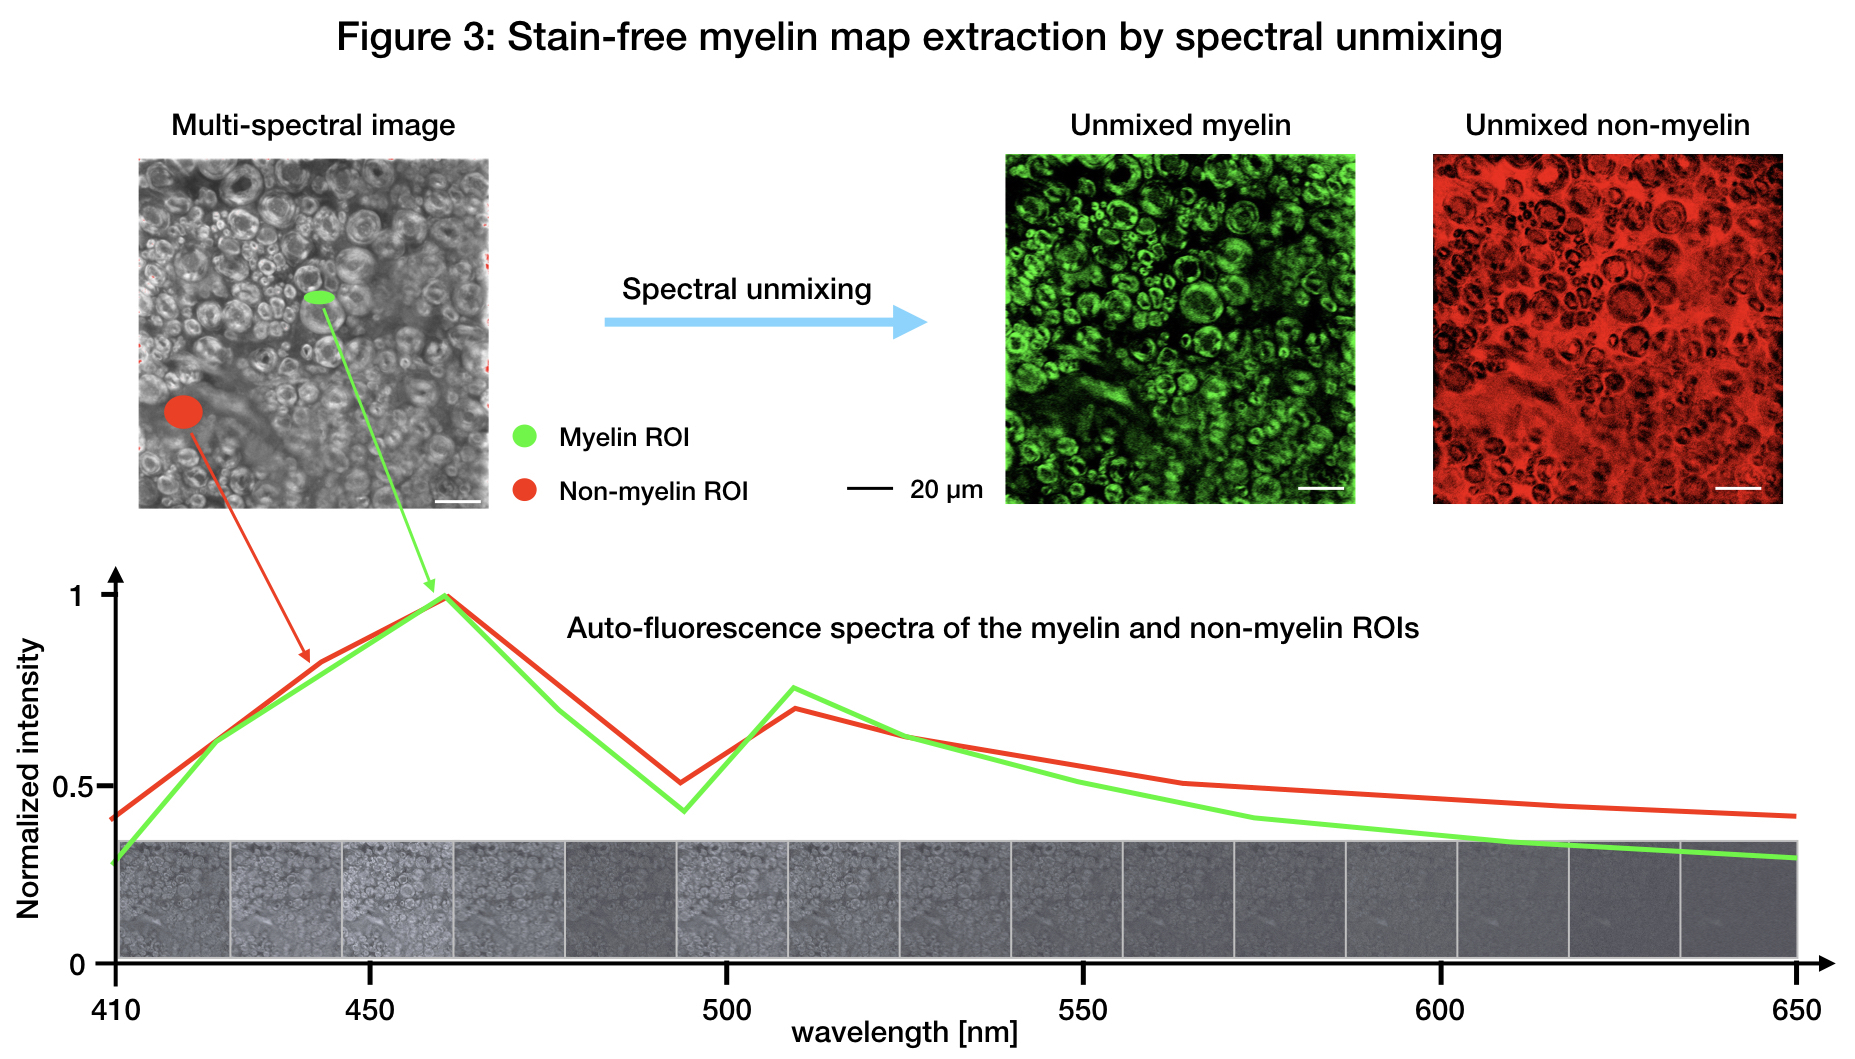
Figure 3 shows a successful unmixing of the myelin signal from the image background (non-myelin). We can observe a high-resolution image before and after the spectral deconvolution, taken in the dorsal column of C6. A similar process will be used to extract other cellular features, such as axons and glia.
Discussion/Conclusion.
We proposed a qMRI validation protocol involving a fast and staining-free histology method for quantifying myelin content. While the first results are promising, future work is required to further optimise the protocol, including: 1) Addition of a post-mortem MRI scan immediately after tissue-extraction and before the fixation process; 2) Developpement of an agar-gadolinium-based sample holder to lower Gibbs artifacts and fasten the histology slicing step; 3) Development of a statistical pipeline to assess the prediction error of histological parameters from qMRI.Acknowledgements
We thank professor S. Martel, professor M. Lavertu, Mr C. Tremblay and Dr A. Chevrier, Polytechnique Montreal for their technical help and helpful discussions. This research was supported by the Stockholm City Council and Karolinska Institutet (ALF 20150166), the Canadian Institute of Health Research (CIHR FDN-143263), Canada Research Chair in Quantitative Magnetic Resonance Imaging, the Fonds de Recherche du Québec - Santé (FRQS 28826), the Fonds de Recherche du Québec - Nature et Technologies (FRQNT 2015-PR-182754), Quebec Bio-Imaging Network (QBIN), the Natural Sciences and Engineering research Council of Canada (NSERC). Dr. Granberg was supported by the Swedish Society for Medical Research.References
1. Vincze A, Mázló M, Seress L, Komoly S, Abrahám H. A correlative light and electron microscopic study of postnatal myelination in the murine corpus callosum. Int J Dev Neurosci. 2008;26: 575–584.
2. Christensen PC, Brideau C, Poon KWC, Döring A, Yong VW, Stys PK. High-resolution fluorescence microscopy of myelin without exogenous probes. Neuroimage. 2014;87: 42–54.
3. De Leener B, Lévy S, Dupont SM, Fonov VS, Stikov N, Louis Collins D, et al. SCT: Spinal Cord Toolbox, an open-source software for processing spinal cord MRI data. Neuroimage. 2017;145: 24–43.
4. Warntjes JBM, Leinhard OD, West J, Lundberg P. Rapid magnetic resonance quantification on the brain: Optimization for clinical usage. Magn Reson Med. 2008;60: 320–329.
5. Lévy S, Benhamou M, Naaman C, Rainville P, Callot V, Cohen-Adad J. White matter atlas of the human spinal cord with estimation of partial volume effect. Neuroimage. 2015;119: 262–271.
Figures