4908
Evaluating the sensitivity of T1w/T2w, MTR, MWF and DKI to variation of myelin content1Center for Brain Imaging Science and Technology, Key Laboratory for Biomedical Engineering of Ministry of Education, College of Biomedical Engineering and Instrumental Science, Zhejiang University, HangZhou, China, 2Department of Neurology and Neurosurgery, McConnell Brain Imaging Centre, Montreal Neurological Institute and Hospital, McGill University, Montreal, QC, Canada, 3MR Collaboration, Siemens Healthcare Ltd., Shanghai, China, 4Department of Imaging Sciences, University of Rochester, Rochester, NY, United States
Synopsis
MRI metrics such as T1w/T2w ratio, magnetization transfer ratio (MTR), myelin water faction (MWF) and diffusion kurtosis imaging (DKI) indices have been used to detect myelin content. To assess the sensitivity of above metrics to variation of myelin content, in vivo human corpus callosum is used as a test case in the study. The results suggest that MTR varies least but MWF varies the most as myelin content changes.
Introduction
As previously reported1,2,3,4, MRI metrics such as T1w/T2w ratio, magnetization transfer ratio (MTR), myelin water faction (MWF) and diffusion kurtosis imaging (DKI) indices have all been used to detect myelin content in vivo. To assess the sensitivity of above metrics to variation of myelin content, the human corpus callosum (CC) is used in this study, as a test case by segmenting CC into eight regions known to have different axon radiuses, fiber densities and myelination5.Methods
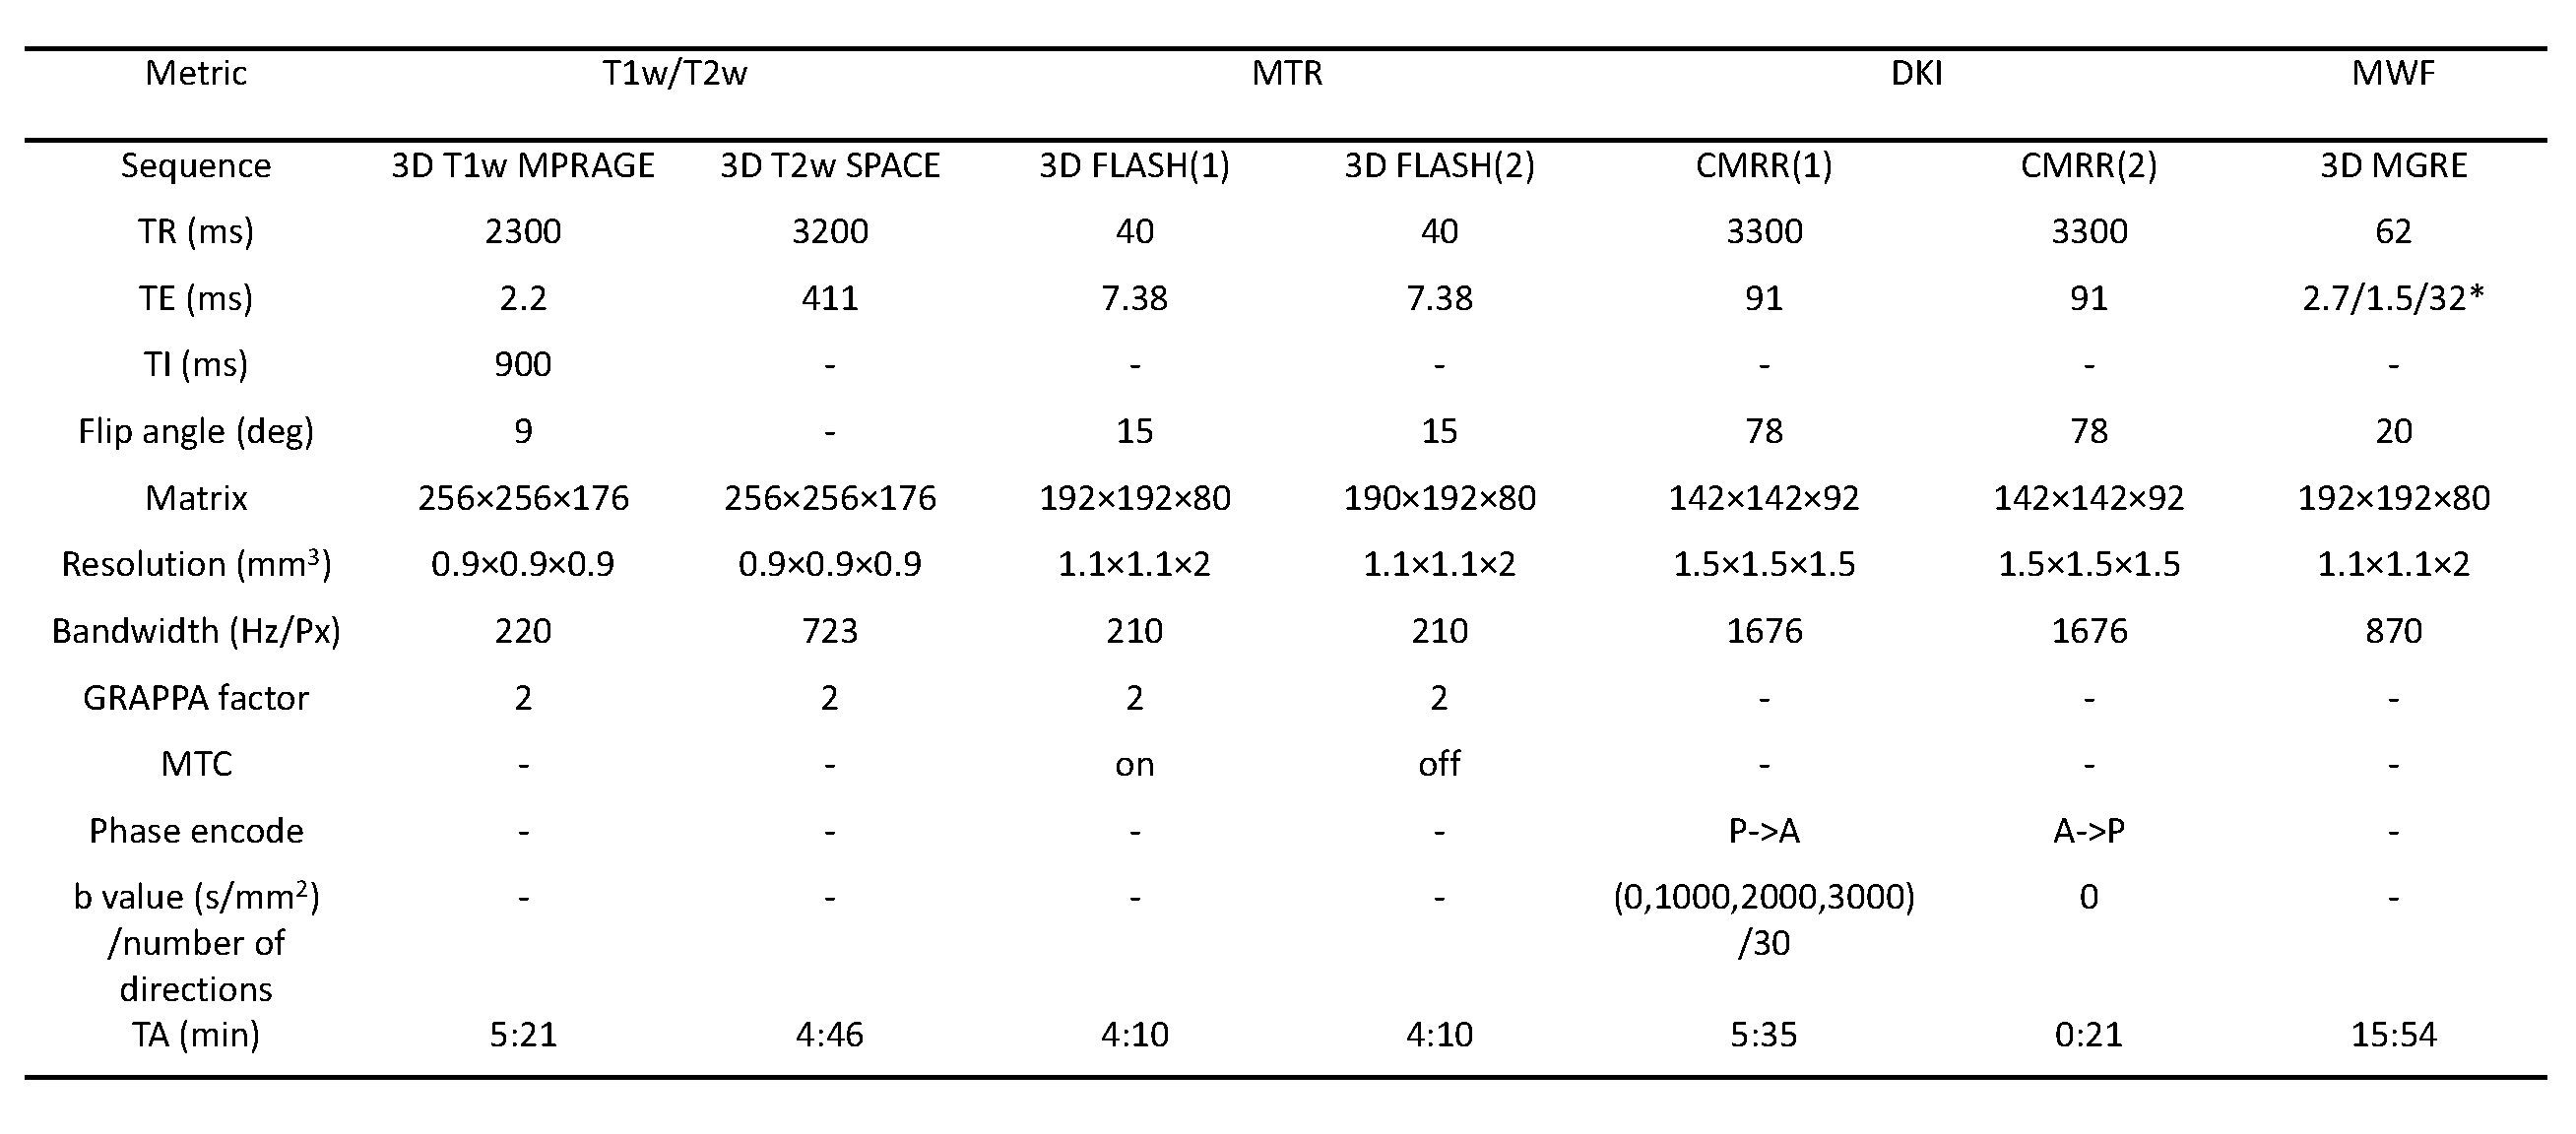
The study was approved by local institutional review board. Six healthy volunteers (4M/2F, age 22-41 years) were recruited. MRI data were acquired on a 3T MAGNETOM Prisma (Siemens Healthcare, Erlangen, Germany) equipped with a 64 channel head-neck coil. The sequence parameter settings are shown in Table.1.
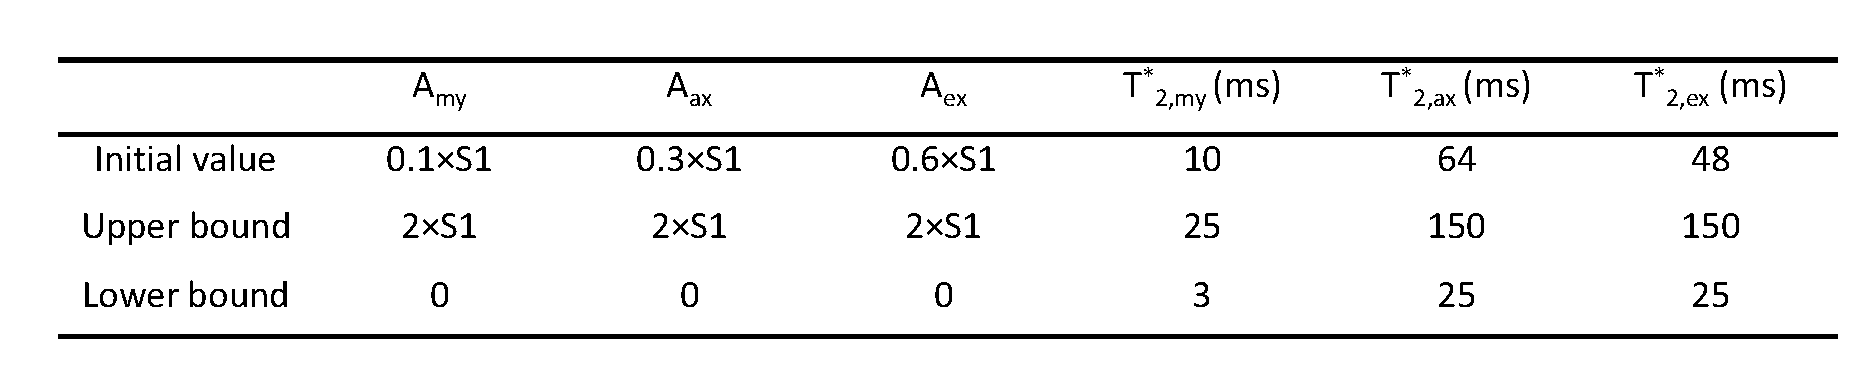
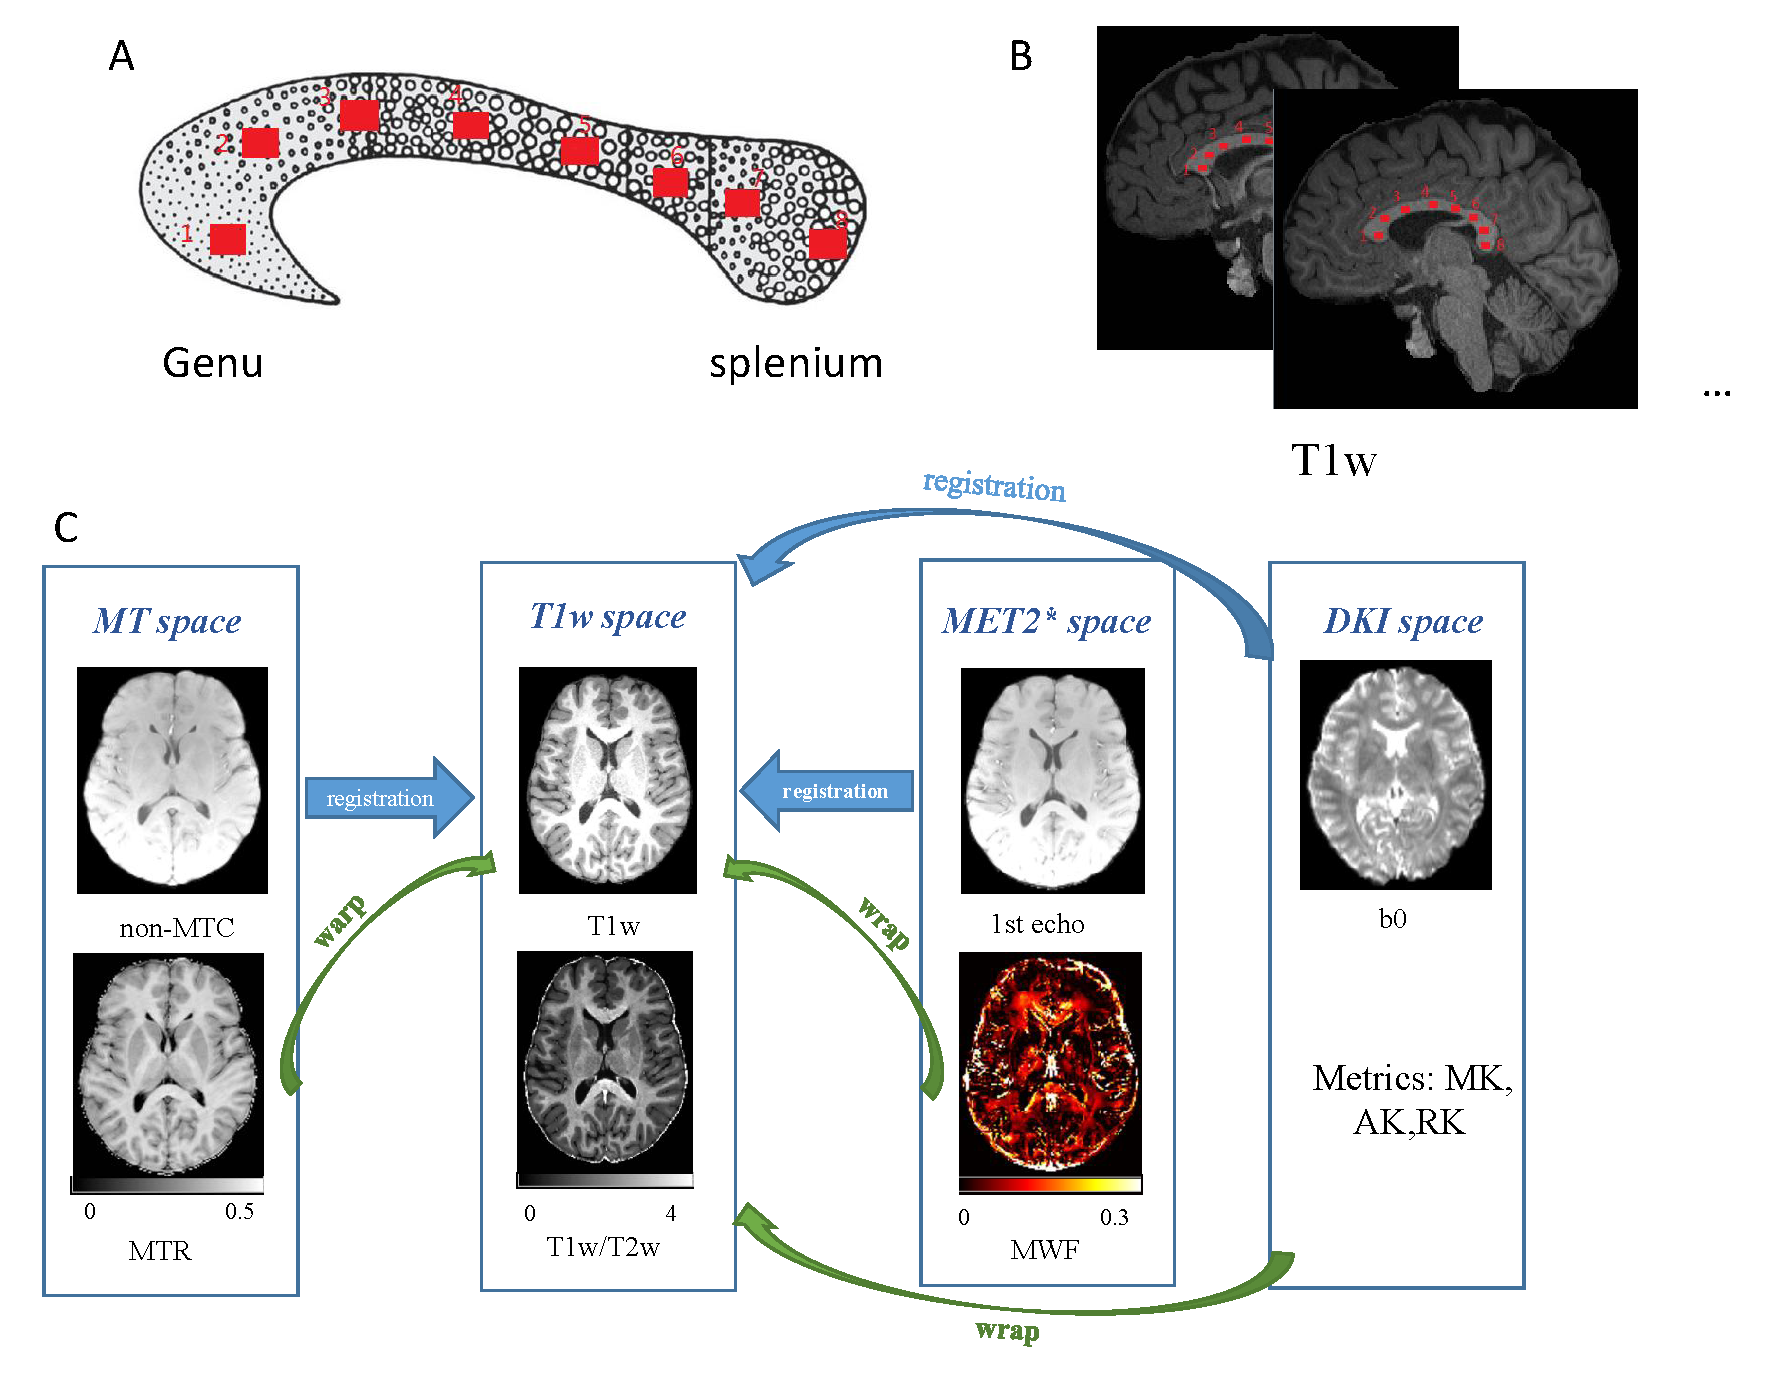
Image registration was conducted in SPM8. The T2w images were registered to T1w images. The T1w volumes were then divided on the aligned T2w volumes, creating T1w/T2w ratio volumes. The MTC images were registered to non-MTC images, and MTR was calculated with Eq.1. The MWF maps were calculated by multiexponential T2* fitting. The magnitude signals acquired by MGRE sequence were fitted to a three-component model by Eq.2, with the parameters of model shown in Table.2. The MWF was calculated with Eq.3. The DWI datasets were processed using software (Diffusional Kurtosis Estimator (DKE)) resulting in mean kurtosis (MK), axial kurtosis (AK) and radial kurtosis (RK) maps.
The ROI-acquisition processes are illustrated in Fig.1, for each subject, 8 regions of interest (ROI) were extracted from CC manually in T1w images, each ROI includes 250 voxels. Followed by a visual inspection for the registration between ROIs and metric maps, except ROI (1, 2) in DKI, there is no apparent registration error. Thus, ROI (1, 2) in DKI are picked again on the b0 images aligned to T1w images. For each metric, the mean value of voxels inside each ROI was calculated. To achieve normalization in inner-subject, the mean value of each ROI was divided by the mean value of ROI (1).
$$Eq.1: MTR=(S_{non-MTC}+S_{non-MTC})/S_{non-MTC}$$
$$Eq.2: S(t)=A_{my}\times e^{-t/T^{*}_{2,my}}+A_{ax}\times e^{-t/T^{*}_{2,ax}}+A_{ex}\times e^{-t/T^{*}_{2,ex}}$$
$$Eq.3: MWF=A_{my}/(A_{my}+A_{ax}+A_{ex})$$
Results
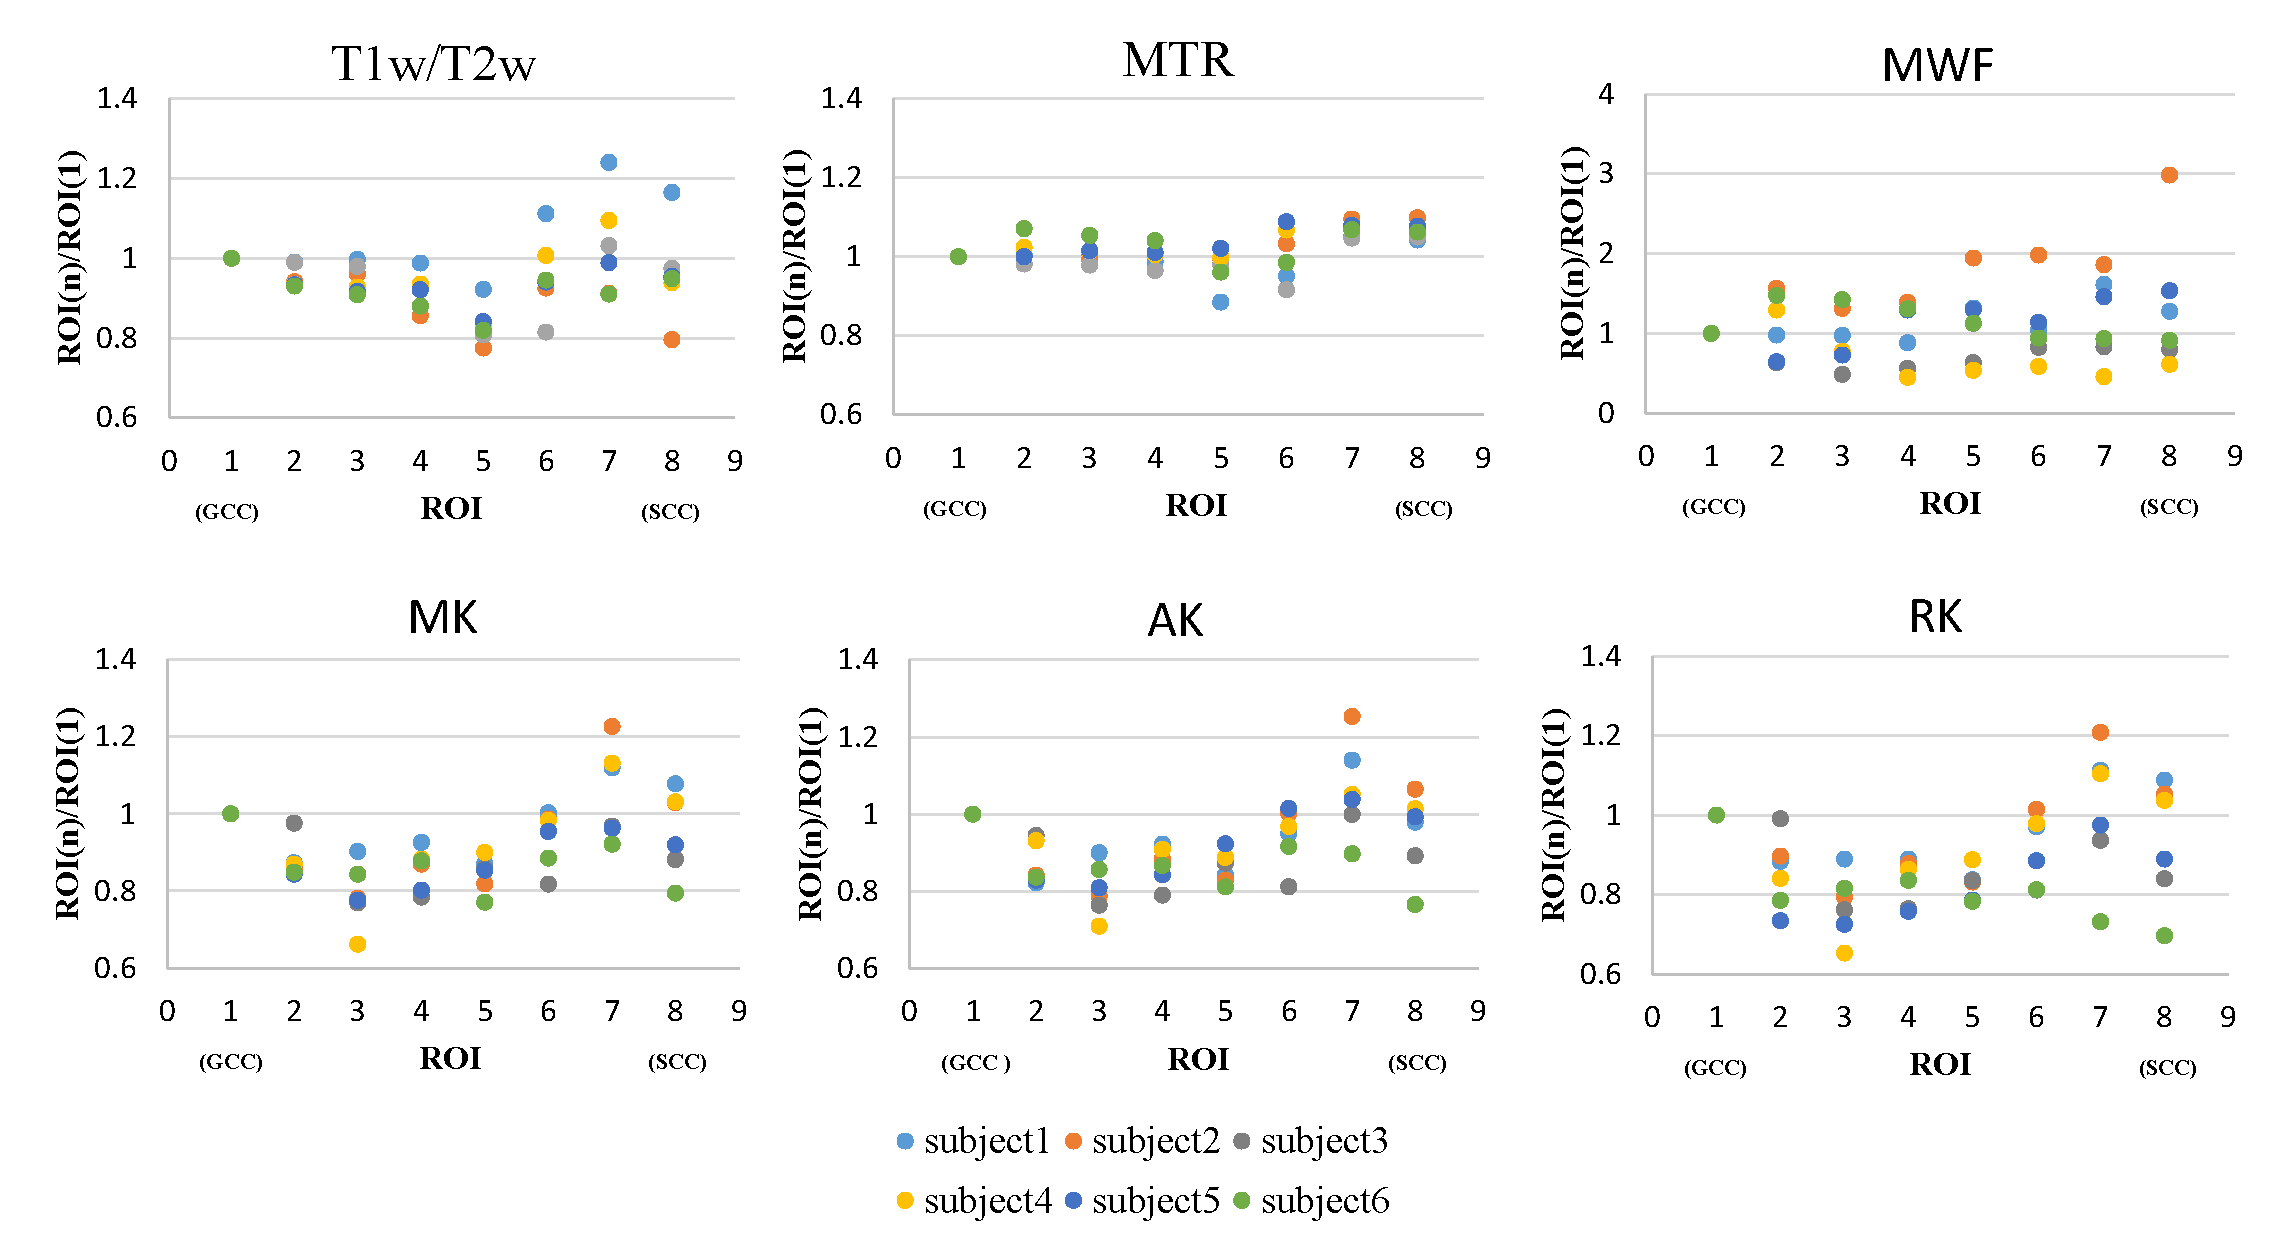
Fig.2 shows the changing trends of different metrics along the genu-splenium axis of CC. In T1w/T2w, the general trend is down-up-down, the lowest point is ROI (5), and the highest point is ROI (7). In MTR, the general trend is up-down-up-plateau, the lowest point is ROI (5), and the highest points are ROI (7) and ROI (8), which varies least compared to other metrics. In MK, AK and RK, the general trends are down-up-down, the lowest point is ROI (3), and the highest point is ROI (7). In MWF, there are obvious individual differences, which vary the most among all metrics.Discussion
The above MRI metrics have been implemented previously for detecting the integrity of white matter. However, they are indirect methods lacking specificity to myelin content, thus the inconsistent trends of ratio across CC between methods are understandable. T1w/T2w myelin mapping method doesn’t measure a quantitative physical property of tissue, but previous studies have reported its apparent sensitivity to myelin content in cortical areas6. It is worth noting that T1w/T2w appear to reflect more general measures of tissue microstructure. The fundamental concept behind MTR is the exchange of magnetization between mobile protons and immobile protons bound to macromolecules. Except for demyelination, inflammation can also result in lower MTR7. Diffusion kurtosis is a measure that quantifies the deviation of the water diffusion profile from a Gaussian distribution. AK, RK and MK are the kurtosis counterparts of axial diffusivity, radial diffusivity and FA respectively, the higher value, the higher tissue complexity. MWF is defined as ratio of short T2* component to the total signal, which is seen as the most specific metric to myelin8. But this approach also faces challenges, mainly the fact that multiexponential T2* analysis has an ill-posed nature and MWF is influenced by inter-compartmental water exchange.Conclusion
In summary, as myelin content changes, MTR varies least compared to other metrics, while MWF varies the most. The MRI metrics used in the study are affected by several factors, so cautions should be taken when using these metrics to interpret myelin changes in pathological cases.Acknowledgements
This work was supported by the National Key R&D Program of China (2017YFC0909200), NSFC (81871428, 91632109) and Shanghai Key Laboratory of Psychotic Disorders(13dz2260500).References
1. Arshad, M., Stanley, J. A. and Raz, N.Test–retest reliability and concurrent validity of in vivo myelin content indices: Myelin water fraction and calibrated T1w/T2w image ratio. Human Brain Mapping, 2017; 38: 1780-1790.
2. Carol L. Armstrong, Elfrides Traipe, et al. Age-Related, Regional, Hemispheric, and Medial-Lateral Differences in Myelin Integrity in vivo in the Normal Adult Brain. American Journal of Neuroradiology, 2004; 25(6): 977-984;
3. Nan-Jie Gong, Chun-Sing Wong,et al. Aging in deep gray matter and white matter revealed by diffusional kurtosis imaging. Neurobiology of Aging, 2014; 35(10):2203-2216.
4. Zhe Wu, Hongjian He, et al. High resolution myelin water imaging incorporating local tissue susceptibility analysis. Magnetic Resonance Imaging, 2017; Volume 42:107-113.
5. Aboitiz, Francisco & Montiel, Juan. One hundred million years of interhemispheric communication: The history of the corpus callosum. Brazilian journal of medical and biological research, 2003; 36. 409-20.
6. Matthew F. Glasser, David C. Van Essen. Mapping Human Cortical Areas In Vivo Based on Myelin Content as Revealed by T1- and T2-Weighted MRI, Journal of Neuroscience 10 August 2011; 31 (32) 11597-11616.
7. Gareau PJ, Rutt BK, Karlik SJ, Mitchell JR. Magnetization transfer and multicomponent T2 relaxation measurements with histopathologic correlation in an experimental model of MS. J Magn Reson Imaging 2000;11:586–595.
8. Cornelia Laule, Irene M. Vavasour, et al. Magnetic Resonance Imaging of Myelin, Neurotherapeutics, 2007; Vol. 4, 460-484.
Figures