4906
In vivo assessment of the anisotropy of R2* maps in white matter1Institute of Diagnostic and Interventional Radiology, Jena University Hospital – Friedrich Schiller University Jena, Jena, Germany, 22 University of British Columbia, Vancouver, BC, Canada, 3Department of Neurology, Medical University of Graz, Graz, Austria, 4Michael Stifel Center for Data-driven and Simulation Science Jena, Friedrich Schiller University Jena, Jena, Germany, 5Abbe School of Photonics, Friedrich Schiller University Jena, Jena, Germany, 6Center of Medical Optics and Photonics, Friedrich Schiller University Jena, Jena, Germany
Synopsis
The effective transverse relaxation rate (R2*) is increasingly used in quantitative MRI, and its dependence on the orientation of white matter fibers in the brain has received significant attention. In this contribution, we assess the effect of the flip angle of a multi-echo gradient-echo sequence on the orientation dependence of the derived R2* map and suggest a simplified explanation to the observed R2*(θ; FA) behavior.
Introduction
Recent studies explored the effective transverse relaxation rate (R2*) sensitivity against tissue microstructure. In particular, the presence of two distinct water compartments in white matter (WM) has been considered to be related to the multi-exponential decay of gradient-echo (GRE) signals1,2, whereas the anisotropic properties of the compartments have been associated with the orientation dependence of R2*, observed in certain WM regions3,4. This sensitivity to the multi-compartment structure of WM, however, poses some challenges in mapping R2* as a quantitative parameter, since its extracted numerical values can be affected by the acquisition parameters. In this contribution, we examine the influence of the flip angle on the resulting R2* maps and investigate the effect on the orientation dependence of R2* in WM.Material and Methods
Six subjects (three female; age 22—29, median age 25) were examined using a 3T MRI system with 64-channel head Tx/Rx coil.
Data acquisition
R2* decays were investigated by using a 3D multi-echo GRE (ME-GRE) imaging sequence, which was repeated four times with different flip angles (FA = 6°, 17°, 35° and 60°) but otherwise identical acquisition parameters (TR = 37 ms, TE1-5 = 8.12/13.19/19.26/24.33/29.4 ms, monopolar readout, bandwidth = 280 Hz/px, voxel size = 1 mm × 1 mm × 1 mm). The orientation of WM fiber bundles was assessed from two diffusion-weighted acquisitions (voxel size = 1.5 mm×1.5 mm× 1.5 mm; TR = 3300 ms, TE = 84 ms) with reversed PE polarities and multi-shell diffusion scheme (16, 32, 64, and 96 directions with b-values of 0, 835, 1665 and 2500 s/mm², respectively).
Data processing
Diffusion acquisitions were combined, distortion-corrected via FSL5,6 and linearly registered to the GRE data (@FA=17°). The predominant fiber orientation was determined in each voxel using constrained spherical deconvolution7. Fiber orientation was computed as the angle θ between the first ODF peak and the B0 direction. R2* maps were calculated from each of the four ME-GRE acquisition via monoexponential fit with the ARLO algorithm8. Further analysis was performed for voxels whose second peak of the ODF was smaller than 50% compared to the first peak. Voxels were grouped by the angle θ in 5°-wide bins for each flip angle independently. Bin-averaged R2* values were fitted to $$$R_2^* = a_0 + a_1\cos 2\theta + a_2\cos 4\theta $$$ (eq. 1)9.
Results
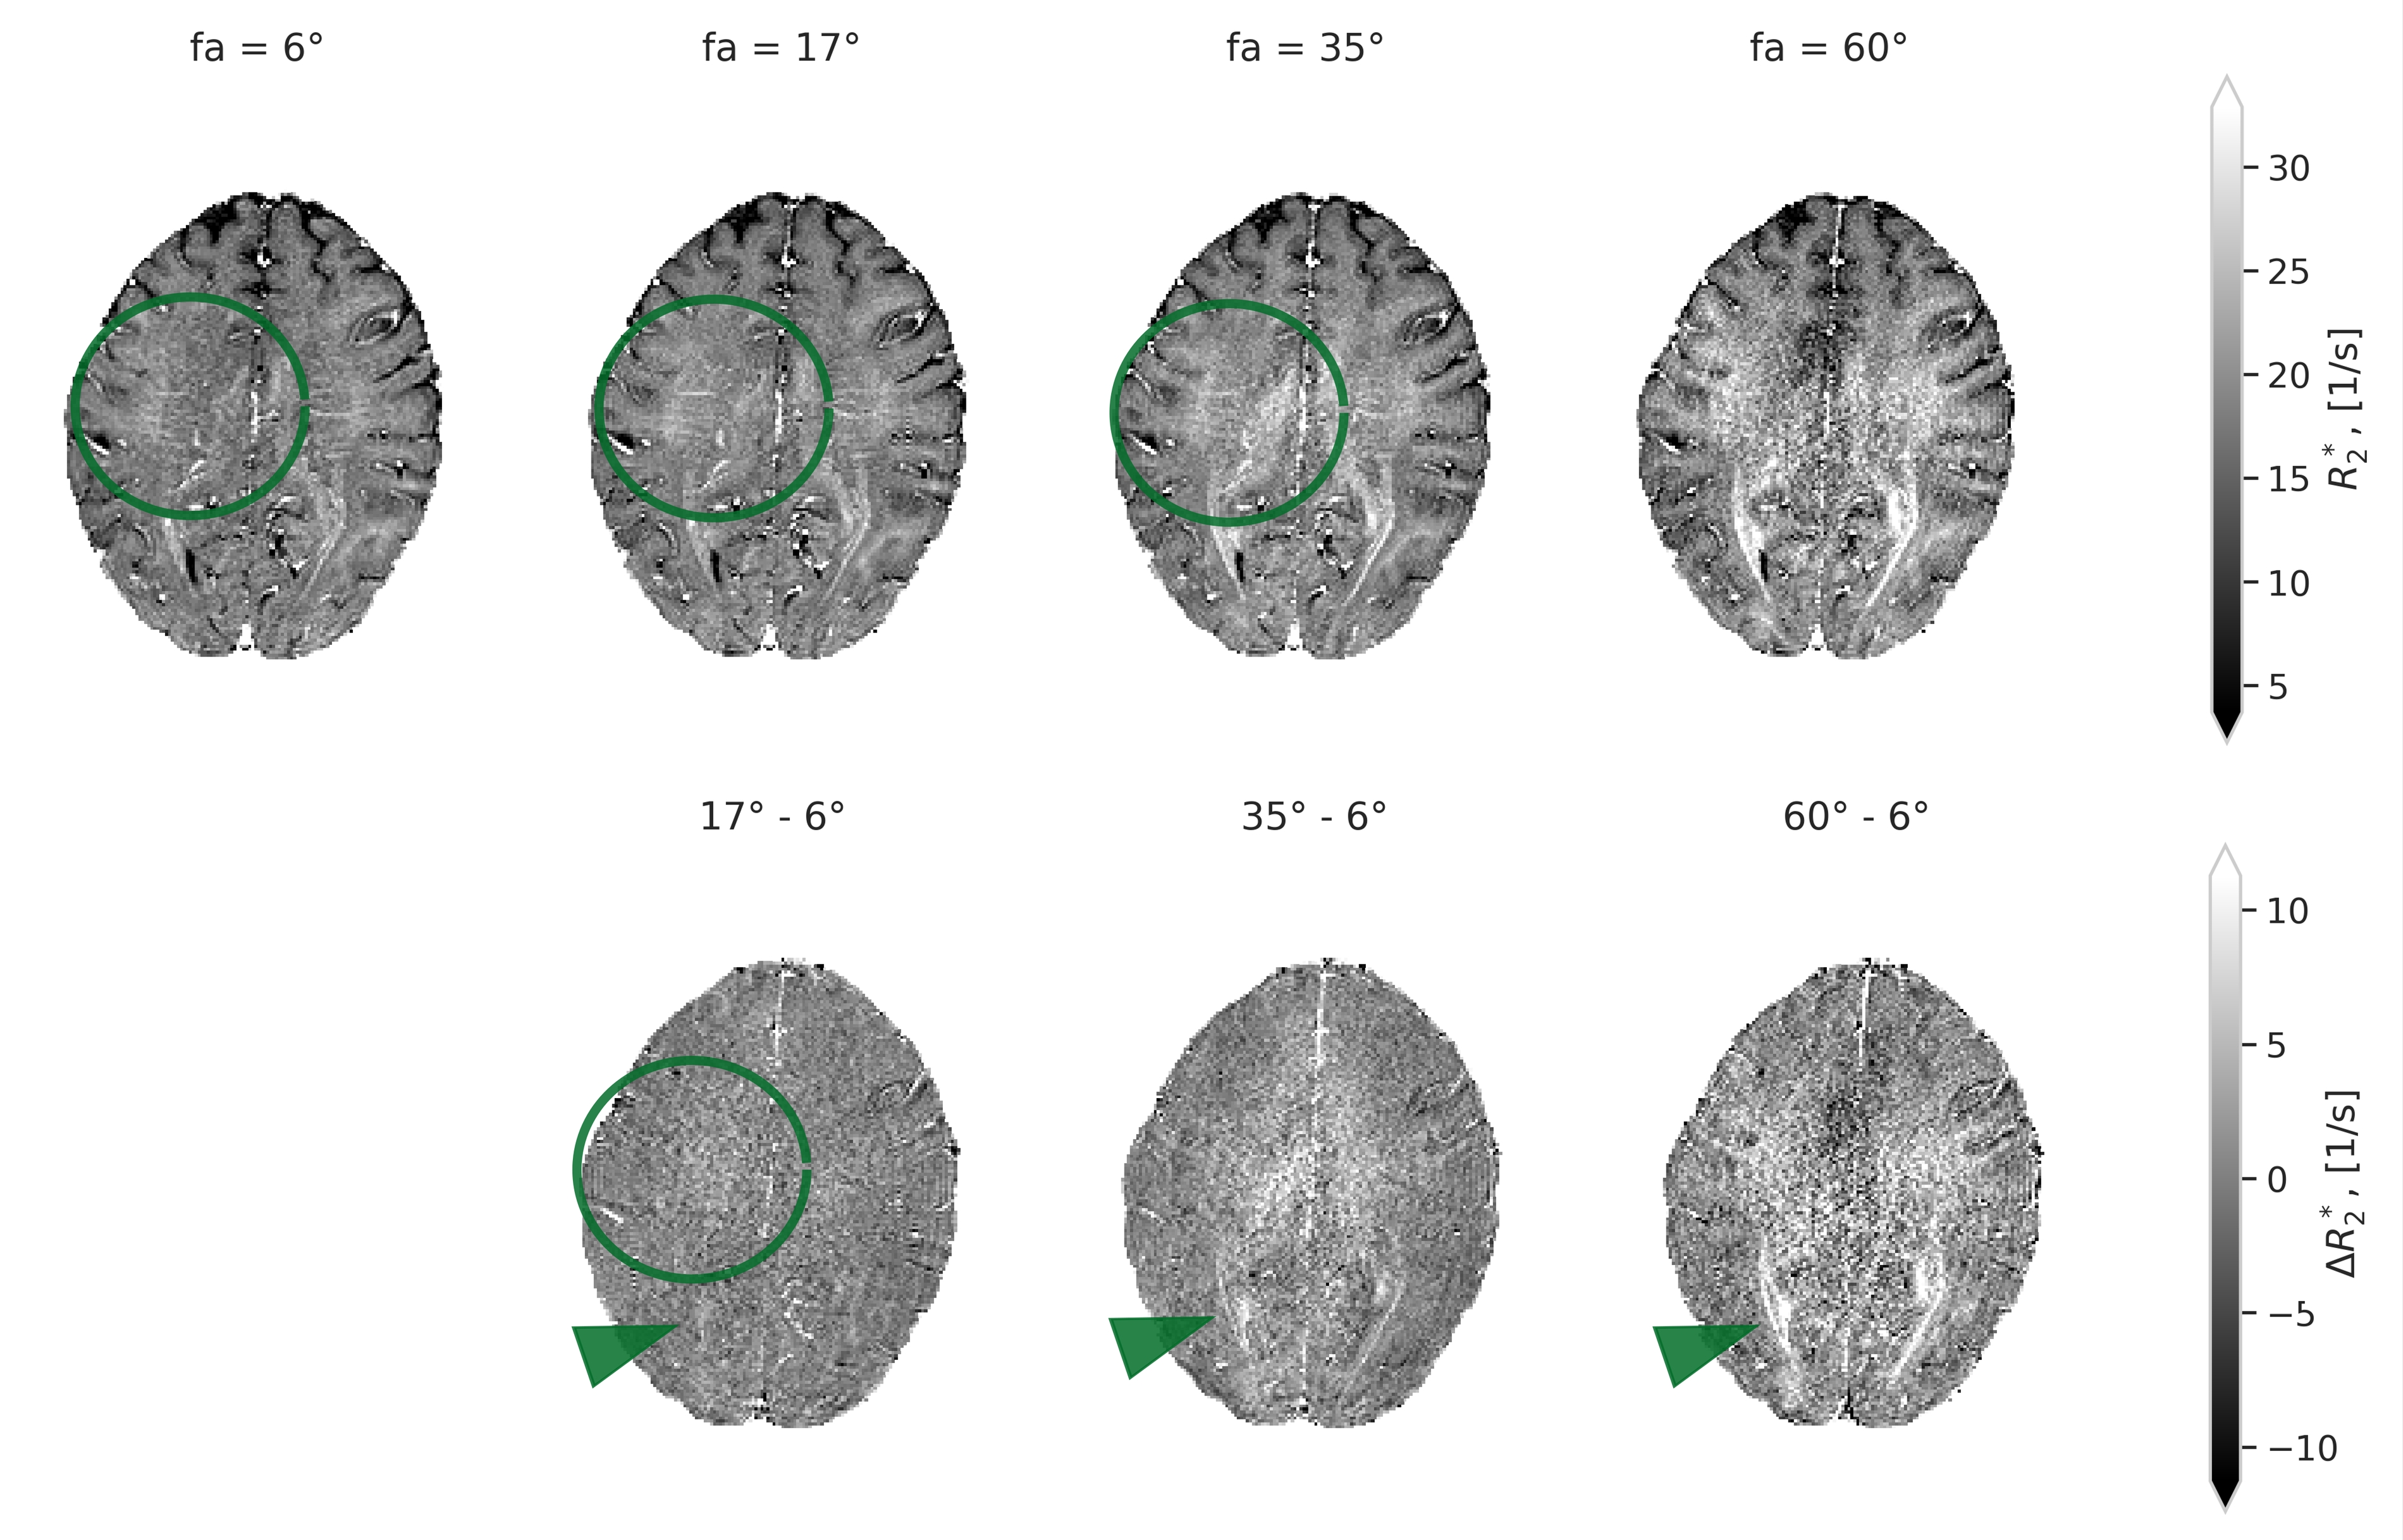
The four R2* maps derived from the acquisitions with different flip angle demonstrate different contrast in white matter, particularly in areas with one single predominant orientation of the fibers (see Fig. 1).
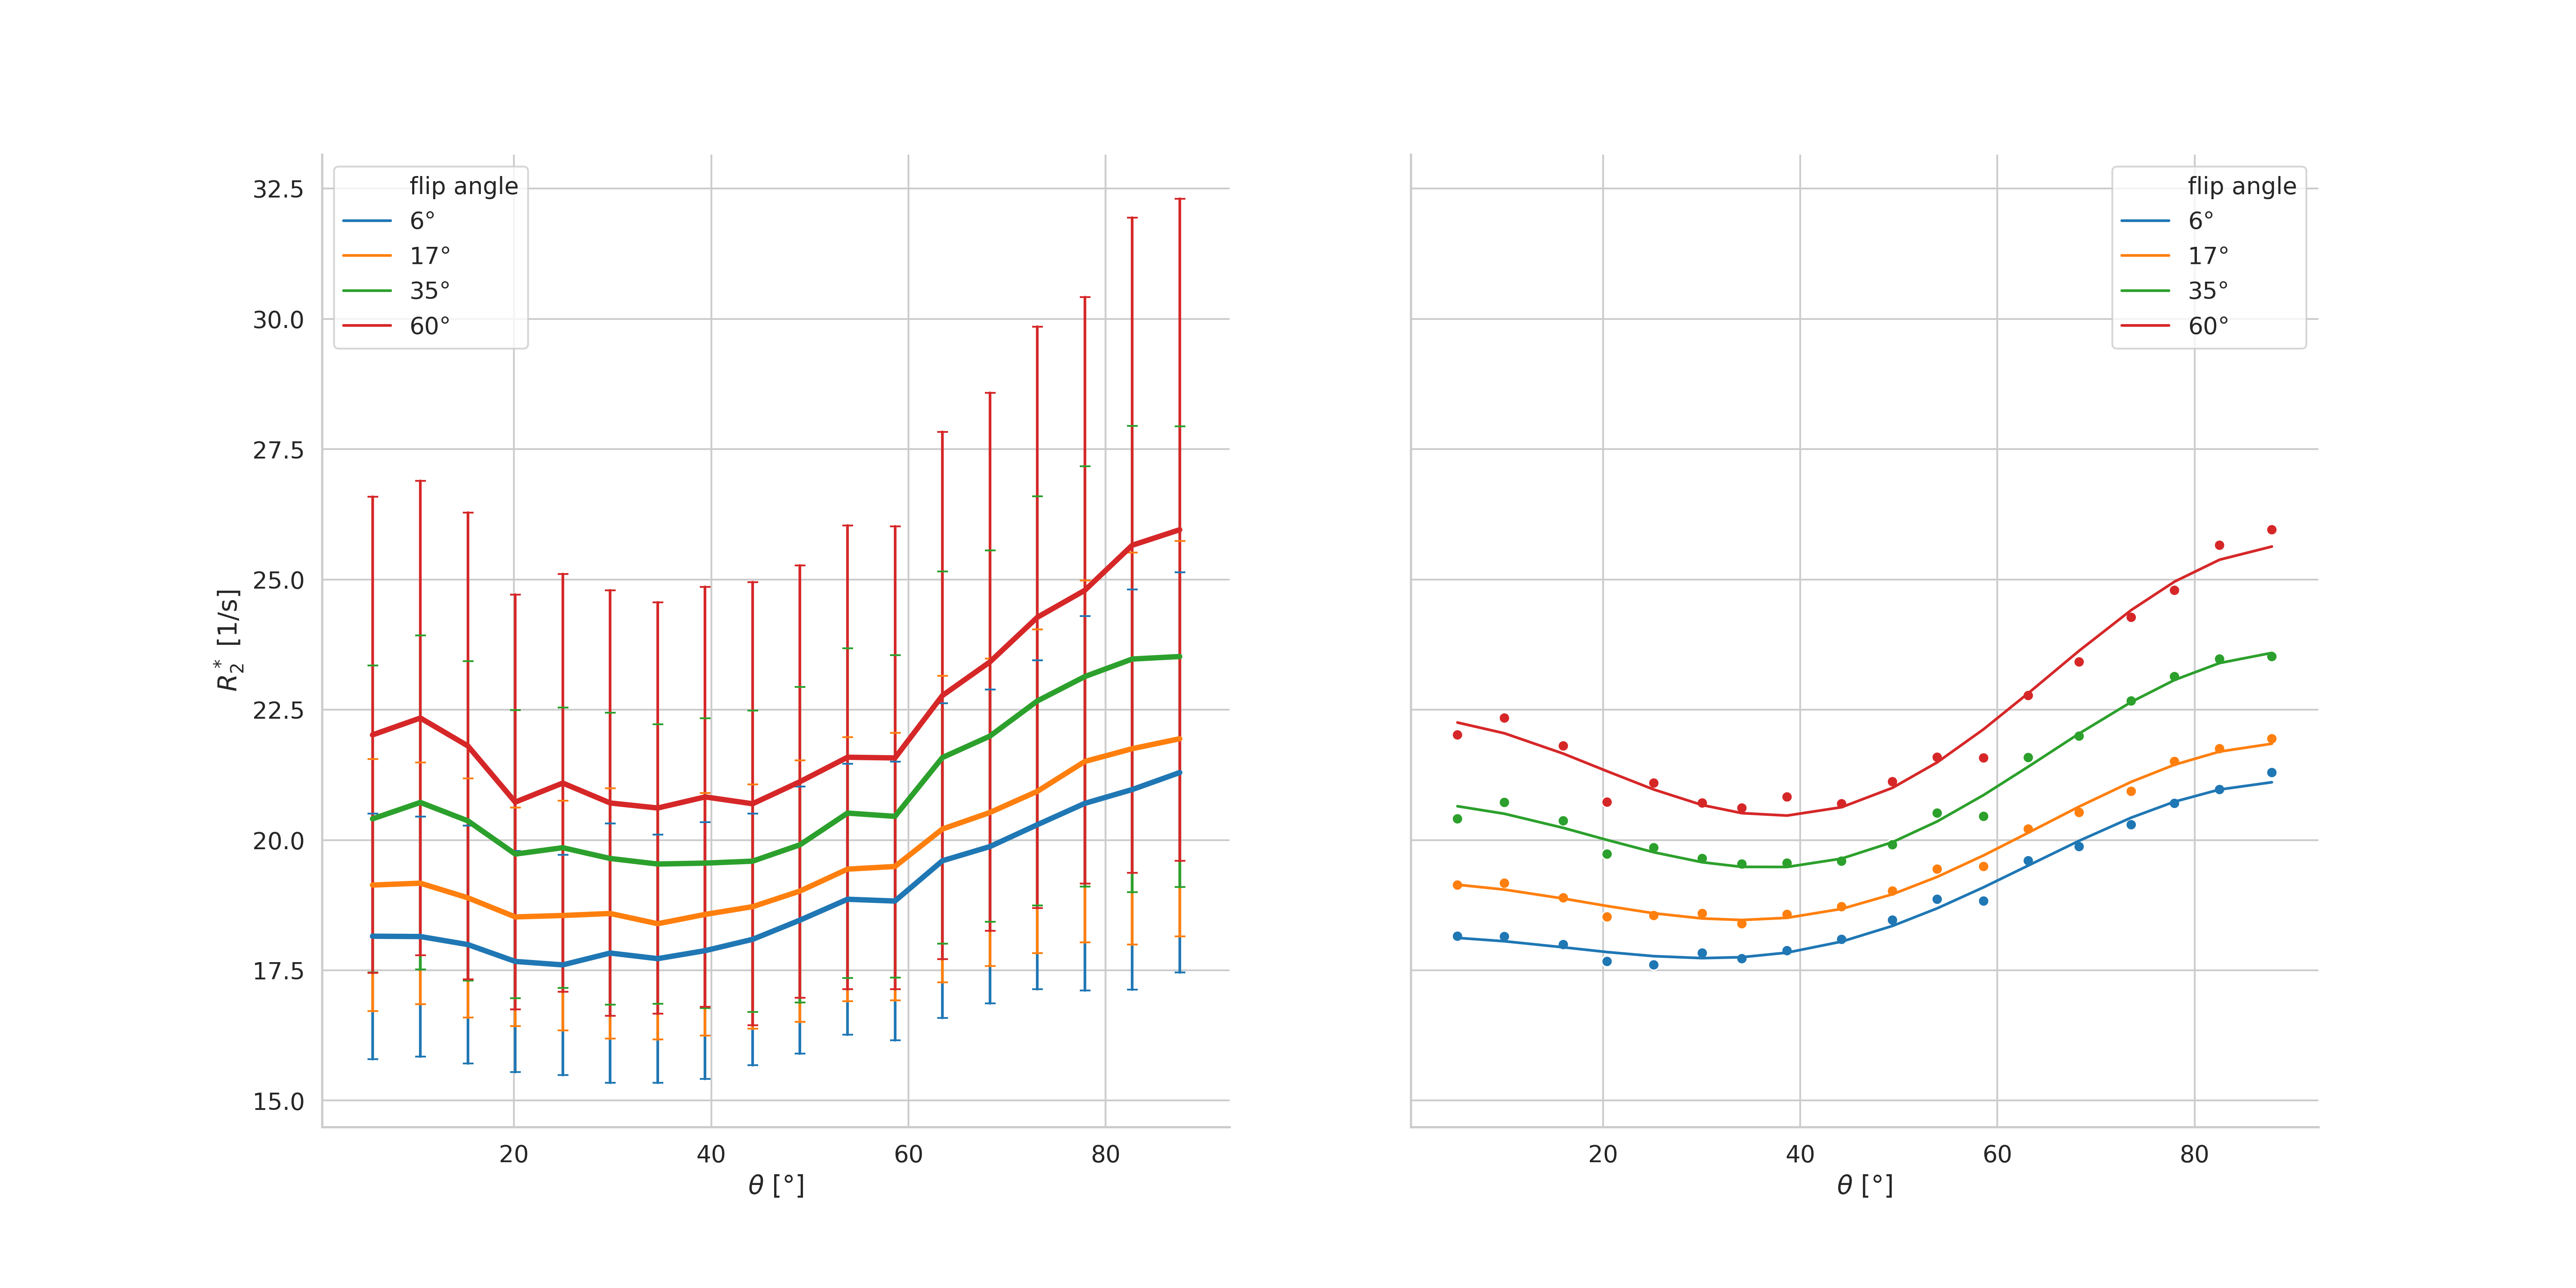
Figure 2 shows the orientation dependence of the binned R2* data for the four flip angles in one volunteer (left). Higher apparent R2* values were extracted from the measurements with higher flip angles. The orientation dependence of the apparent R2* appears stronger with higher flip angle.
The fit of the model to the data is also shown in Fig. 2 (right). In agreement with previously published results9,10, the orientation dependence of R2* follows closely the functional dependence given in eq. 1.
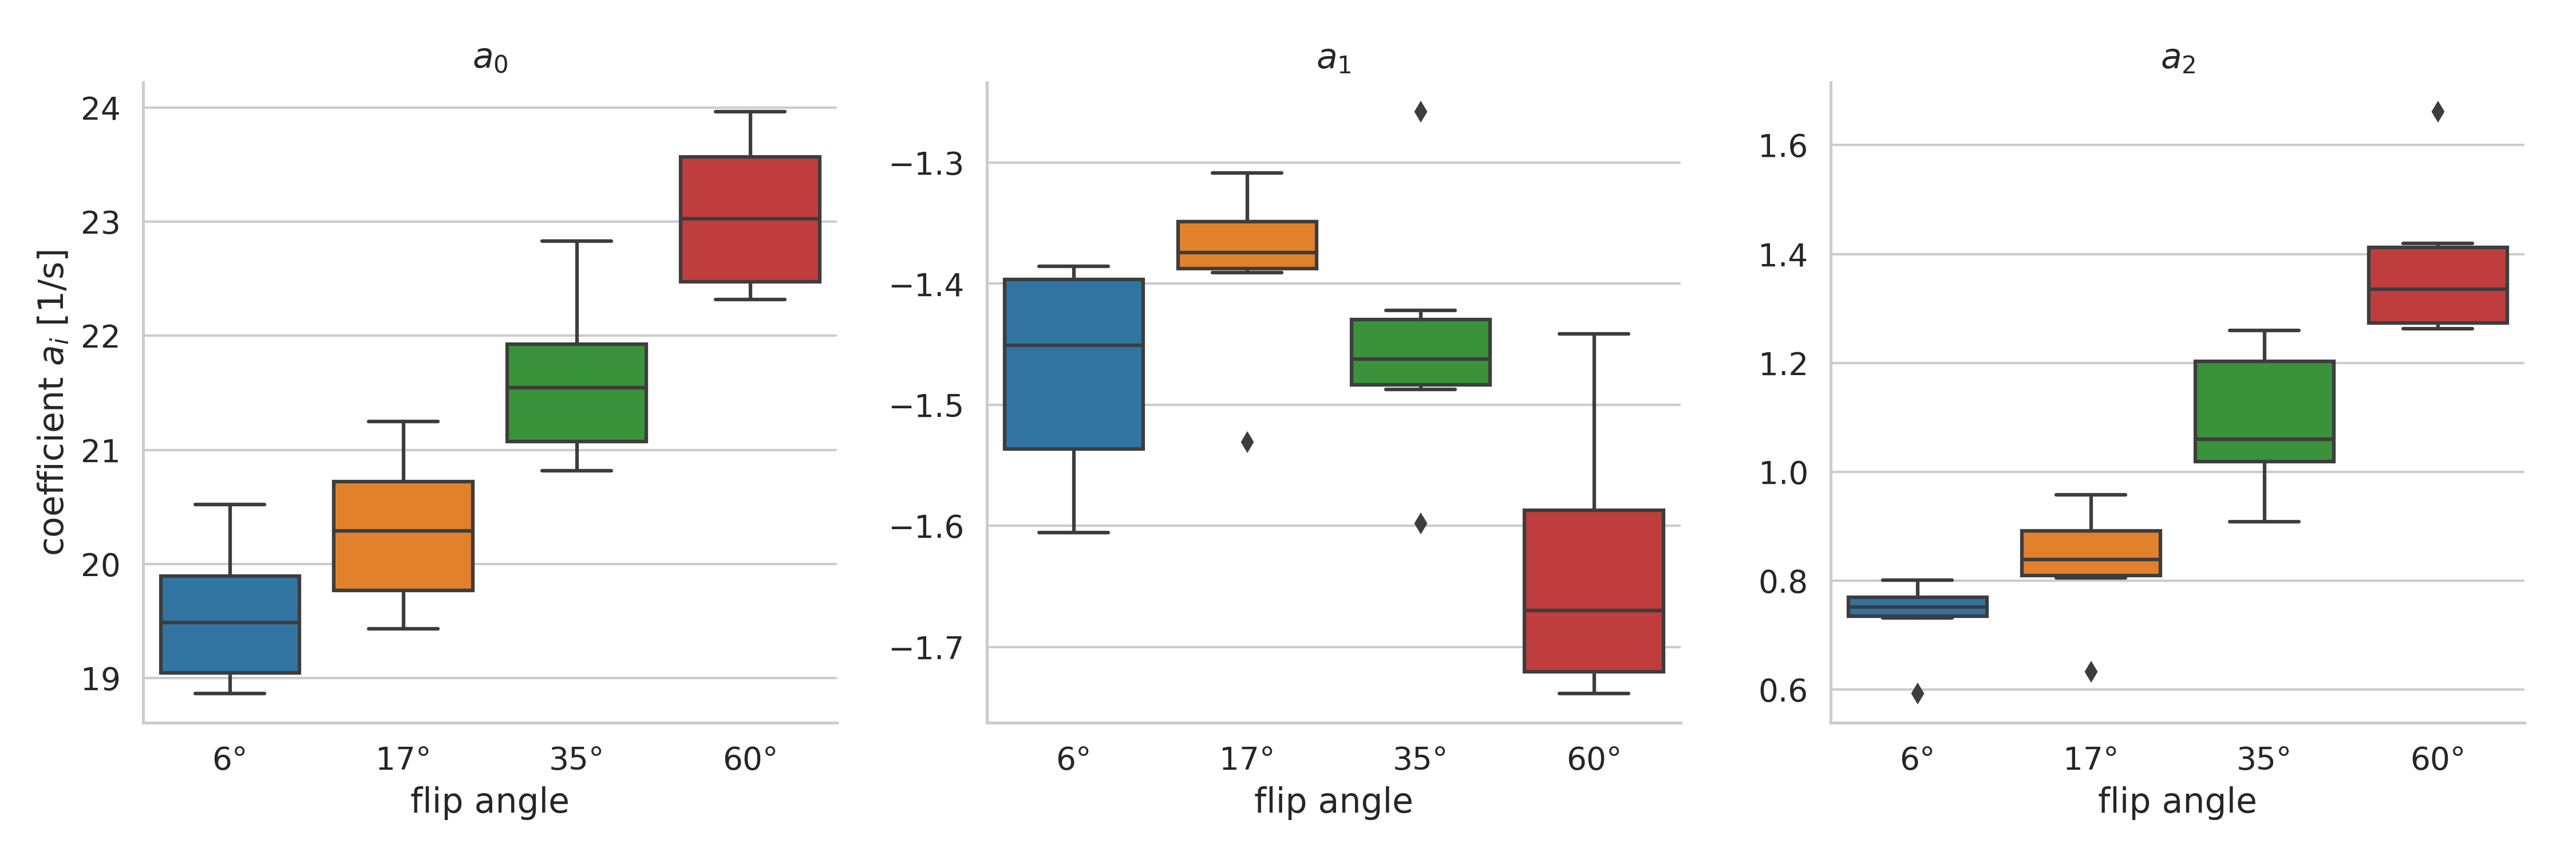
Box-plots of the fitted coefficients to eq. 1 are displayed in Fig. 3. The values for the coefficients agree reasonably well with previously published results10 and are discussed below.
Discussion
The results in Fig. 3 can be interpreted when considering WM consisting of two compartments with the following properties: predominantly axonal/extracellular water with longer T1 and T2* values and mostly isotropic magnetic susceptibility (compartment 1); small fraction of myelin water with shorter T1 and T2* and anisotropic susceptibility (compartment 2).
- The increase of a0 with flip angle is known and explained by the increasing saturation of compartment 1.
- Following He and Yablonski11, the $$$\cos 2 \theta$$$ term is associated with a contribution from water in parallel oriented structures, which can be ascribed to the axonal water compartment given its prevalence. Interestingly, a1 exhibits non-monotonic dependence on the flip angle, reaching its smallest absolute value around the Ernst angle of compartment 1.
- As proposed by Lee et al.9, the $$$\cos 4\theta$$$ contribution can be associated with a compartment with anisotropic susceptibility, which is believed to be myelin water. This explains increasing a2, as the predominant axonal compartment is increasingly saturated with higher flip angles.
Conclusion
Care must be taken when comparing models of orientation dependency of R2* derived from acquisitions with different flip angles.
Sensitivity of R2* to tissue architecture or its susceptibility anisotropy can be to some extend affected by adjusting the flip angle of the acquisition.
Acknowledgements
The study was supported by the German Research Foundation (DFG, DE2516/1-1, RE1123/21-1) and the Austrian FWF (I 3001-B27).References
1. Van Gelderen P, De Zwart JA, Lee J, et al. Nonexponential T2* decay in white matter. Magnetic resonance in medicine. 2012 Jan;67(1):110-7.
2. Sati P, van Gelderen P, Silva AC, et al. Micro-compartment specific T2⁎ relaxation in the brain. Neuroimage. 2013 Aug 15;77:268-78.
3. Bender B, Klose U. The in vivo influence of white matter fiber
orientation towards B0 on T2* in the human brain. NMR in biomedicine.
2010 Nov;23(9):1071-6.
4. Denk C, Torres EH, MacKay A, Rauscher A. The influence of white matter
fibre orientation on MR signal phase and decay. NMR in Biomedicine. 2011
Apr;24(3):246-52.
5. Andersson JL, Skare S, Ashburner J. How to correct susceptibility distortions in spin-echo echo-planar images: application to diffusion tensor imaging. Neuroimage. 2003 Oct 1;20(2):870-88.
6. Andersson JL, Sotiropoulos SN. An integrated approach to correction for off-resonance effects and subject movement in diffusion MR imaging. Neuroimage. 2016 Jan 15;125:1063-78.
7. Tournier JD, Calamante F, Connelly A. Robust determination of the fibre orientation distribution in diffusion MRI: non-negativity constrained super-resolved spherical deconvolution. Neuroimage. 2007 May 1;35(4):1459-72.
8. Pei M, Nguyen TD, Thimmappa ND, et al. Algorithm for fast monoexponential fitting based on
Auto‐Regression on Linear Operations (ARLO) of data. Magnetic resonance
in medicine. 2015 Feb;73(2):843-50.
9. Lee J, van Gelderen P, Kuo LW, et al. T2*-based fiber orientation mapping. Neuroimage. 2011 Jul 1;57(1):225-34.
10. Lee J, Shin HG, Jung W, et al. An R2* model of white matter for fiber orientation and myelin
concentration. Neuroimage. 2017 Nov 15;162:269-75.
Figures