4901
Robust myelin water imaging from multi-echo T2 data using second-order Tikhonov regularization with control points1Department of Radiology, Centre Hospitalier Universitaire Vaudois (CHUV), Lausanne, Switzerland, 2FIDMAG Germanes Hospitalàries Research Foundation, Barcelona, Spain, 3LTS5, École Polytechnique Fédérale de Lausanne (EPFL), Lausanne, Switzerland, 4Advanced Clinical Imaging Technology, Siemens Healthcare AG, Lausanne, Switzerland, 5Centre d'Imagerie BioMédicale (CIBM)-AIT, École polytechnique fédérale de Lausanne (EPFL), Lausanne, Switzerland, 6Department of Pathology and Immunology, Geneva University Hospital and University of Geneva, Geneva, Switzerland, 7Division of Neurology and Neuroscience Research Center, Department of Clinical Neurosciences, Centre Hospitalier Universitaire Vaudois (CHUV), Lausanne, Switzerland, 8Computer Science Department, University of Verona, Verona, Italy
Synopsis
Myelin water imaging is an MRI technique used to quantify myelination in the brain. The state-of-the-art reconstruction method is based on non-negative least squares optimization with zero-order Tikhonov regularization. In this study, a second-order Tikhonov regularization approach with control points was examined. This penalty term is more efficient for promoting smooth solutions while minimizing the contamination between myelin and non-myelin components. The performance of the proposed algorithm was investigated on in-vivo and ex-vivo multi-echo T2 data. It exhibited a higher correlation with histology than the state-of-the-art method. Its stability was studied using scan-rescan data.
Introduction
Multicomponent T2 relaxation analysis in brain tissue allows obtaining information on transverse relaxation times of different tissue compartments. It is considered as the gold standard to compute the myelin water fraction (MWF)1, a potential biomarker for various brain disorders. Several studies have demonstrated the existence of cellular-compartment-specific T2 values2. For instance, a three-pool model3,4 was proposed to separate the water signal into three components: a short T2 component attributed to myelin water; an intermediate T2 component due to the intra- and extracellular water; and a long T2 component arising from the cerebrospinal fluid. A more general statistical model that introduces a non-parametric T2 distribution function was proposed in 5,6. This state-of-the-art method estimates a discrete version of the distribution by using non-negative least squares (NNLS). As the algorithm tends to produce a sparse distribution consisting of a few spikes, a common approach is to include a zero-order Tikhonov (ZOT) penalty term in the fitting to promote smoothness5,6. In this study, we examined a second-order Tikhonov (SOT) regularization approach as an alternative to ZOT. This penalty term, based on the second-difference Laplacian operator, is more efficient for promoting smooth solutions.
The reliability of the reconstruction typically depends on the regularization parameter: if it is smaller than the optimal one, the solution tends to be unstable due to overfitting, and if it is higher, the resulting T2 distribution is blurred due to over-smoothing, which renders the identification of the myelin and non-myelin components difficult. In this study, an additional penalty term is introduced to minimize the contamination between myelin and non-myelin compartments. The empirical performance of the proposed algorithm was investigated by using in-vivo and ex-vivo multi-echo T2 (MET2) data.
Material and Methods
We propose minimizing the functional:
$$$\hat{\textbf{x}}=argmin_{\textbf{x}\geq 0}\|\textbf{s}- \textbf{Hx}\|_{2}^{2}+\lambda_{1}\|\textbf{Lx}\|_{2}^{2}+\lambda_{2}\| \textbf{I}_{s}\textbf{x}\|_{2}^{2}$$$,
where $$$\textbf{s}$$$ is the vector of measurements, $$$\textbf{H}$$$ is the dictionary matrix (i.e., linear operator) of synthetic signals with different T2 values, $$$\textbf{L}$$$ is the Laplacian of second derivatives, $$$\textbf{x}$$$ is the T2 distribution vector to be estimated, and $$$\textbf{I}_{s}$$$ is a sparse diagonal matrix to include specific control points. As commonly done, MWF is calculated as the discrete integral for T2 times from 10-40ms normalized by the total area6. In our study, $$$\textbf{I}_{s}(n_{m},n_{m})=1$$$ at the index defining the frontier between myelin and non-myelin components ($$$n_{m}$$$→T2=40ms) and zero otherwise, and $$$\lambda_{2}=100$$$. $$$\textbf{H}$$$ was built using extended-phase-graph (EPG) simulations for stimulated echo correction7 and using 40 T2 logarithmically spaced points ranging from 10-2000ms. The problem was solved using NNLS. Moreover, the reference method5,6 with EPG simulations8 was also implemented.
Ex-vivo data: MET2 data previously acquired from a dog spinal cord and the myelin volume fraction obtained from histology were employed9,10 (available at the White Matter Microscopy Database11). Additionally, MET2 data from brain mice were acquired with the following parameters: voxel-size=0.16x0.22x0.6mm3; ΔTE/N-echoes=10.0ms/24; N-slices=24.
Human brain data: After written informed consent was obtained, human brain MET2 data were acquired from a healthy control at 3T (MAGNETOM Skyra, Siemens Healthcare, Erlangen, Germany) using a standard 64-channel head/neck coil. The data were collected using a prototype 3D multi-echo gradient and spin echo (GRASE) sequence accelerated with CAIPIRINHA12. To test the stability of the reconstructions, two different acquisitions were carried out in two scanning sessions using the following parameters: voxel-size=1.6x1.6x1.6mm3; ΔTE/N-echoes=10.78ms/32; N-slices=84.
Results
The validation study using MET2 and histological data from a dog spinal cord is depicted in Figure 1. Panel A shows the performance of the state-of-the-art technique5,6,8, and panels B and C show the proposed method. In panel B, $$$\lambda_{1}$$$ was determined using the same approach employed by the state-of-the-art technique ($$$\lambda_{1}≈0.2$$$). Panel C shows an alternative reconstruction using a much higher value $$$\lambda_{1}=20$$$. Notably, in both cases, the new method exhibited higher correlations than the state-of-the-art technique. The highest correlation was obtained with $$$\lambda_{1}=20$$$. The scan-rescan analysis using human data is shown in Figure 2. It was conducted with $$$\lambda_{1}=20$$$. Both images have very similar anatomical details with a correlation coefficient equal to 1. The slope and intercept of the linear regression line are 1 and 0, respectively. Finally, the method was applied to MET2 data acquired from a mouse brain. Figure 3 shows an example of relevant microstructure parameters derived from the T2 distributions.Discussion and Conclusion
A new reconstruction method to estimate the T2 distribution from MET2 data is proposed. It was validated using histological data (Figure 1). An initial test of reproducibility based on scan-rescan data showed stable results (Figure 2). Moreover, it was applied to ex-vivo data from a mouse brain (Figure 3). Future studies will be conducted to identify the optimal regularization parameters. A test-retest analysis using a large number of subjects will be performed.Acknowledgements
This work was supported by the Instituto de Salud Carlos III, Spain (research project grant: PI15/00277 to Erick J Canales-Rodríguez), the Rita Levi Montalcini Programme of the Italian Ministry of Education, University and Research (MIUR), as well as the Faculté de Biologie et de Médecine of the Lausanne University Hospital Center (CHUV). Marco Pizzolato is supported by the Swiss National Science Foundation (grant number: CRSII5_170873, Sinergia project).References
1 Alonso-Ortiz, E., Levesque, I.R., Pike, G.B., 2015. MRI-based myelin water imaging: A technical review. Magn. Reson. Med. 73, 70–81.
2 MacKay, A., Laule, C., Vavasour, I., et al., 2006. Insights into brain microstructure from the T2 distribution. Magn. Reson. Imaging. 24(4):515-25.
3 Andrews, T., Lancaster, J.L., Dodd, S.J., Contreras-Sesvold, C., Fox, P.T., 2005. Testing the three-pool white matter model adapted for use with T2 relaxometry. Magn. Reson. Med. 54, 449–454.
4 Lancaster, J.L., Andrews, T., Hardies, L.J., Dodd, S., Fox, P.T., 2003. Three-pool model of white matter. J. Magn. Reson. Imaging 17, 1–10.
5 Mackay A, Whittall K, Adler J, Li D, Paty D, Graeb D., 1994. In vivo visualization of myelin water in brain by magnetic resonance. Magn Reson Med. 31(6):673-677.
6 Whittall, K.P., MacKay, A.L., Graeb, D.A., Nugent, R.A., Li, D.K.B., Paty, D.W., 1997. In vivo measurement of T2 distributions and water contents in normal human brain. Magn. Reson. Med. 37, 34–43.
7 Hennig J, Weigel M, Scheffler K., 2004. Calculation of flip angles for echo trains with predefined amplitudes with the extended phase graph (EPG)‐algorithm: Principles and applications to hyperecho and TRAPS sequences. Magn Reson Med. 51(1):68-80.
8 Prasloski T, Mädler B, Xiang QS, MacKay A, Jones C., 2012. Applications of stimulated echo correction to multicomponent T2 analysis. Magn Reson Med. 67(6):1803-14.
9 Stikov N, Campbell JS, Stroh T, et al., 2015. In vivo histology of the myelin g-ratio with magnetic resonance imaging. NeuroImage, 118:397-405.
10 Vuong, M-T, Duval, T, Cohen-Adad, J, Stikov, N, 2017. On the Precision of Myelin Imaging: Characterizing Ex Vivo Dog Spinal Cord with MRI and Histology, in Proceedings of the 25th Annual Meeting of ISMRM. p. 3760.
11 Cohen-Adad J, Does M, Duval T, Dyrby TB, Fieremans E, Foias A, Zaimi A., 2018. White Matter Microscopy Database. https://doi.org/10.17605/OSF.IO/YP4QG.
12 Piredda GF, Hilbert T, Canales-Rodríguez EJ, et al. Accelerating Multi-Echo GRASE with CAIPIRINHA for Fast and High-Resolution Myelin Water Imaging. Submitted in parallel to ISMRM 2019.
Figures
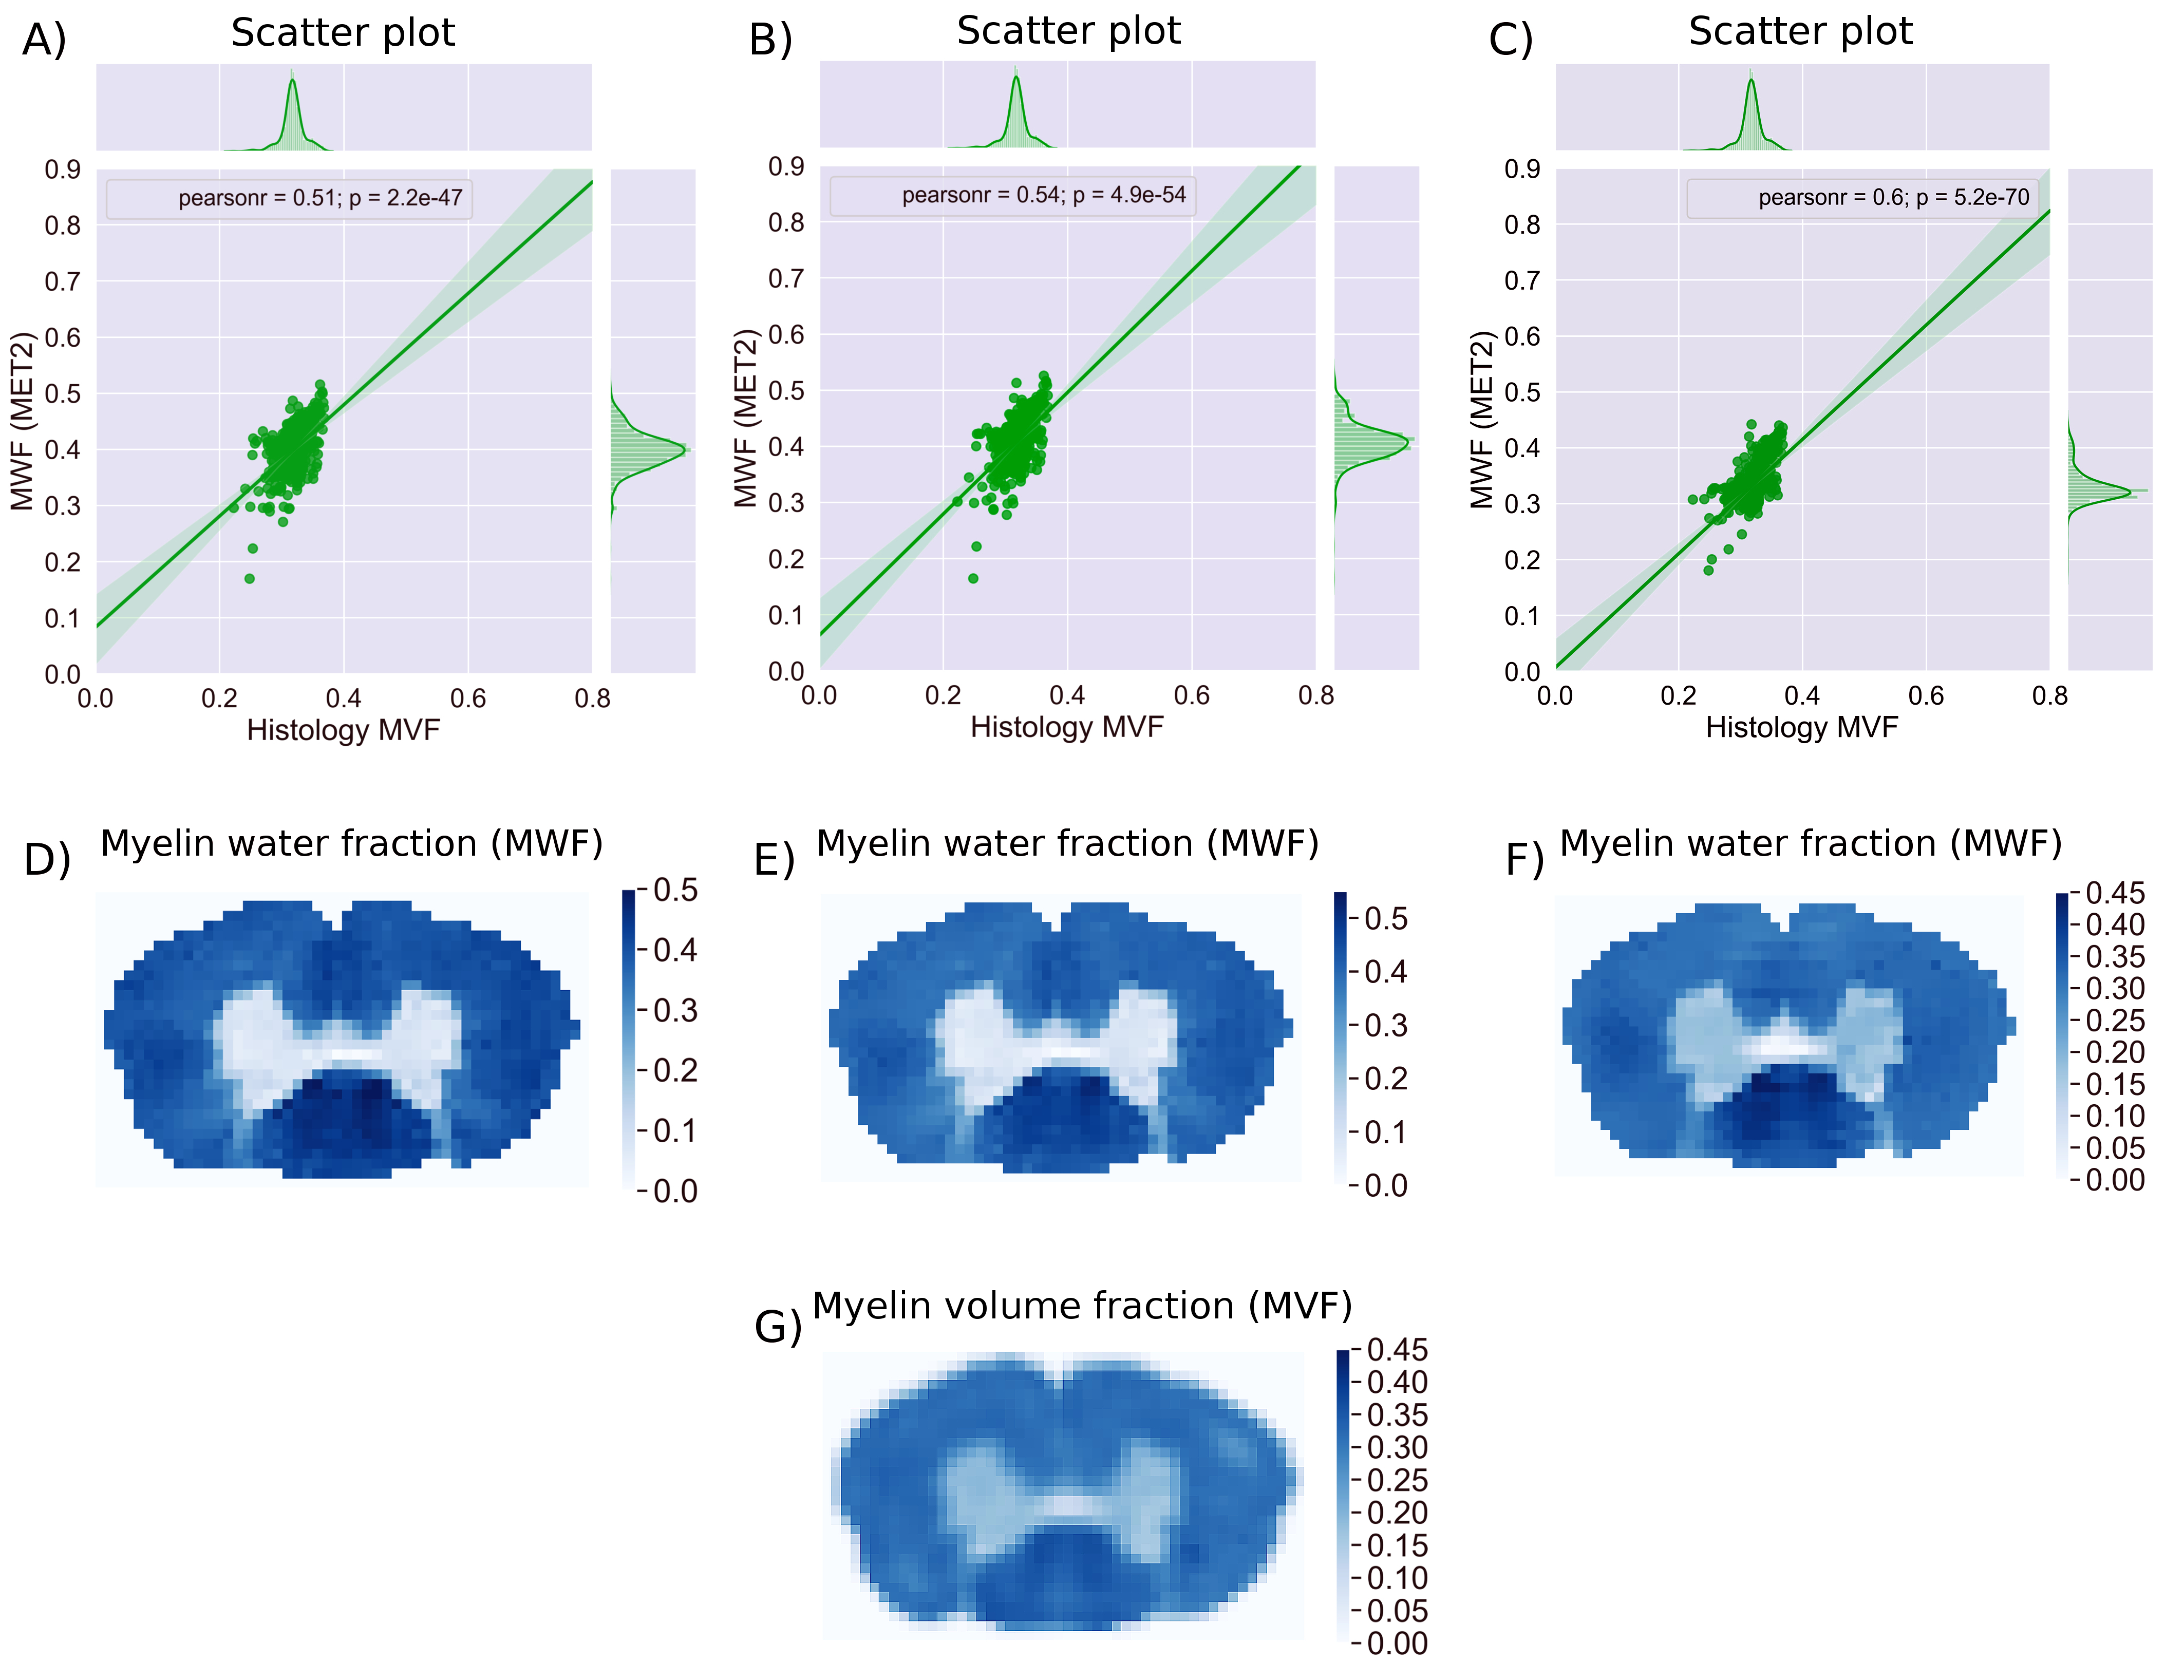
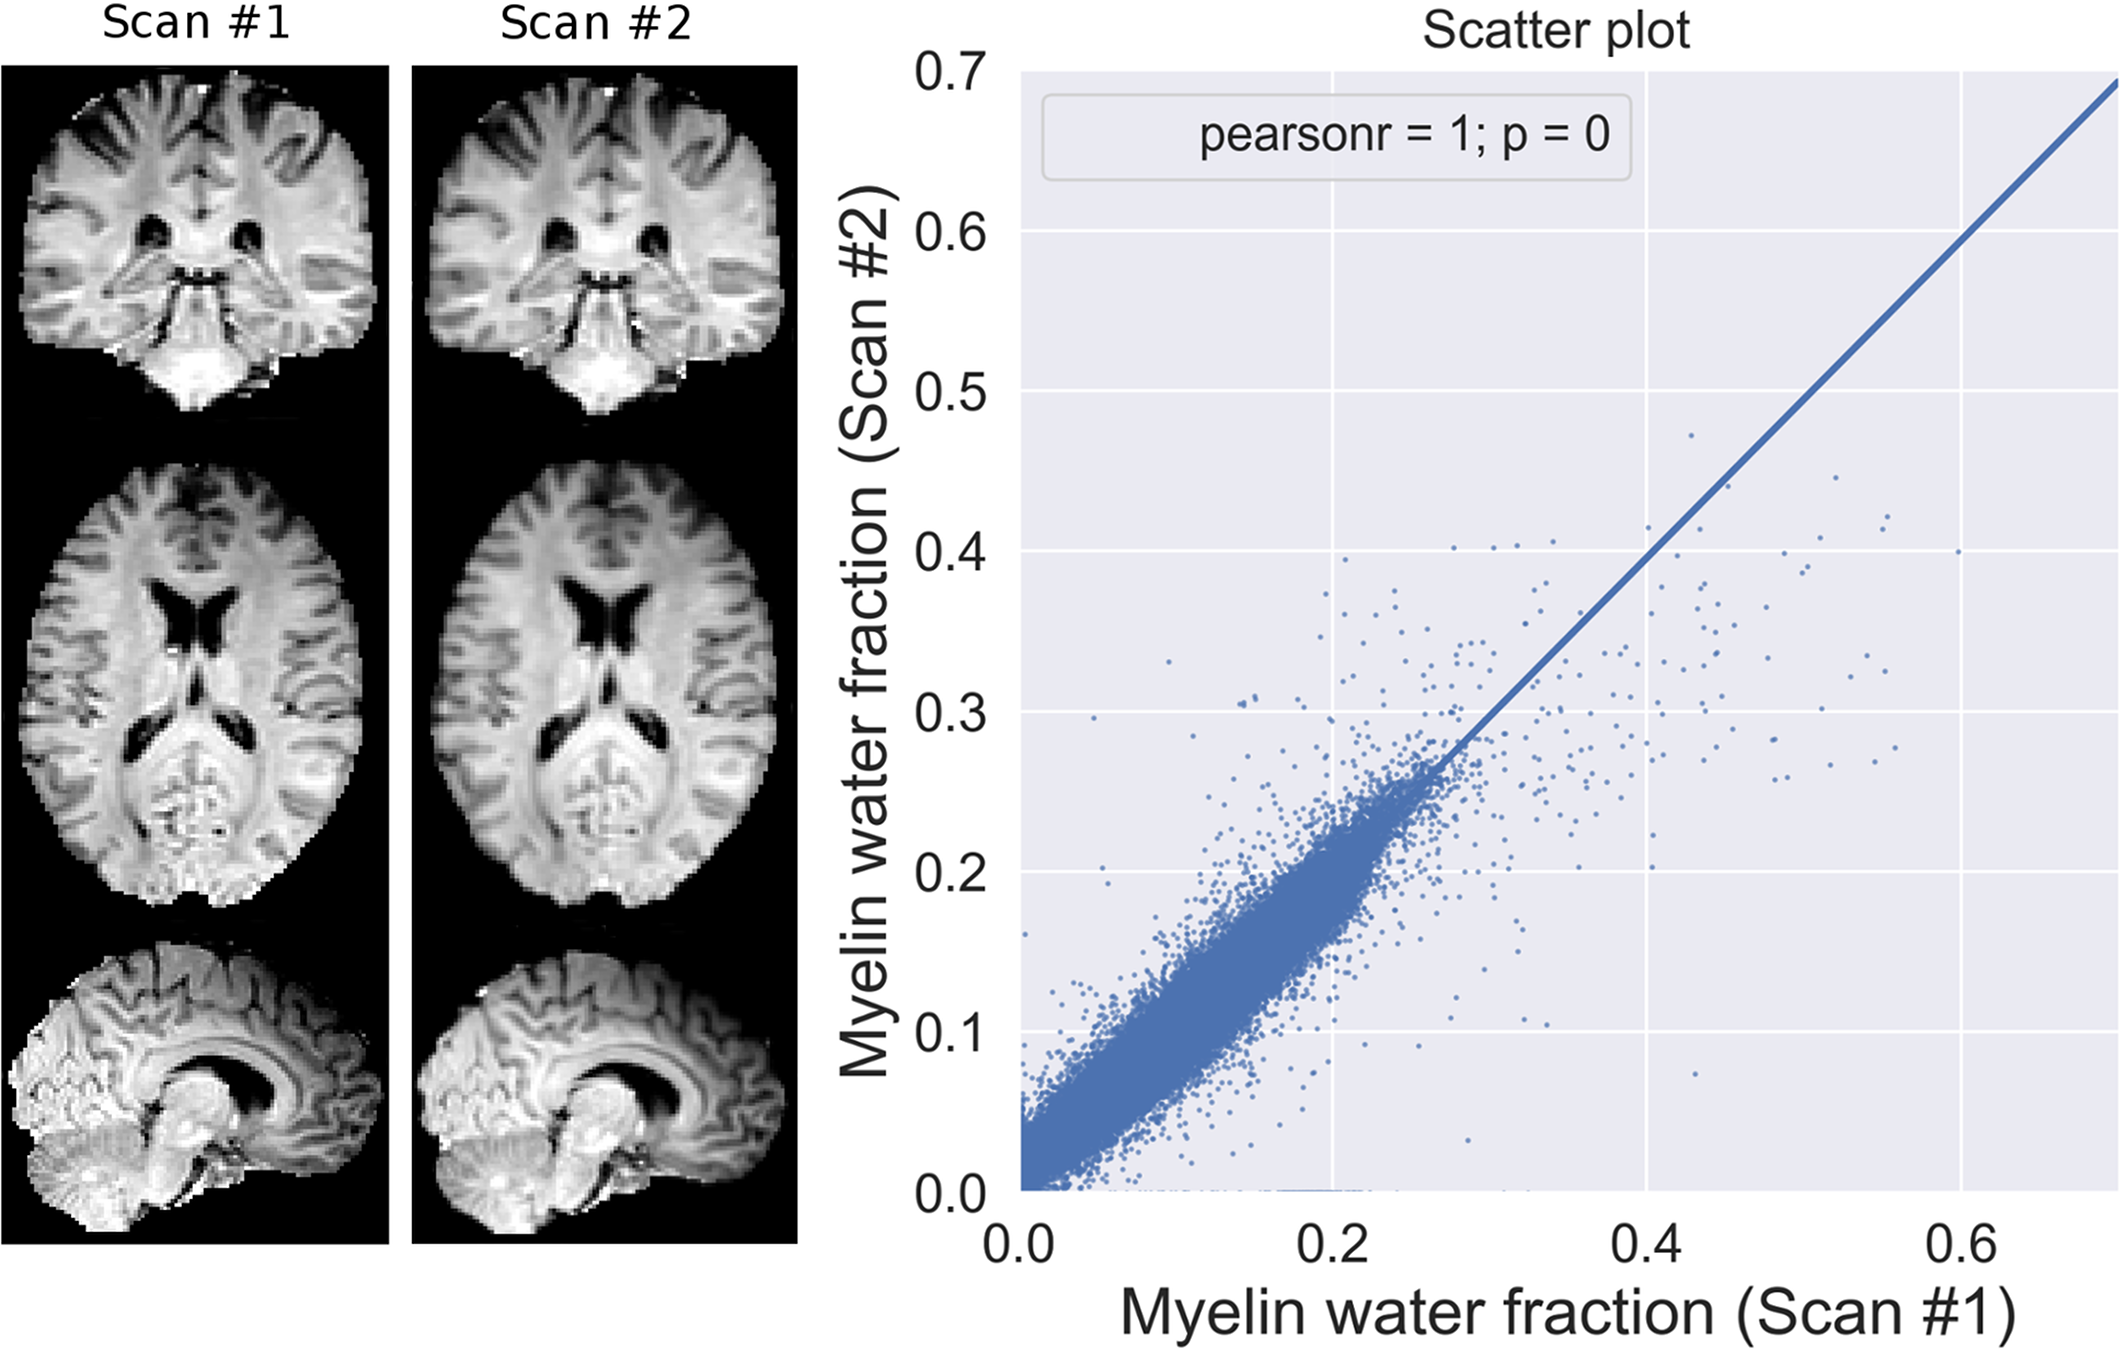
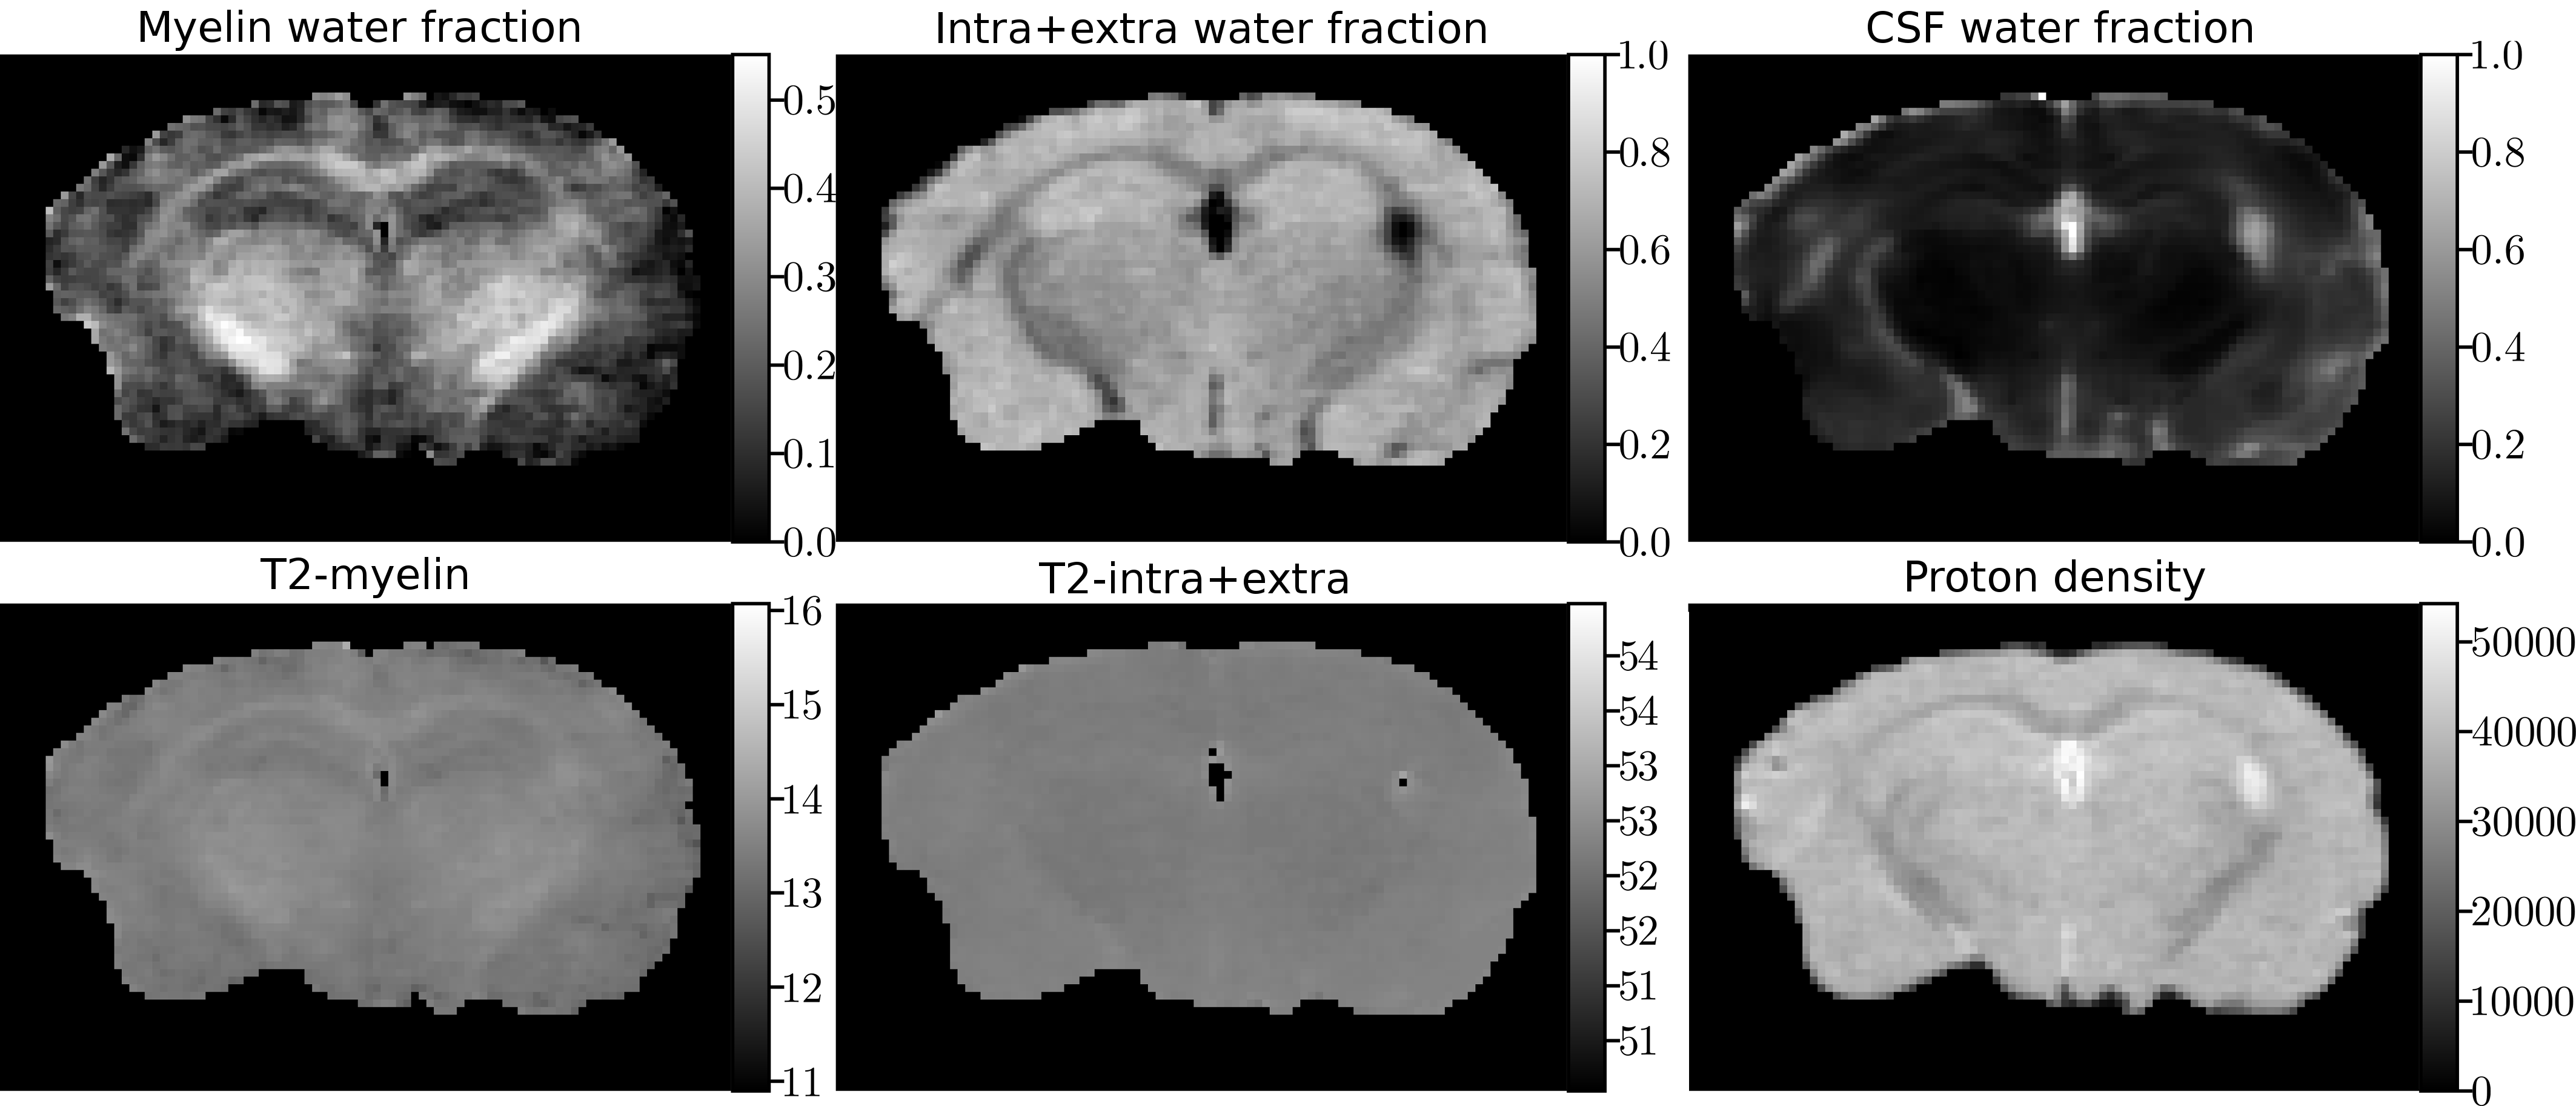
Figure 3. Estimation of relevant microstructure parameters from multi-echo T2 ex-vivo data acquired from a mouse brain, including the myelin water fraction and the water fraction of the intra- and extra-cellular compartments, T2 relaxation times, and proton density.