4900
Sensitivity of in vivo myelin imaging techniques to detect subtle changes in myelin lipid and protein content in post-mortem multiple sclerosis brain tissues1Physics and Astronomy, University of British Columbia, Vancouver, BC, Canada, 2Pediatrics, University of British Columbia, Vancouver, BC, Canada, 3UBC MRI Research Centre, Univeristy of British Columbia, Vancouver, BC, Canada, 4Neuroimmunology, Medical University of Vienna, Vienna, Austria, 5Institute of Neurology, Medical University of Vienna, Vienna, Austria, 6Biomedical Imaging and Image‐Guided Therapy, Medical University of Vienna, Vienna, Austria, 7Radiology, Univeristy of British Columbia, Vancouver, BC, Canada, 8Neuropathology, Medical University of Göttingen, Göttingen, Germany
Synopsis
Previous post-mortem single-slice myelin water fraction (MWF) measurements have shown good correlations with the myelin lipid fraction across tissue types. However, the role of protein content was not assessed nor have validations been performed for the whole brain 3D-Gradient and Spin Echo (GraSE) technique that has been employed in recent studies. We showed that 3D-GraSE based MWF measurements reliably distinguished regions of different myelin integrity reflective of difference in myelin lipid and protein content. In contrast, subtle variations in MWF within tissue classes or between persons may relate to differences in protein content.
Introduction
Multi-echo spin-echo imaging is the gold-standard1 for assessing the myelin water fraction (MWF)2 in vivo as post-mortem studies demonstrated good correlations between MWF and histologically assessed myelin lipid content3,4. To achieve whole brain coverage, the validated single-slice spin-echo acquisition was replaced by an accelerated 3D-Gradient and Spin Echo (GraSE) imaging approach5. We acquired 3D-GraSE as well as magnetization transfer ratio (MTR)6 data to test whether previously reported correlations hold true in 3D-imaging and how they pertain to myelin lipid and protein content. We also investigated if subtle damage to myelin sheaths within normal-appearing or diffusely-abnormal white matter (NAWM/DAWM) of different subjects or between NAWM, DAWM and remyelinated lesions can be detected. Treatments with remyelinating or neuroprotective properties are being developed for multiple sclerosis (MS), but established imaging markers are unable to assess treatment efficacy in regard to myelin integrity. Thus, testing the sensitivity of myelin-specific imaging markers is important.Methods
Seven formalin-fixed brains of progressive MS patients were obtained from the Department of Neuroimmunology and the Institute of Neurology at the Medical University of Vienna. Three cases had been fixed within a year prior to scanning and histological processing. The other cases had been stored post-fixation for 9-14 years. 3D-GraSE and MTR data were collected on a 3T Philips Achieva using an 8-channel SENSE head coil (GraSE-MWF: 32 echoes, TE/deltaTE/TR=10/10/720ms, voxel sizes 0.83x0.83–0.95x0.95mm2, 1.5mm slice thickness; MTR: same in-plane resolution, 2mm slice thickness, TE/TR=3.7/85ms). Thereafter, tissue blocks were embedded in paraffin and cut (10μm thickness). Luxol-fast blue-periodic acid Schiff (LFB-PAS) as well as proteolipid protein (PLP) immunohistochemical stainings were performed following a standardized protocol7. MWF maps were computed by regularized non-negative least squares fitting of each voxel's decay curve to decay curves generated using the extended phase graph algorithm8,9. T2-distributions were investigated, and 25ms was chosen as the T2 cut-off to distinguish MW from intra/extracellular water. MTR was calculated as (Son-Soff)/Son. MR images and histology sections were co-registered using NiftyReg10. A linear regression model was employed to determine whether histological LFB or PLP-densities correlate with MWF or MTR values in different regions-of-interest (ROIs) within the MS brain.Results
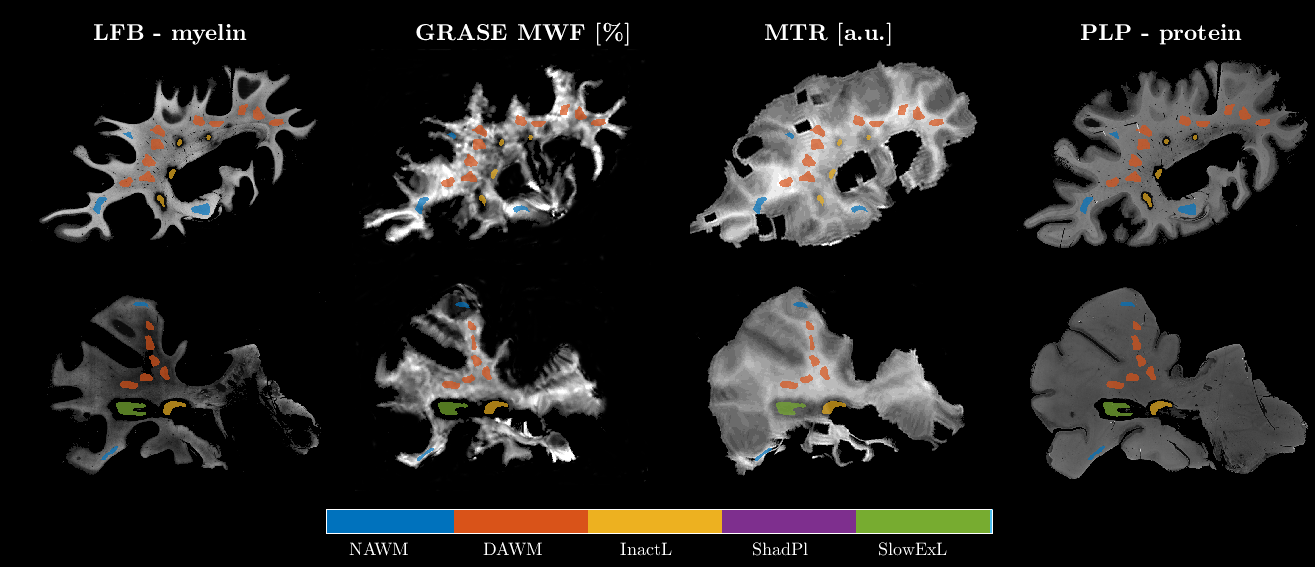
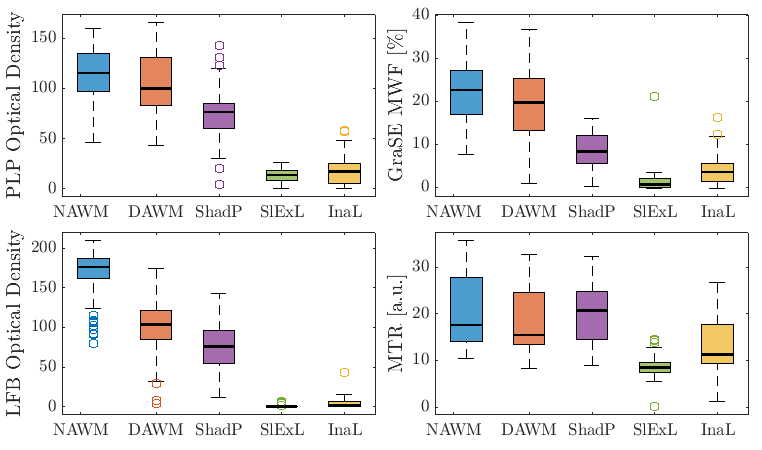
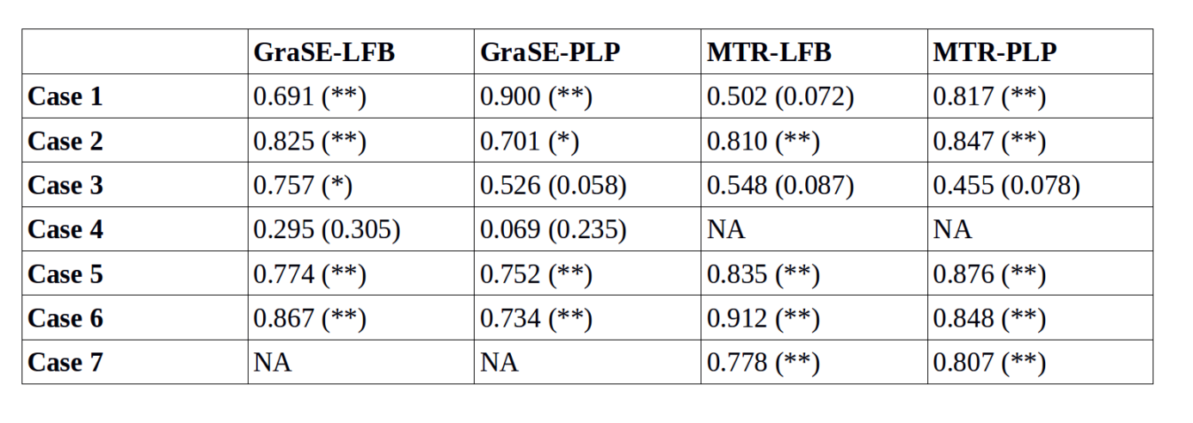
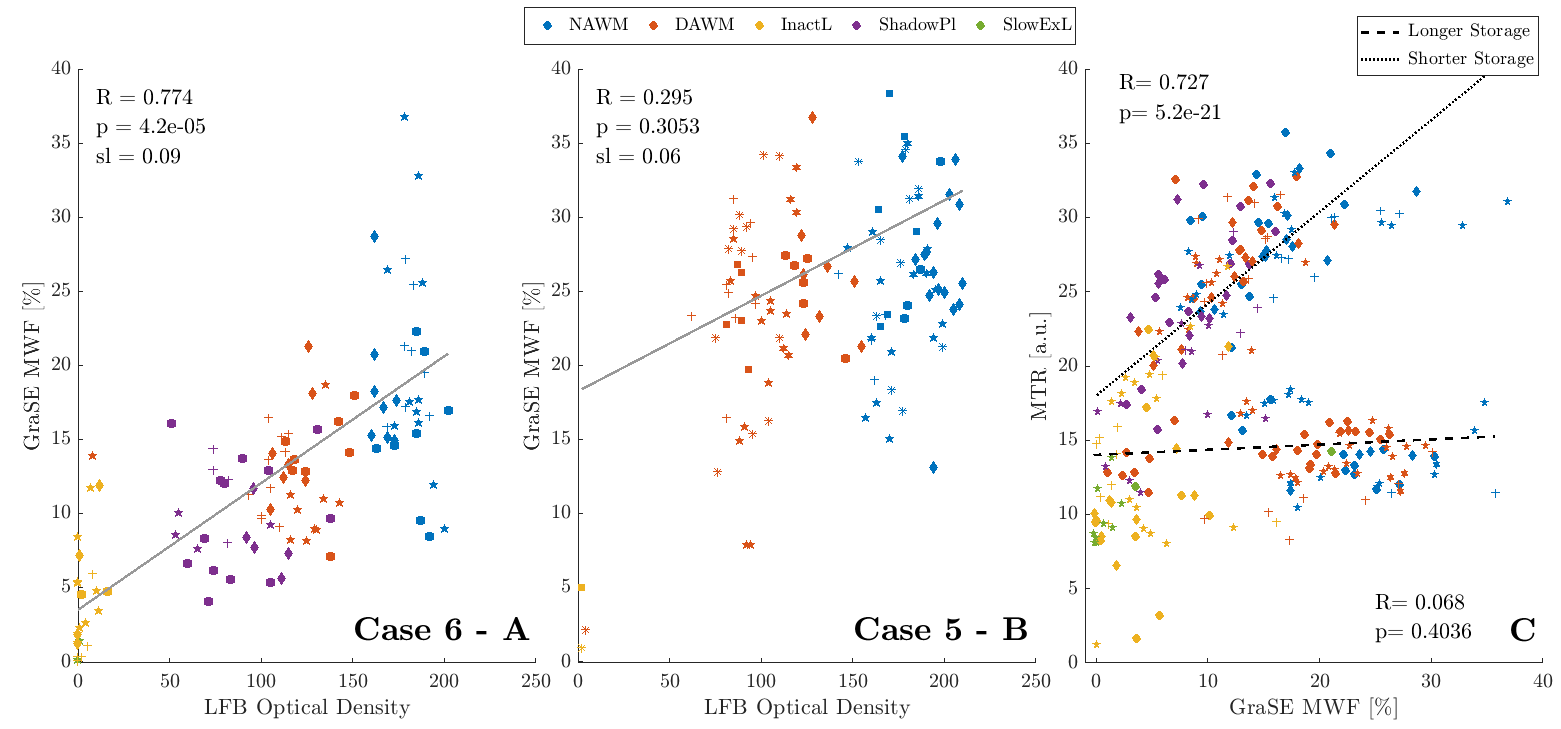
Example tissue slices of the co-registered MR and histological data are shown in Figure 1. Five tissue types were investigated: NAWM, DAWM, remyelinated lesions (shadow plaques, ShadPl), slowly expanding lesions (SlowExL) and inactive (InactL) MS lesions. Myelin preservation and the presence of LFB- and PLP-degradation products were assessed to classify tissue regions. Figure 2 compares obtained LFB, PLP, MWF and MTR values. All metrics reflected larger myelin density differences well, e.g. InactL-NAWM. However, subtle LFB-differences between NAWM and DAWM are poorly reflected in the MRI data. The low myelin lipid and protein content of ShadPl was not captured on MTR, but MWF clearly distinguished ShadPl from other lesions, NAWM, and DAWM. In line with previous literature3,4, MR metrics correlated strongly with histology on a per-case basis across all ROIs (Table 1, R-range=[0.069-0.912], median R=0.776). One case example is shown in Figure 3A. However, cases that included only NAWM/DAWM showed no significant relationships (Figure 3B). Correlations between MWF and MTR were only significant, if cases had been stored for less than 1 year, but were insignificant after extended storage times (Figure 3C). The linear regression and assessment of relative importance suggested that MWF values within tissue classes are primarily predicted by PLP, except in InactL, where LFB was the stronger predictor. MTR values were primarly affected by storage time. NAWM and InactL had LFB as the second strongest predictor of MTR, and as the primary predictor in ShadPl and SlowExL. Only DAWM showed a stronger influence of PLP.Discussion
Our GraSE-results agree with previous studies showing good correlations between spin-echo based MWF and LFB within individual cases. Good correlations with PLP suggest that our MR metrics reflect myelin lipid and protein concentrations. The linear regression demonstrated that subtle within-tissue-class MWF differences are goverened by PLP-intensities. MTR more so than MWF is strongly affected by storage time. Signal variations may also be attributed to differences in post-mortem delay times, which were unknown for our sample. Differences in slice thickness between MR and histology and the small diameters of many MS lesions may challenge accurate measurements within lesions.Conclusion
3D-GraSE based MWF measurements reliably distinguish regions of different myelin integrity. MWF also provided improved discrimination of remyelinated lesions from other tissue types, while MTR was unable to distinguish ShadPl from NAWM/DAWM11. NAWM variations in MWF values between patients may relate to differences in protein content, while between tissue variations reflect LFB and PLP changes.Acknowledgements
No acknowledgement found.References
1. Alonso‐Ortiz E, Levesque IR, Pike GB. MRI‐based myelin water imaging: A technical review. Magn Reson Med 2015;73(1):70-81.
2. MacKay A, Whittall K, Adler J, et al. In vivo visualization of myelin water in brain by magnetic resonance. Magn Reson Med 1994;31(6):673-677.
3. Laule C, Leung E, Li DKB, et al. Myelin water imaging in multiple sclerosis: quantitative correlations with histopathology. Mult Scler 2006;12(6):747-753.
4. Laule C, Kozlowski P, Leung E, et al. Myelin water imaging of multiple sclerosis at 7T: correlations with histopathology. NeuroImage 2008;40(4):1575-1580.
5. Prasloski T, Rauscher A, MacKay AL, et al. Rapid whole cerebrum myelin water imaging using a 3D GRASE sequence. NeuroImage 2012;63(1):533-539.
6. Wolff SD, Balaban RS. Magnetization transfer contrast (MTC) and tissue water proton relaxation in vivo. Magn Reson Med 1989;10:135-144.
7. Hametner S, Wimmer I, Haider L, et al. Iron and neurodegeneration in the multiple sclerosis brain. Ann Neurol 2013;74(6):848‐861.
8. Hennig J. Multiecho imaging sequence with low refocusing flip angles. JMRI 1988;78(3):397-407.
9. Prasloski T, Mädler B, Xiang Q-S, et al. Applications of stimulated echo correction to multicomponent T2 analysis. Magn Reson Med 2012;67(6):1803-1814.
10. Modat M, Cash DM, Daga P, Winston GP, Duncan JS, Ourselin S. Global image registration using a symmetric block-matching approach. J Med Imaging 2014;1(2):024003.
11. Schmierer K, Scaravilli F, Altmann DR, et al. Magnetization transfer ration and myelin in postmortem multiple sclerosis brain. Ann Neurol 2004;56(3):407-415.
Figures