4898
Multi-exponential Relaxometry using $$$\ell_1$$$-regularized Iterative NNLS (MERLIN) for Accurate and Robust Myelin Water Fraction Imaging1Institute of Neuroscience and Medicine 4, Forschungszentrum Jülich, Jülich, Germany, 2Department of Neurology, RWTH Aachen University, Aachen, Germany, 3Institute of Neuroscience and Medicine 11, JARA, Forschungszentrum Jülich, Jülich, Germany, 4JARA - BRAIN, Translational Medicine, Aachen, Germany
Synopsis
A new parameter estimation algorithm, MERLIN, is presented for accurate and robust multi-exponential relaxometry using MRI. Multi-exponential relaxometry is fundamentally ill-conditioned, and as such, is extremely sensitive to noise. MERLIN is a fully automated, multi-voxel approach that incorporates $$$\ell_1$$$-regularization to enforce sparsity and spatial consistency of the estimated distributions. The proposed method is compared to the conventional $$$\ell_2$$$-regularized NNLS (rNNLS) in simulations and in vivo experiments, using a multi-echo gradient-echo (MEGE) sequence at 3T. The estimated water fraction maps from MERLIN are spatially more consistent, more precise, and more accurate, reducing the root-mean-squared-error by up to 90 percent in simulations.
Introduction
Multi-exponential relaxometry can provide vital information about tissue damage in various neuropathologies1,2. A very common analysis method is the non-negative least-squares (NNLS) algorithm, which estimates a distribution of relaxation times from a time series. This approach solves a convex problem and requires no prior knowledge of the number of exponentials in the time signal. However, among its disadvantages are the lack of stability and the detection of spurious peaks in the distribution. Therefore, the most frequently used modification is the $$$\ell_2$$$-regularized NNLS (rNNLS) algorithm3. Compared to other methods, rNNLS tends to overestimate the myelin water fraction (MWF) at low signal-to-noise ratios (SNR) due to the broadening of the intra-/extracellular pool4. To improve the spatial consistency of the MWF maps, a semi-automated multi-voxel approach5 was proposed that penalizes the $$$\ell_2$$$-norm of the spatial differences of the distribution. Here, we present a fully automated multi-voxel approach, MERLIN, which replaces the $$$\ell_2$$$-based regularization terms with $$$\ell_1$$$-based regularization. This suppresses spurious peaks without broadening the distributions and reduces noise without over-smoothing features. MERLIN is validated here using simulations and in vivo experiments.Theory
Let $$$\mathbf{x}$$$ be the distributions and $$$\mathbf{d}$$$ the data acquired at all voxel positions in vectorized form. Let $$$\bar{\mathbf{A}}=\mathrm{diag}(\mathbf{A},\dots,\mathbf{A})$$$ be a block-diagonal matrix, where $$$\mathrm{A}_{m,n}=\exp(-\mathrm{TE}_m/T_{2,n}^*)$$$, with the acquired echo times, $$$\mathrm{TE}_m$$$, and the estimated relaxation times, $$$T_{2,n}^*$$$. MERLIN minimizes $$\min_{\mathbf{x}\geq0}\lambda_\mathrm{S}\lVert \mathbf{x}\rVert_1+\lambda_\mathrm{TV}\lVert\mathbf{x}\rVert_\mathrm{TV} \\ \mathrm{s.t.}\lVert\mathbf{\bar{A}x}-\mathbf{d}\rVert_2^2\leq\alpha\eta^2$$ with the regularization parameters $$$\lambda_\mathrm{S}=0.01$$$ and $$$\lambda_\mathrm{TV}=0.1$$$, and the isotropic total variation norm, $$$\lVert\cdot\rVert_\mathrm{TV}$$$, applied along the spatial dimensions. MERLIN ensures that the data residual is not greater than $$$\alpha=1.025$$$ times the minimal data residual of the non-regularized problem, $$$\eta^2 = \min_{\mathbf{x}\geq0}\lVert\bar{\mathbf{A}}\mathbf{x}-\mathbf{d}\rVert_2^2$$$. The split Bregman method4 is used to solve this problem.
Methods
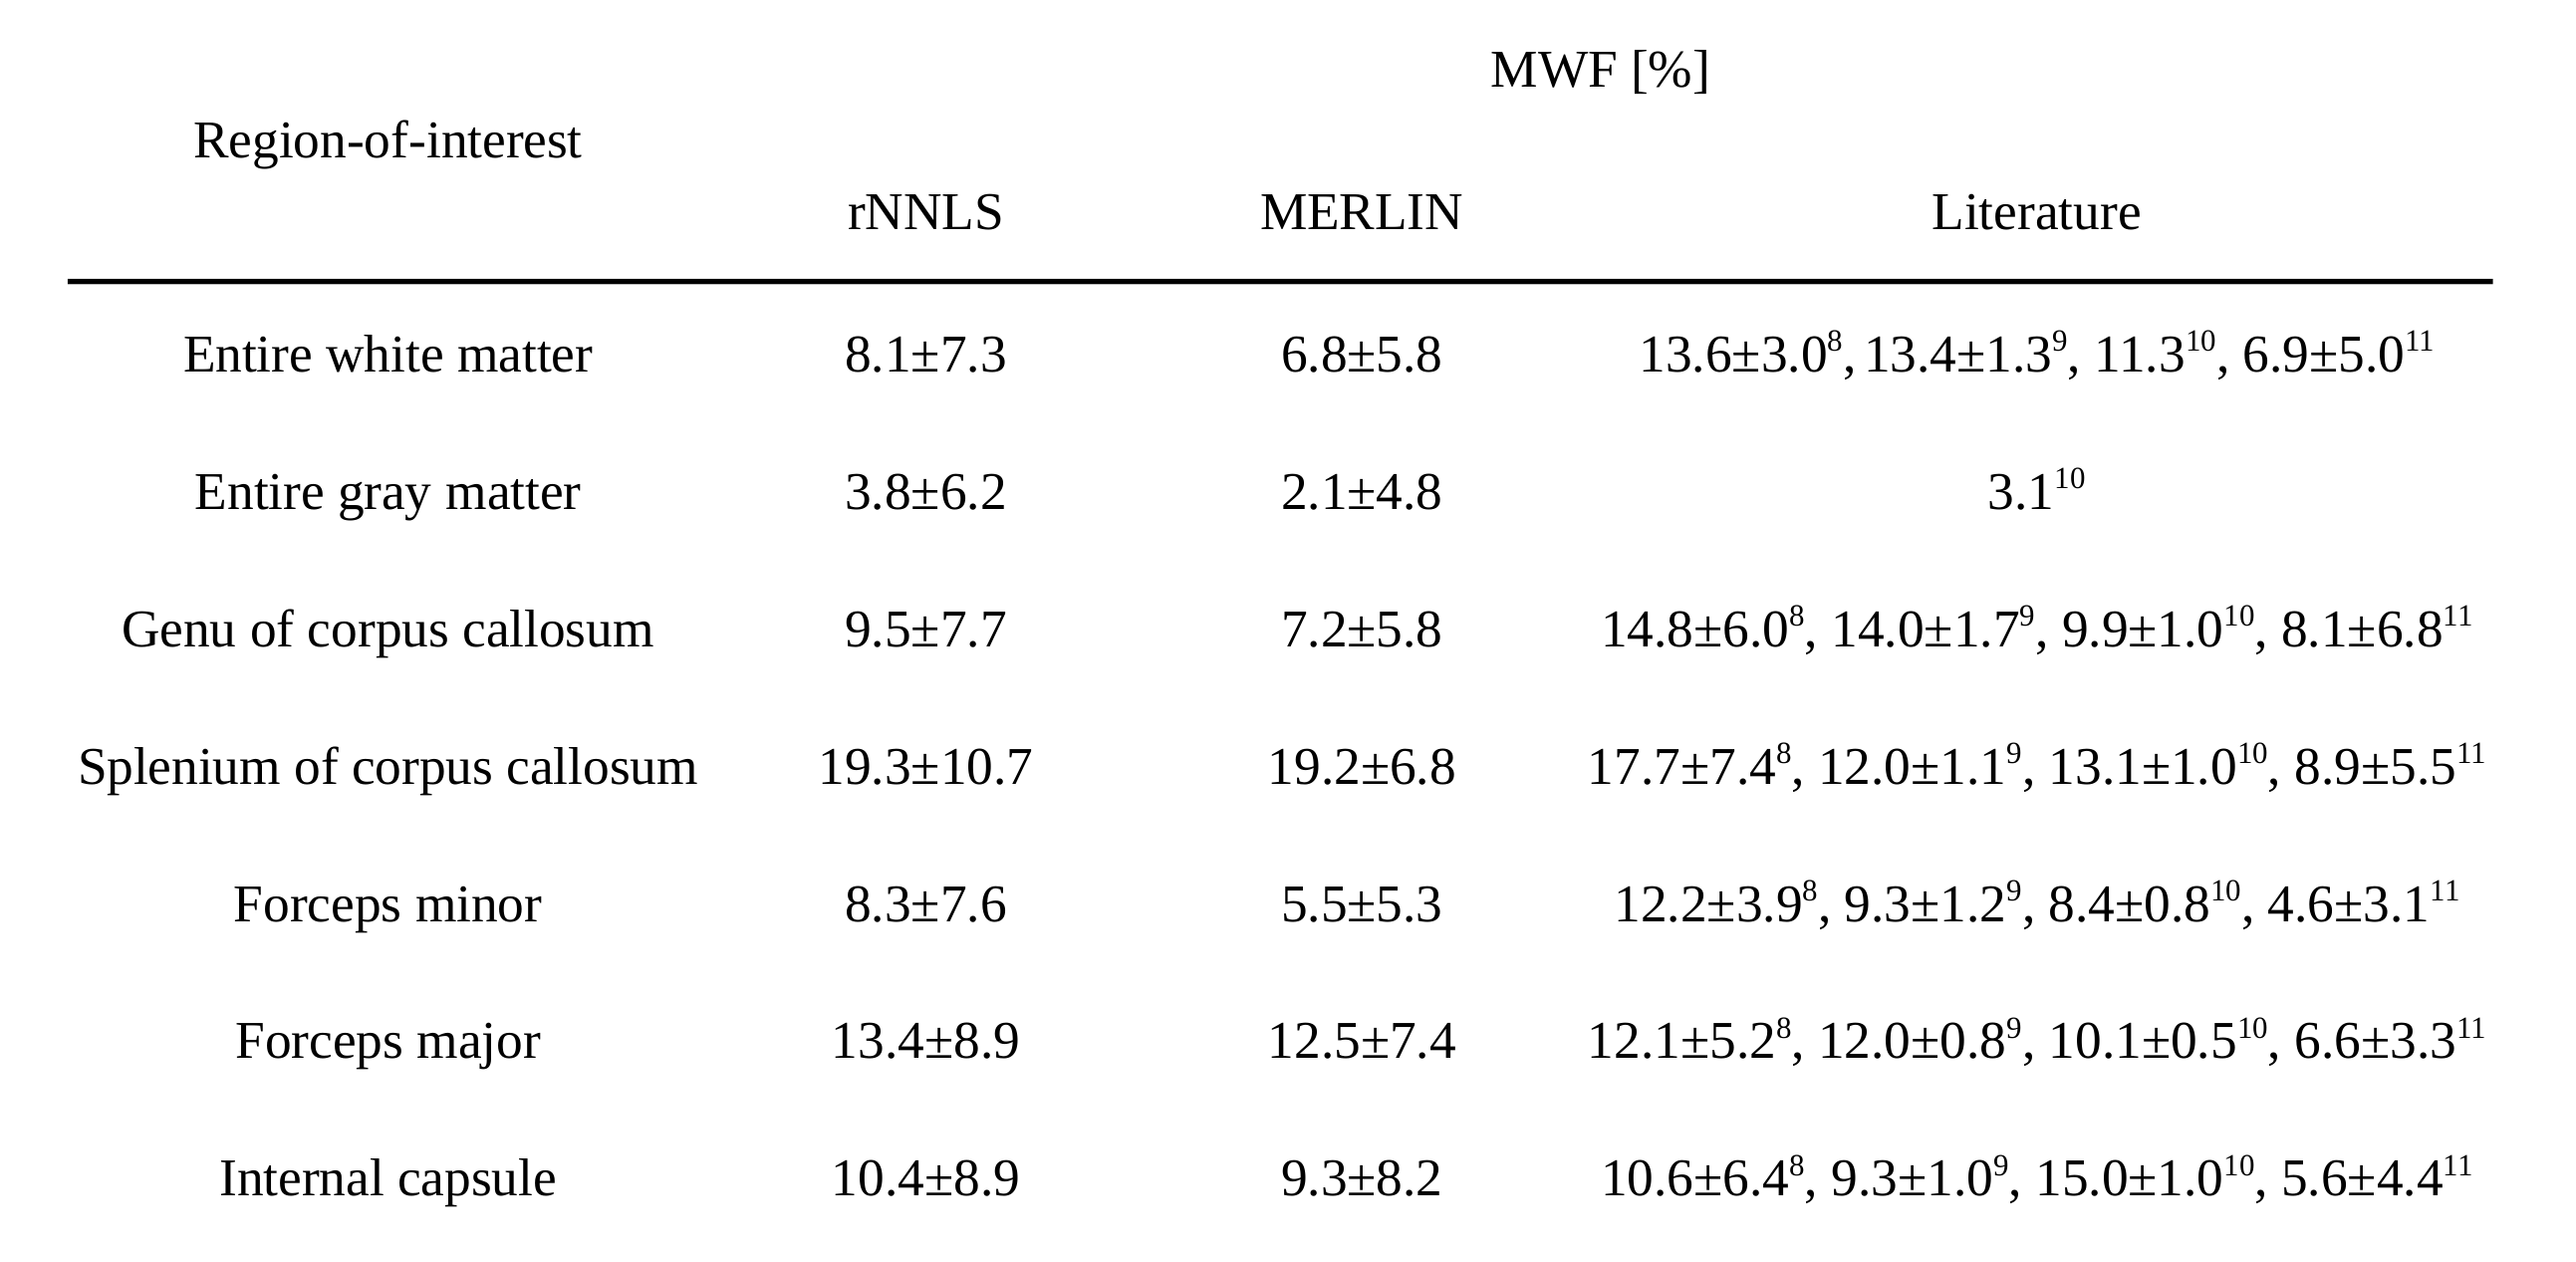
Numerical validations were performed using a phantom with 16 regions-of-interest (ROI), containing two water pools, whereas the background (BG) contained only a single pool. The $$$T_2^*$$$ of the slow-relaxing compartment was set to 50 ms for all ROIs and the background. This represents the intra-/extracellular water pool (IE) of white matter at 3T. The fast-relaxing compartment of each ROI had a water fraction of 5%, 10%, 15%, and 20% and a $$$T_2^*$$$ of 3, 6, 9, and 12 ms, being a proxy for the myelin water pool (M). Each pool was modeled by a Gaussian distribution centered at position $$$T_2^*$$$, with a standard deviation of 10%3. To quantify the accuracy of the estimated parameter maps, the root mean squared error (RMSE) is computed for the MWF and the geometric mean of $$$T_2^*$$$ (gmT2*) of all ROIs and, separately, for the background. Finally, the median and quartile deviation of the MWF and gmT2* (M) of each ROI are individually compared against the ground truth. In vivo experiments were conducted using a commercial 3T scanner (MAGNETOM Prisma, Siemens Healthineers, Erlangen, Germany). A 2D MEGE sequence was used with TE1=3ms, ΔTE=1ms, 80 echoes, TR=2000ms, FA=85°, matrix size 130 x 130, resolution 1.6mm x 1.6mm x 2mm, 21 slices, BW=1282 Hz/px. The total scan time was 4min 40s. Following prior written informed consent, MR data was acquired from a representative healthy volunteer. The data was corrected for static magnetic field inhomogeneity7. ROI analysis was performed on the MWF maps and the results were compared to the literature8–11.
Results
For the simulation results, the estimated MWF and gmT2*
for the fast-relaxing pool (M) are shown in Fig 1. The parameter maps estimated by MERLIN appear spatial more consistent. The RMSE of the
estimated maps is given in Table I, showing a reduced RMSE of up to 90% compared to rNNLS. The estimated distributions as
well as the median estimated MWF and gmT2*
(M) versus the ground truth are displayed in Fig. 2. The estimated distributions are more narrow and the estimated parameters more precise compared to rNNLS. For the in vivo results, the MWF and gmT2*
(M) maps of three representative slices are shown in Fig. 3, together
with the contrast images of the first echo. Again, the parameter maps estimated by MERLIN appear spatially more consistent. Finally, the results of
the ROI analysis are given in Table II. The results are largely in agreement with the literature for rNNLS and MERLIN and the standard deviation of the estimated MWF is consistently lower compared to rNNLS.
Discussion
The proposed method offers a fully automated, convex approach for robust multi-exponential analysis. The regularization strength is optimal with respect to the desired data fidelity. Compared to other approaches for multi-exponential relaxometry, MERLIN preserves the advantages of rNNLS and produces more spatially consistent, more precise, and more accurate MWF and gmT2* maps.Acknowledgements
No acknowledgement found.References
1. Laule C, Vavasour IM, Moore GRW, Oger J, Li DKB, Paty DW, et al. Water content and myelin water fraction in multiple sclerosis. J Neurol. 2004 Mar 1;251(3):284–93.
2. Neema M, Goldberg-Zimring D, Guss ZD, Healy BC, Guttmann CRG, Houtchens MK, et al. 3 T MRI relaxometry detects T2 prolongation in the cerebral normal-appearing white matter in multiple sclerosis. NeuroImage. 2009 Jul 1;46(3):633–41.
3. Graham SJ, Stanchev PL, Bronskill MJ. Criteria for analysis of multicomponent tissue T2 relaxation data. Magn Reson Med. 1996 Mar 1;35(3):370–8.
4. Bjarnason TA, McCreary CR, Dunn JF, Mitchell JR. Quantitative T2 analysis: The effects of noise, regularization, and multivoxel approaches. Magn Reson Med. 2010 Jan 1;63(1):212–7.
5. Kumar D, Nguyen TD, Gauthier SA, Raj A. Bayesian algorithm using spatial priors for multiexponential T2 relaxometry from multiecho spin echo MRI. Magn Reson Med. 2012 Nov 1;68(5):1536–43.
6. Goldstein T, Osher S. The split Bregman method for L1-regularized problems. SIAM J Imaging Sci. 2009;2(2):323–343.
7. Alonso-Ortiz E, Levesque IR, Paquin R, Pike GB. Field inhomogeneity correction for gradient echo myelin water fraction imaging. Magn Reson Med. 2017 Jul 1;78(1):49–57.
8. Alonso-Ortiz E, Levesque IR, Pike GB. Multi-gradient-echo myelin water fraction imaging: Comparison to the multi-echo-spin-echo technique. Magn Reson Med. 2018 Mar 1;79(3):1439–46.
9. Wu Z, He H, Sun Y, Du Y, Zhong J. High resolution myelin water imaging incorporating local tissue susceptibility analysis. Magn Reson Imaging. 2017 Oct 1;42:107–13.
10. Whittall KP, Mackay AL, Graeb DA, Nugent RA, Li DK, Paty DW. In vivo measurement of T2 distributions and water contents in normal human brain. Magn Reson Med. 1997;37(1):34–43.
11. Lenz C, Klarhöfer M, Scheffler K. Feasibility of in vivo myelin water imaging using 3D multigradient-echo pulse sequences. Magn Reson Med. 2012 Aug 1;68(2):523–8.
Figures
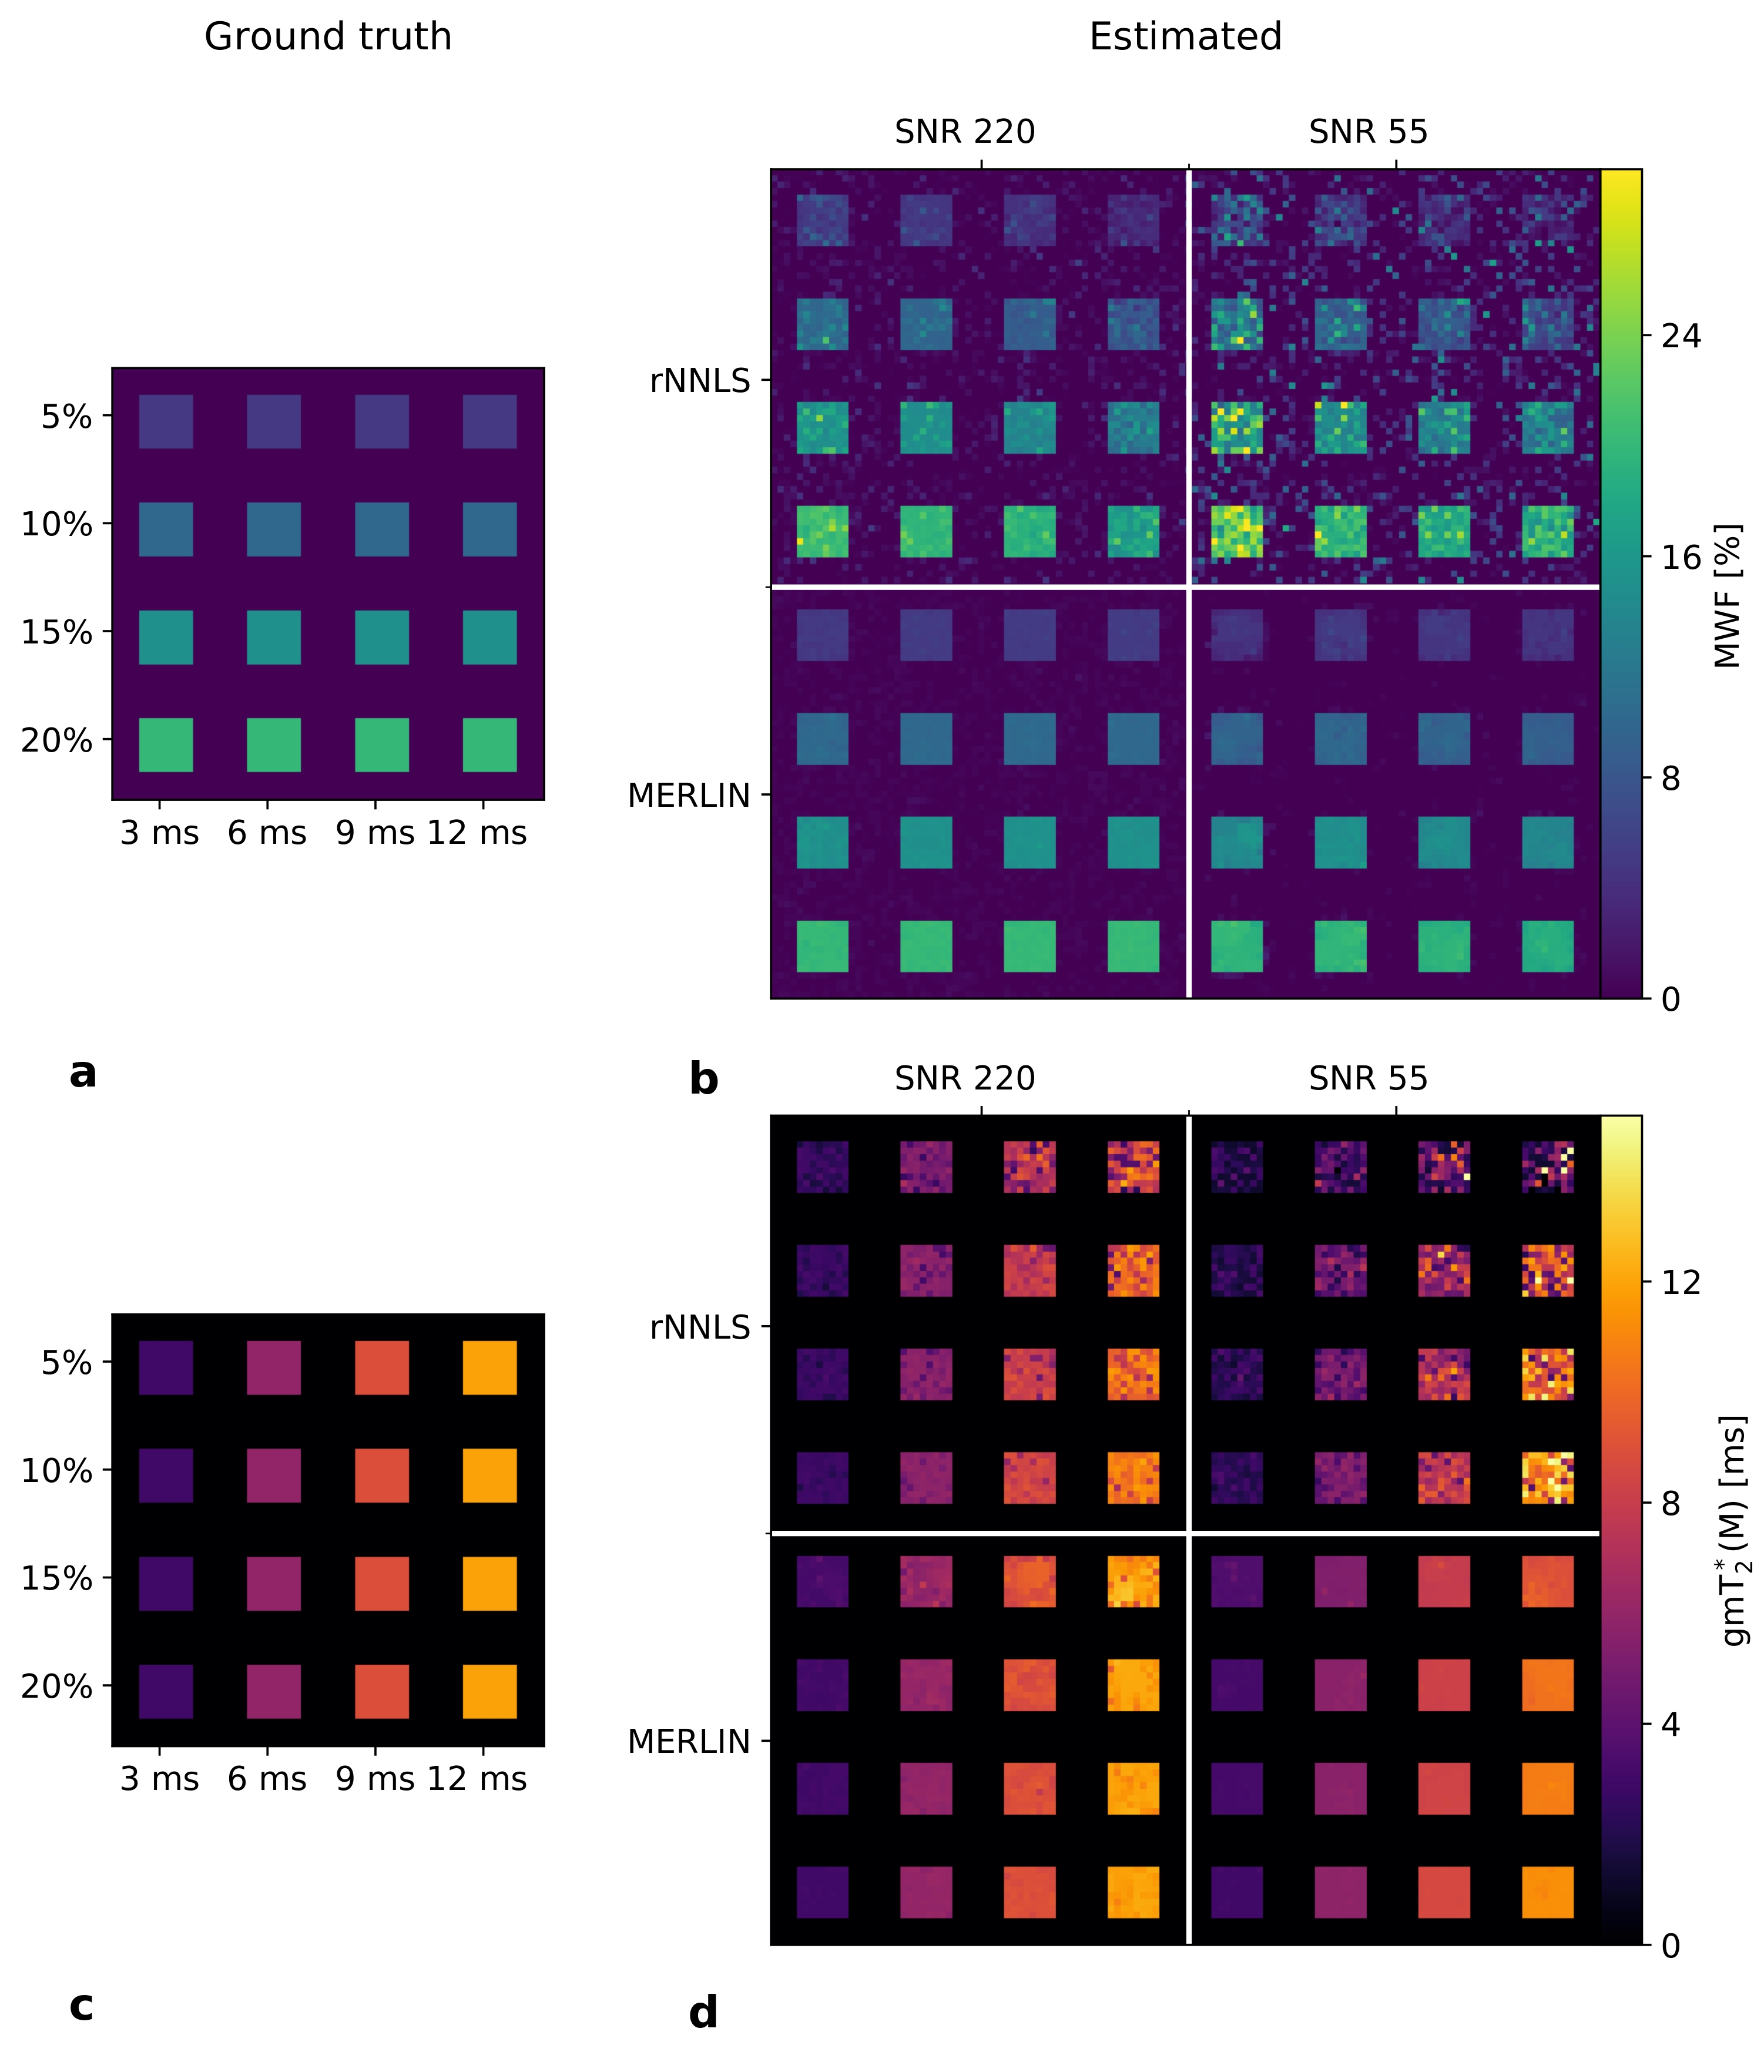
Fig. 1. Simulation results showing (a) the ground truth, (b) the estimated myelin water fraction (MWF) maps, (c) the ground truth and (d) the estimated gmT2* maps for the myelin pool (M) computed with rNNLS and MERLIN for different SNR levels. For visual clarity, the background was masked out in the gmT2* (M) maps. The maps estimated by MERLIN appear less noisy and spatially more consistent.
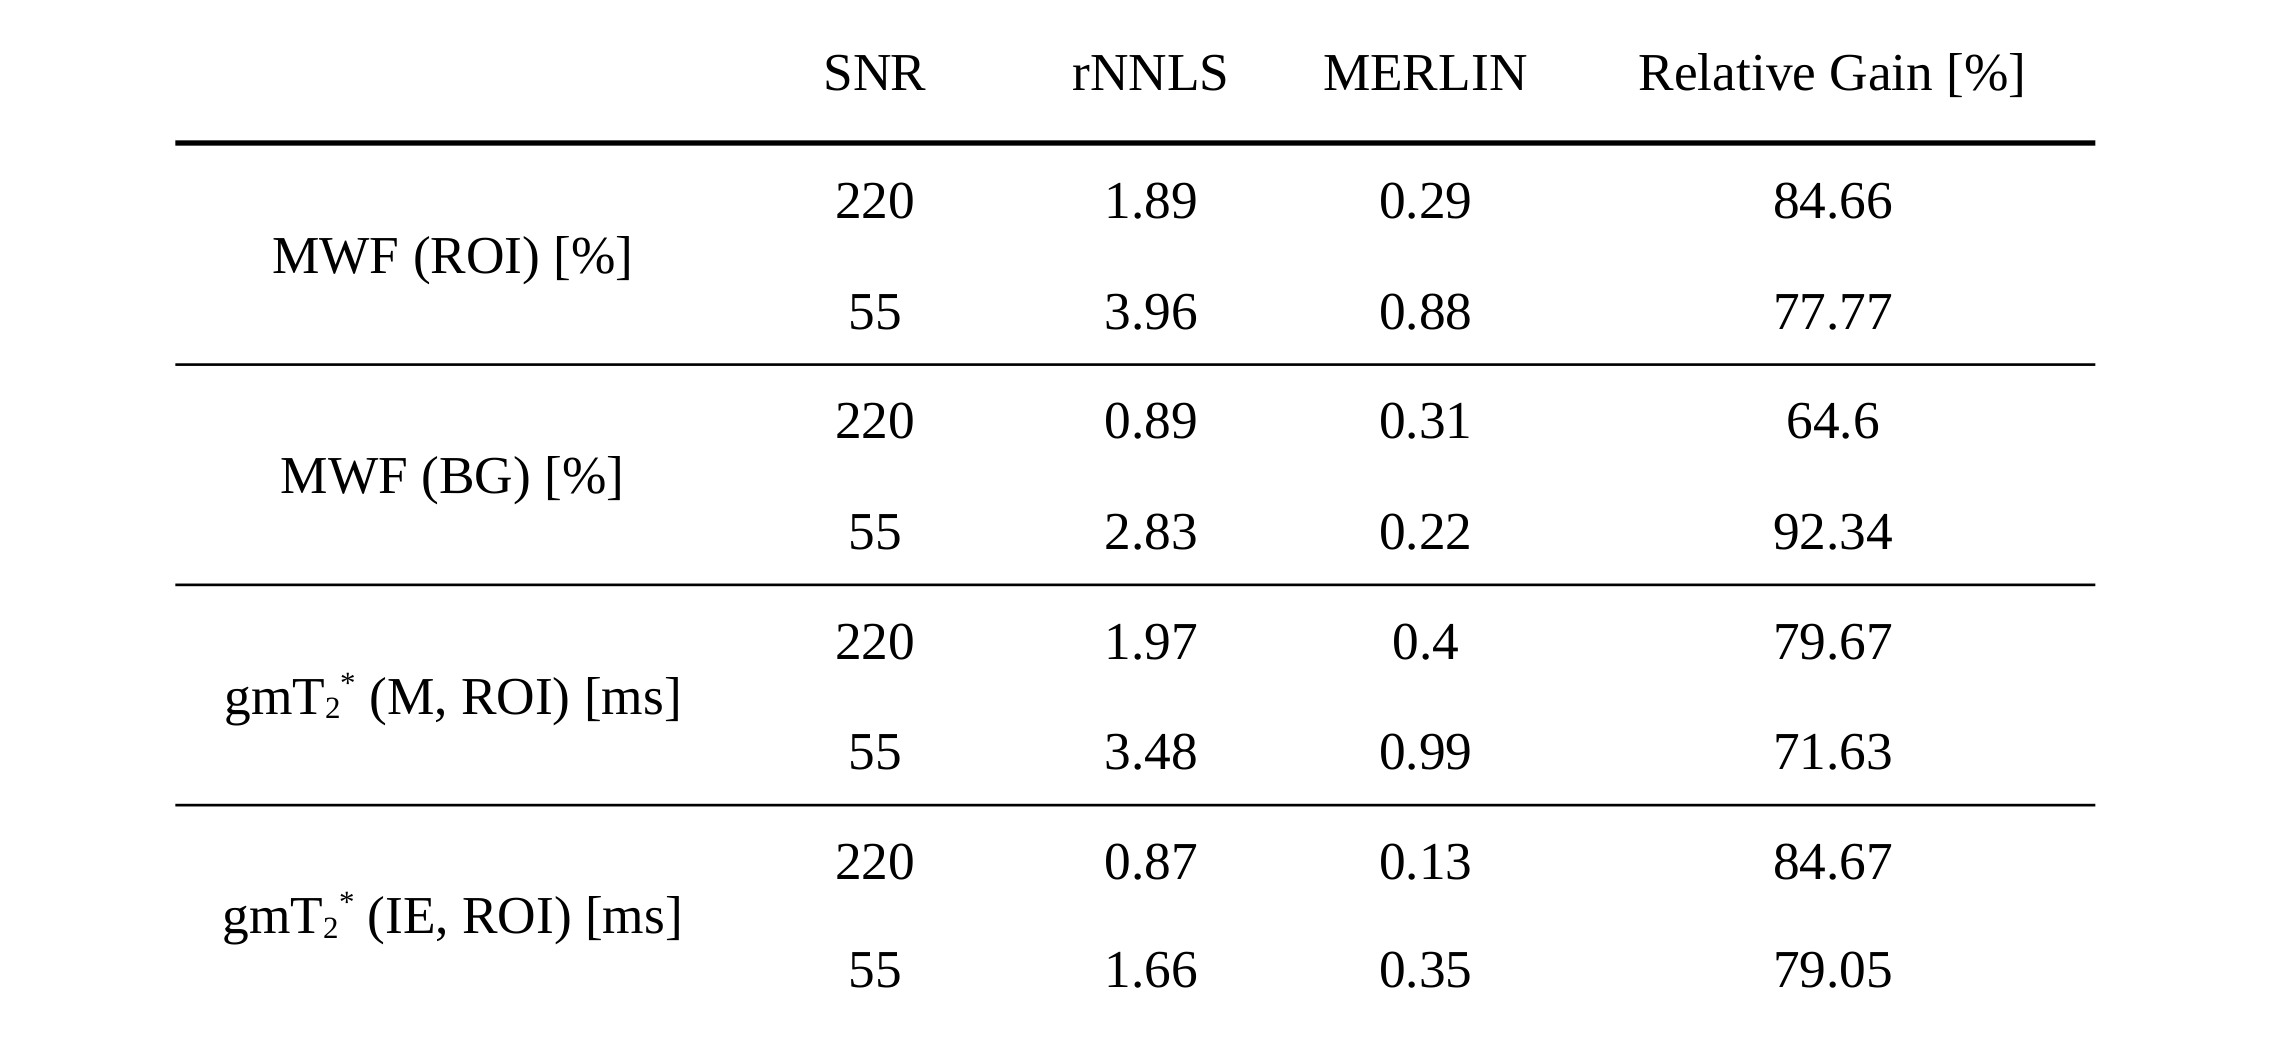
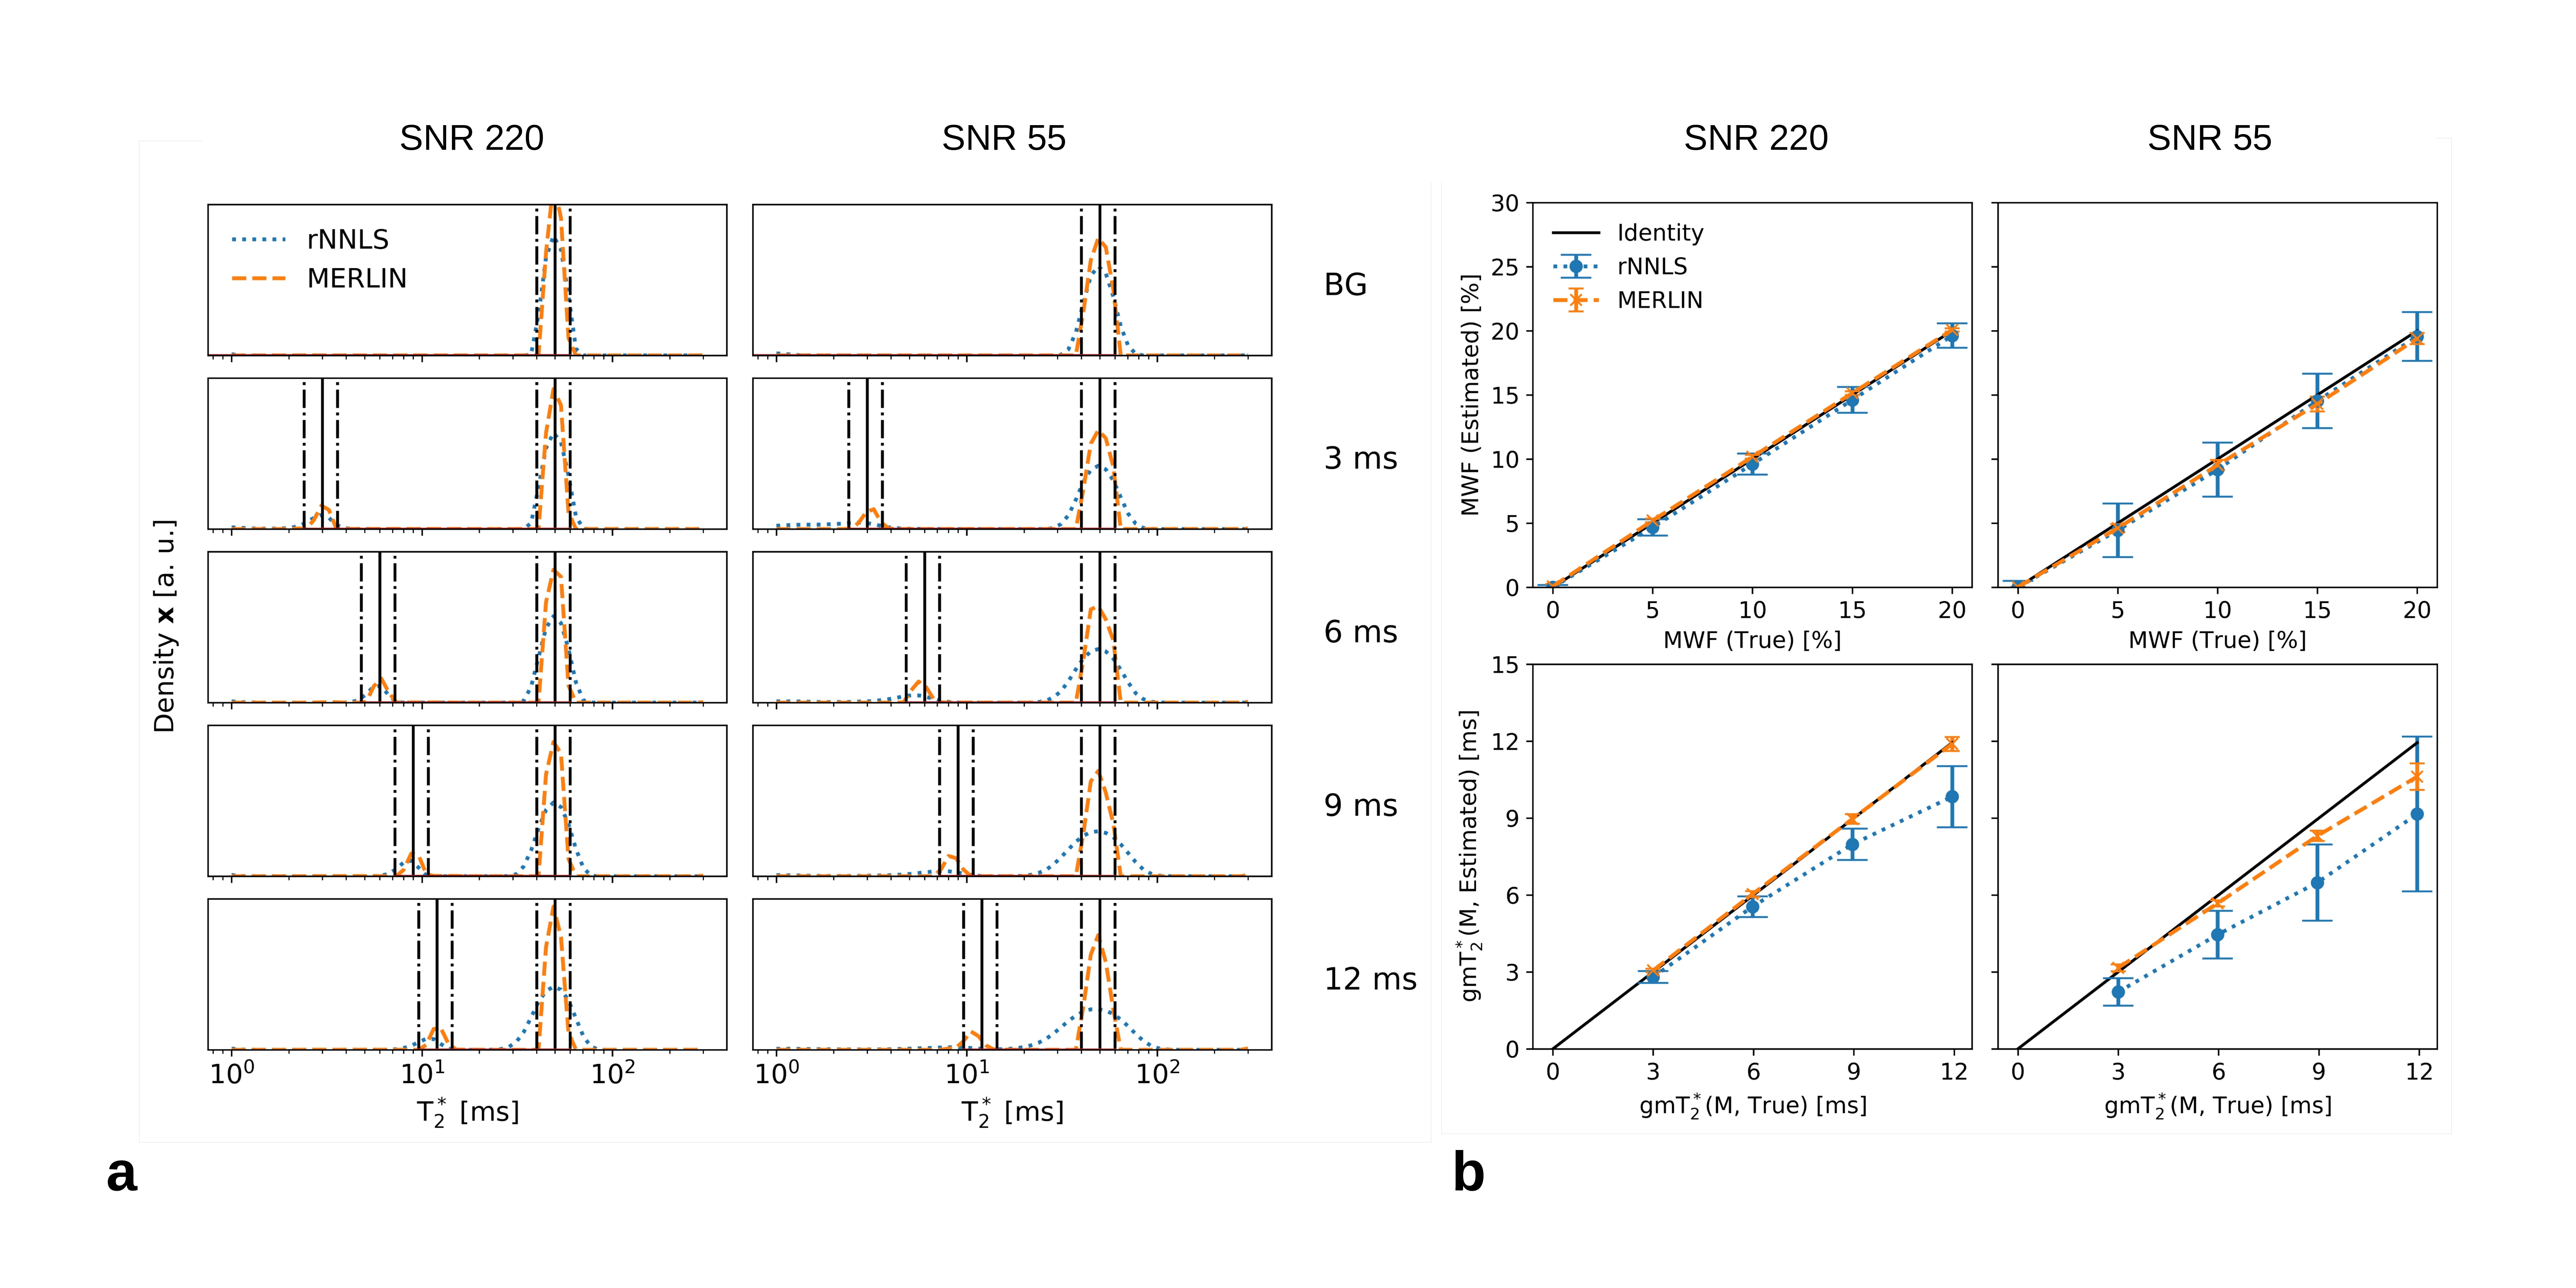
Fig. 2. Simulation results showing (a) the estimated
distributions and (b) the median estimated versus the true
myelin water fraction (MWF) and gmT2* (M) for
the myelin pool (M) for different SNR levels, with the error bars
indicating the quartile deviation. The black line in (a)
indicates the true gmT2* and the dashed lines
the distance of 2 standard deviations. The distributions estimated by MERLIN are more narrow and the parameter maps estimated by MERLIN show a consistently lower quartile deviation. In particular for gmT2*, the results of MERLIN are less biased.
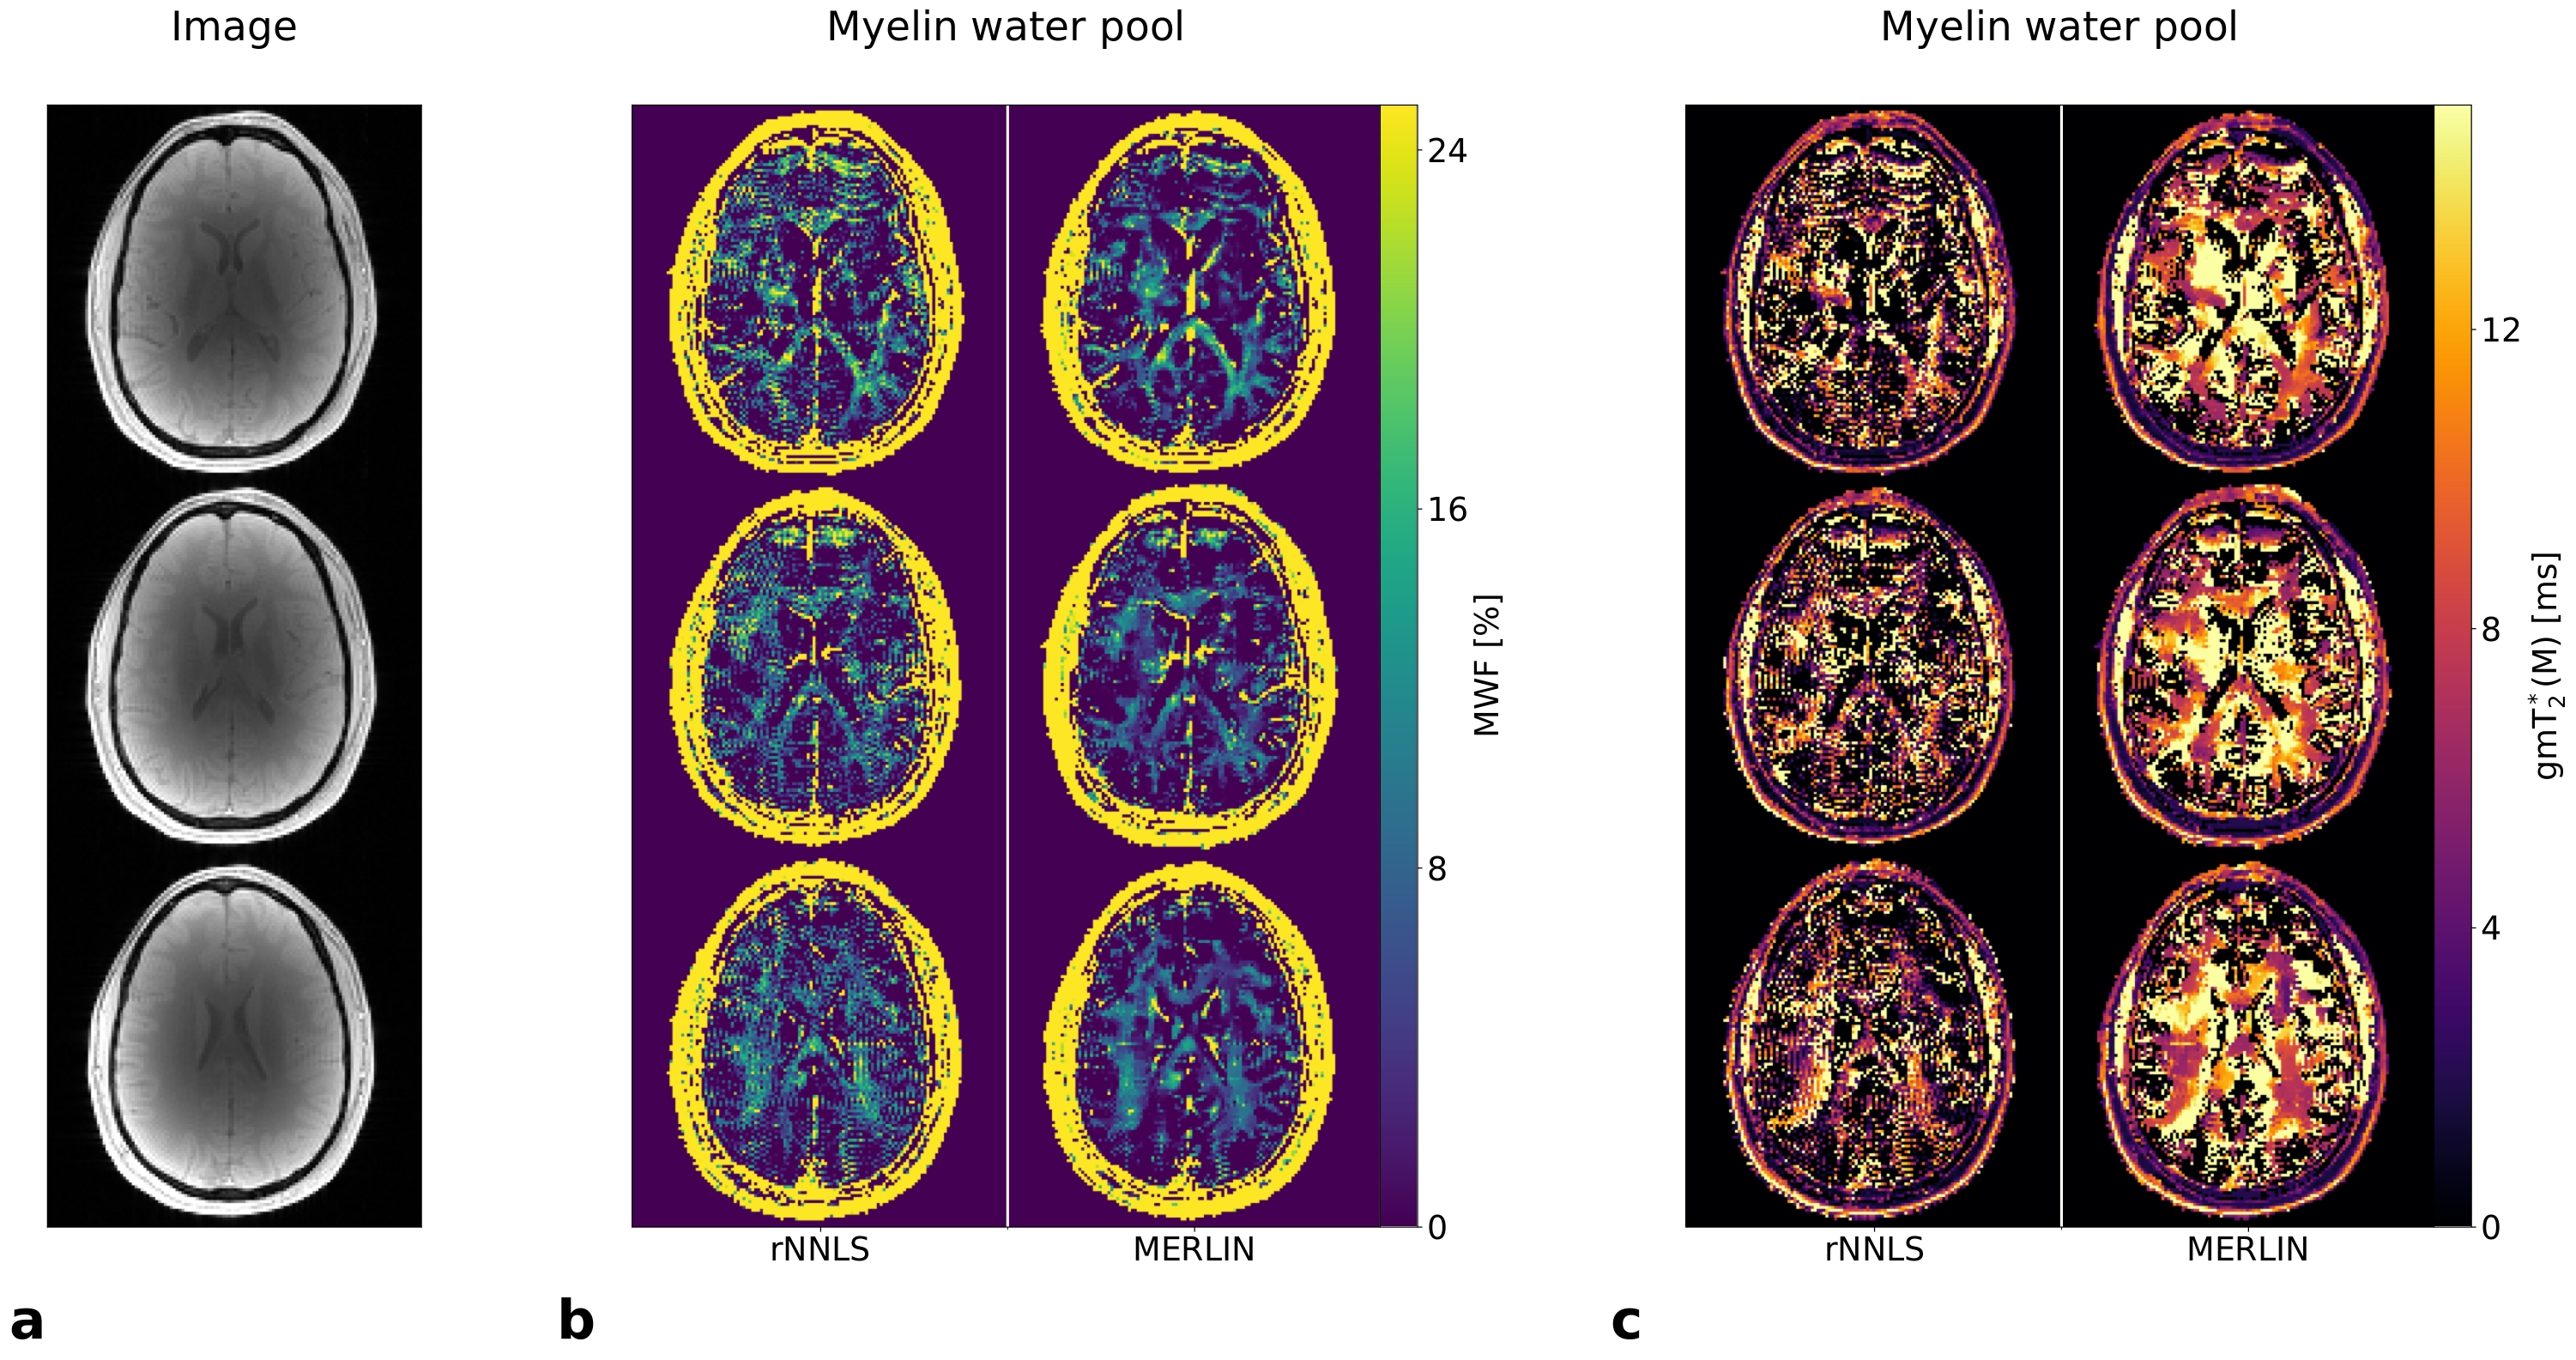
Fig. 4. In vivo results showing (a) the T2*-weighted images at the first echo time, (b) the myelin water fraction (MWF) and (c) the gmT2* for the myelin pool (M) for rNNLS and MERLIN for 3 different slices. The maps estimated by MERLIN appear less noisy and spatially more consistent.