4897
Improved estimates of the g-ratio by modelling its contribution to complex signal evolution in GRE data1CUBRIC, Cardiff University, Cardiff, United Kingdom, 2Seimens Healthcare Ltd., Camberley, United Kingdom
Synopsis
g-ratio is an important parameter of axon physiology and there is great interest in estimating it non-invasively in MRI. Existing approaches rely on fitting to a multi-compartment model and calculating g-ratio from the estimated volume fractions (Stikov et al, 2015). Here, we show that we can get improved estimates of the g-ratio by modelling its contribution to frequency offsets in GRE data using a hollow cylinder fibre model. Through simulations and model fitting to in vivo human GRE data we show g-ratio estimates are improved and closer to values obtained from histology compared with the existing approach.
Introduction
The g-ratio, (the ratio of the inner to outer axon diameter), is of considerable importance to axon physiology and as such, considerable efforts to image this property non-invasively, in vivo have been made. A simple approach1 computes the g-ratio from estimated axonal and myelin volume fractions (AVF / MVF, denoted Va / Vm):
$$g = \frac{1}{\sqrt{1+\frac{V_m}{V_a}}}$$
AVF and MVF estimates, can be obtained by modelling the contribution of myelin, axonal and extracellular compartments to MRI signals, in diffusion MRI2,3 or relaxometry.4 More recently, attempts to estimate volume fractions (and hence g-ratio) have been made by fitting to the complex gradient-recalled echo (GRE) signal evolution 5, 6:
$$S(t)=\rho V_me^{-t\left(\frac{1}{{T^*_2}_m}-i\omega_m\right)}+V_ae^{-t\left(\frac{1}{{T^*_2}_a}-i \omega_a\right)}+V_ee^{-t\left(\frac{1}{{T^*_2}_e}-i\omega_e\right)}$$
where V is the volume fraction of each compartment, T2∗ is the transverse relaxation time, ω is the angular frequency offset and t is echo time. The subscripts m,a,e denote the myelin, axonal and extracellular compartments, respectively. ρ is a myelin concentration parameter used to convert signal fractions to volume fractions. While this simple multi-compartment model (SMCM) with the Stikov approach has been used to estimate g-ratios, we can potentially obtain better results by fitting the signal to the hollow cylinder fibre model (HCFM), that explicitly includes the g-ratio as a parameter in the expressions for the frequency offsets.7,8
$$\frac{\omega_m}{\gamma B_0}=\frac{\chi_i}{2}\left(\frac{2}{3}-\sin^2{\theta}\right)+\frac{\chi_a}{2}\left( \frac{1}{4}-\left( \frac{3}{2} \left( \frac{g^2}{1-g^2} \right)\ln\left(\frac{1}{g}\right)\right)\sin^2{\theta}-\frac{1}{3}\right)+E$$
$$\label{omega_a}\frac{\omega_a}{\gamma B_0}=\frac{3 \chi_a}{4}\sin^2{\theta}\ln\left(\frac{1}{g}\right)$$
$$\label{omega_e}\frac{\omega_e}{\gamma B_0}=0$$
where χi and χa are the isotropic and anisotropic tissue susceptibilities, θ is the orientation of the fibers relative to the B0 field and E is an exchange parameter. In this model, the frequency offsets are no longer treated as independent parameters. With the geometric relationships between MVF, AVF, FVF and g (see Table 1), there are additional interdependencies between these parameters, making it a better conditioned model. The HFCM can be regarded as equivalent to the SMCM with constraints on the form of the frequency offsets. Here we compared using simulations and in vivo GRE data, g-ratios estimated using the SMCM and HCFM7,8.
Method
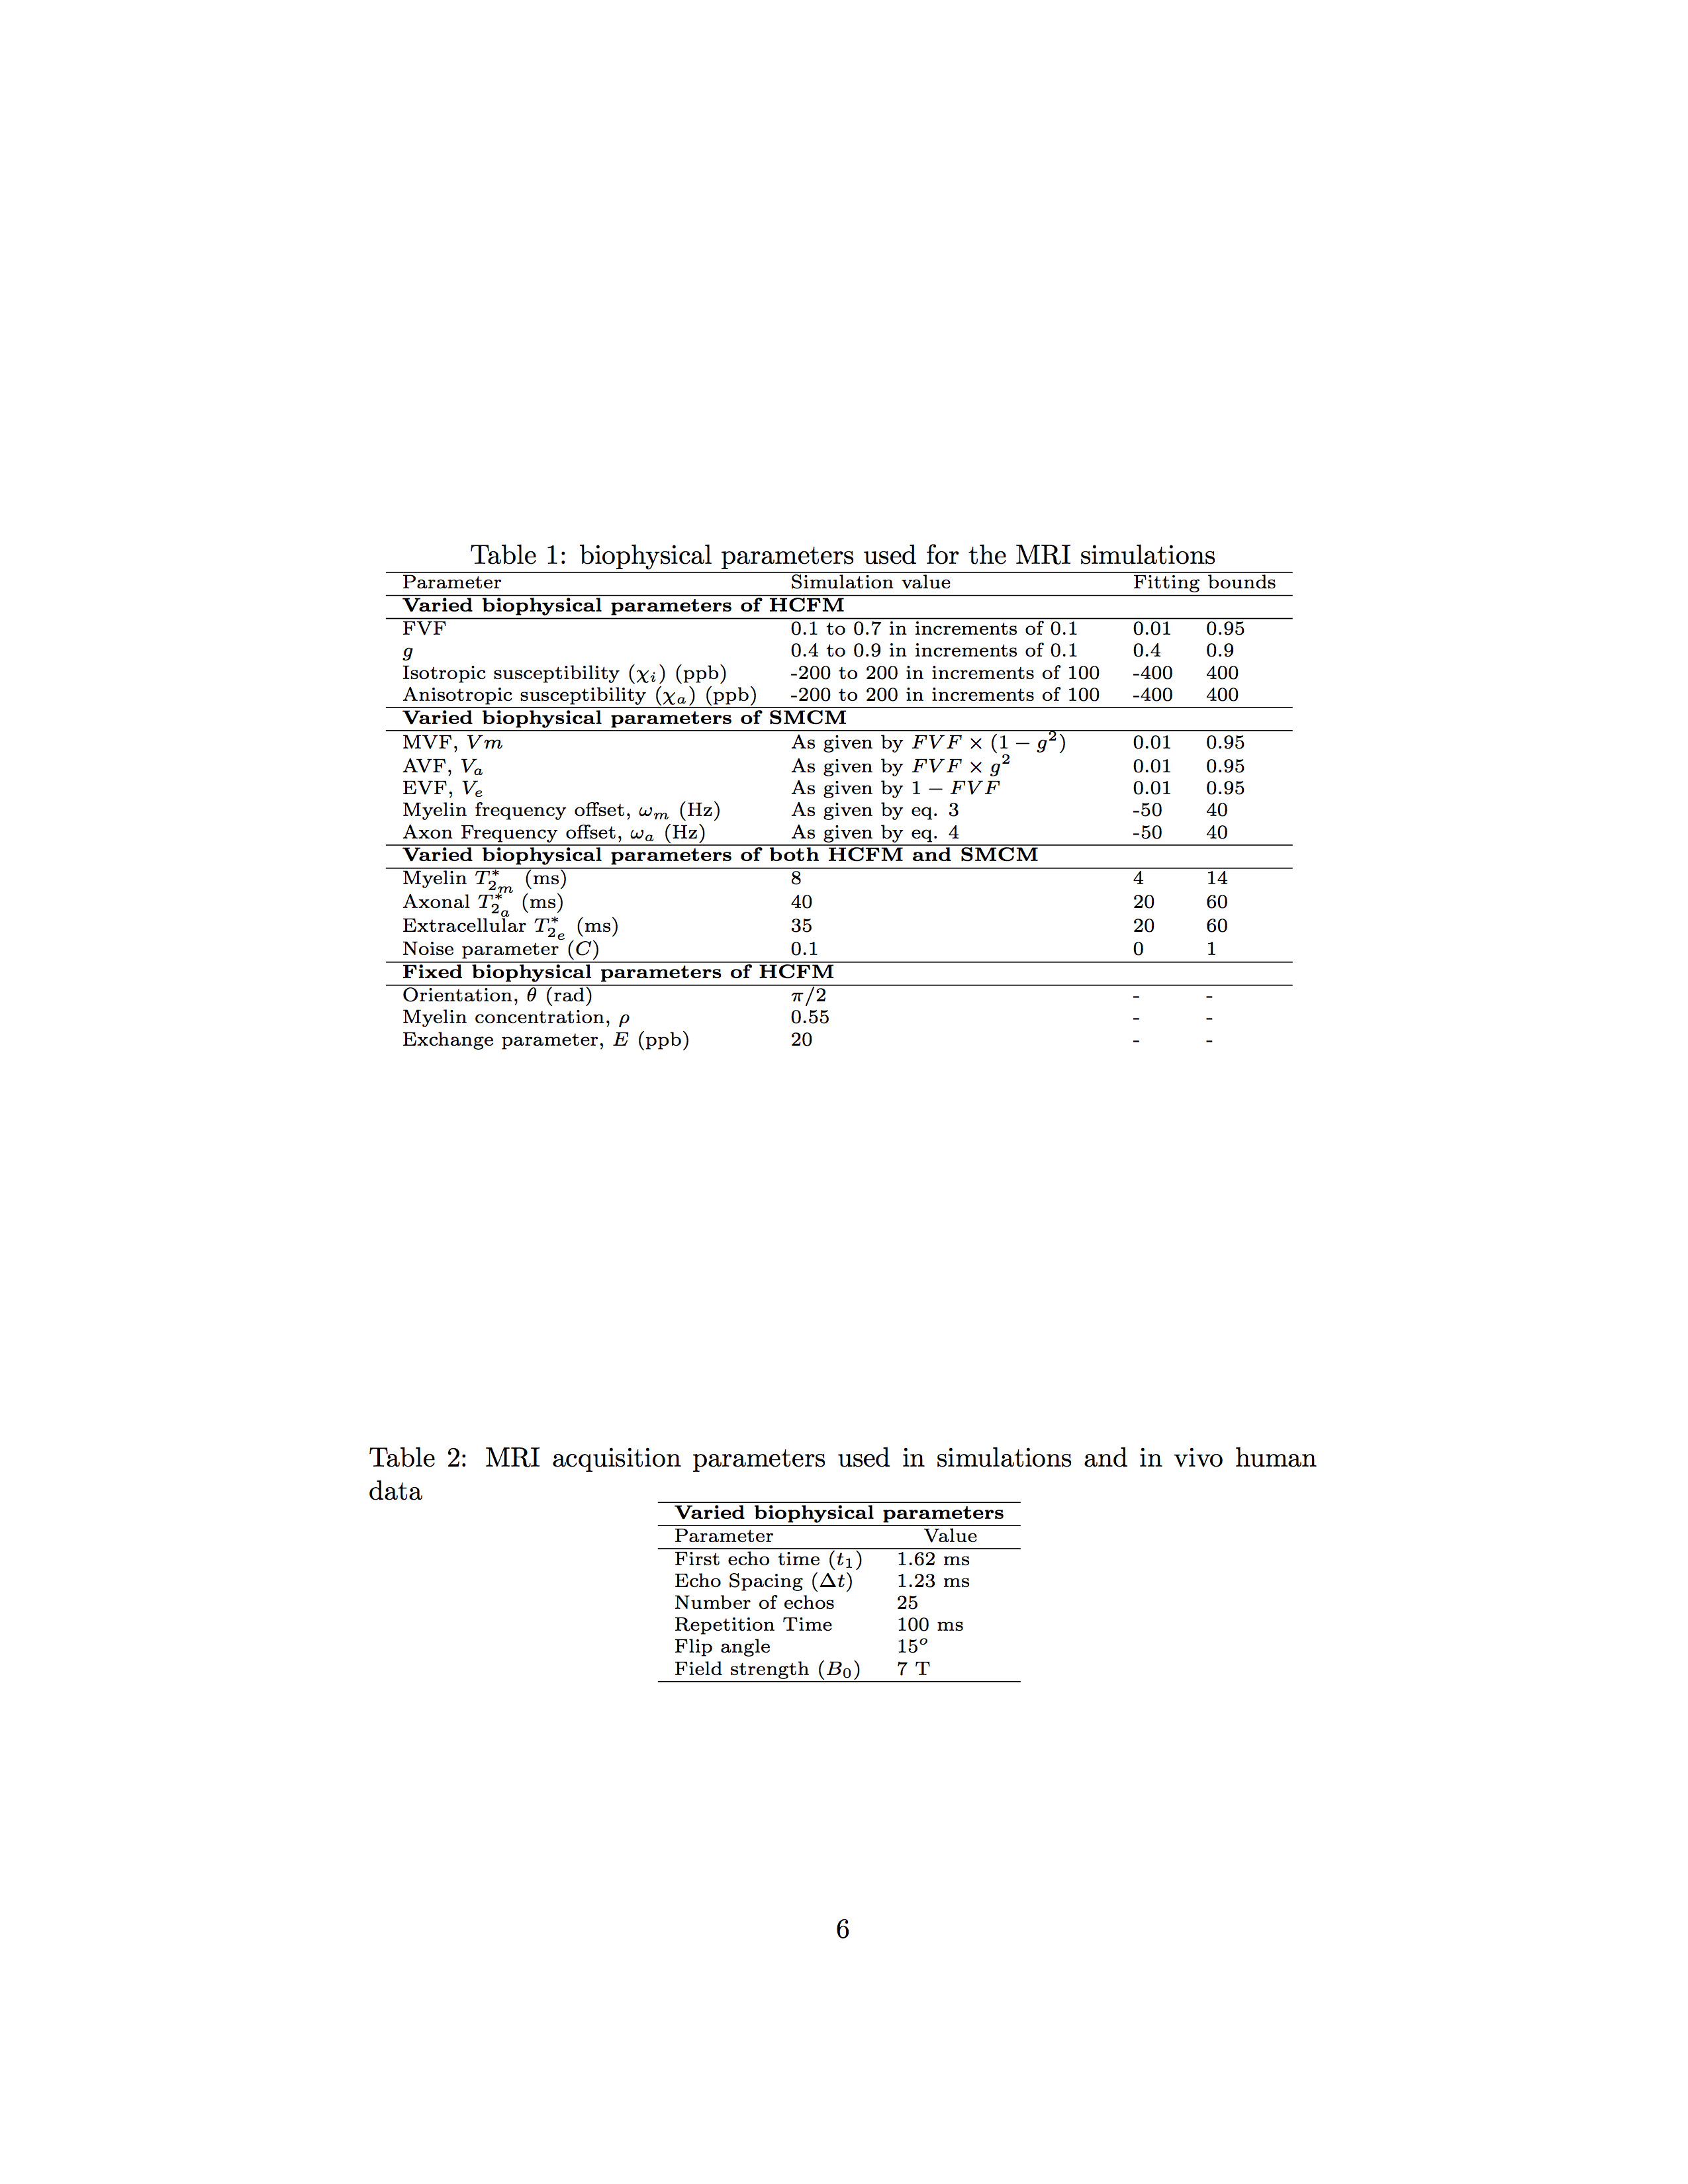
Complex-valued multi-echo GRE data were simulated in MATLAB using the HCFM with the parameters in Table 1 . FVF, g-ratio and susceptibility values were varied to test fitting across ranges given in Table 1, resulting in 875 parameter configurations. For each configuration, data with acquisition parameters matching those given in Table 2 were simulated. Both models (SMCM and HCFM) were fitted using particle swarm optimisation9 (to avoid local minima) using bounds given in Table 1. For HCFM, θ, ρ and E were assumed to be constant. Relative errors of all parameter fits were then computed. Human data acquisition was performed on a single participant (F, 29y) on a Siemens 7T research-only scanner equipped with a 32-channel head receive/volume transmit coil (Siemens Healthcare, Erlangen, Germany) on a single mid-saggital slice. Image phase data were reconstructed from the raw k-space data using ASPIRE10 and combined with the amplitude data to generate complex-valued images. Background field effects were removed by normalising each complex-valued image as follows:11
$$S'(t_i)=\frac{S(t_i)}{S(t_1)} \quad S''_i(t)=\frac{S'(t_i)}{S'(t_2)^{i-1}}$$
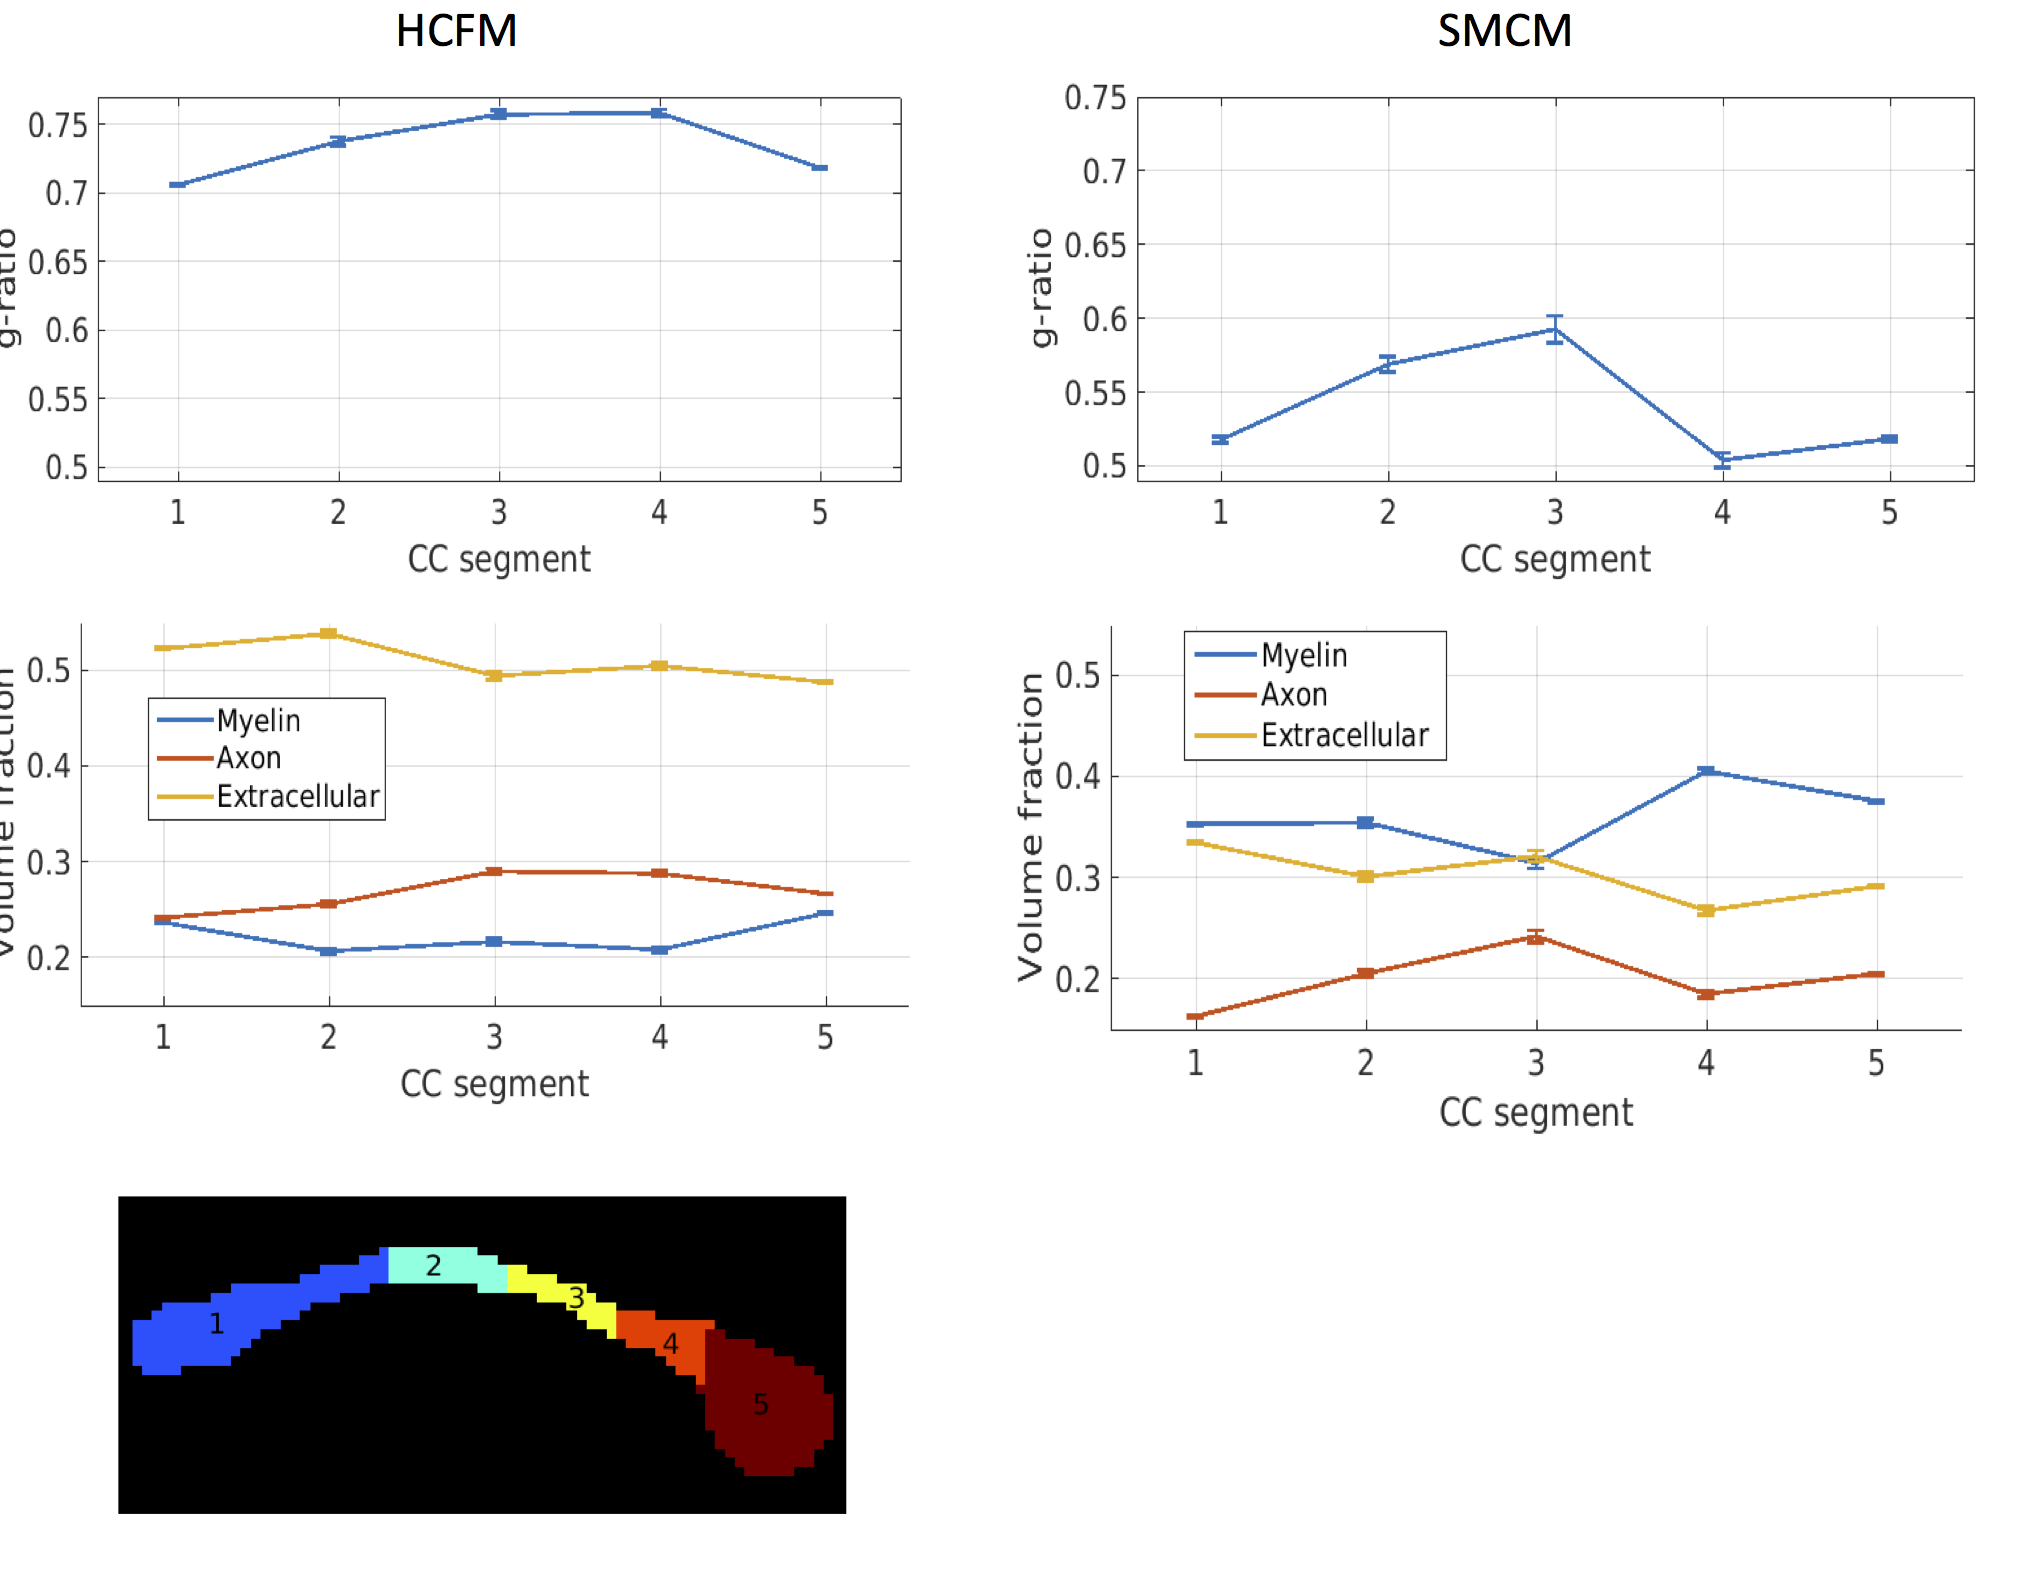
The normalised data were then fitted to the HCFM and SMCM. g-ratios were computed for the SMCM using eq. 1. For the HCFM, the fibre orientation was assumed to be perpendicular to B0 (θ = π/2). The corpus callosum. (CC) was manually segmented according to the Witelson scheme12 and fitted parameters averaged within each segment.
Results
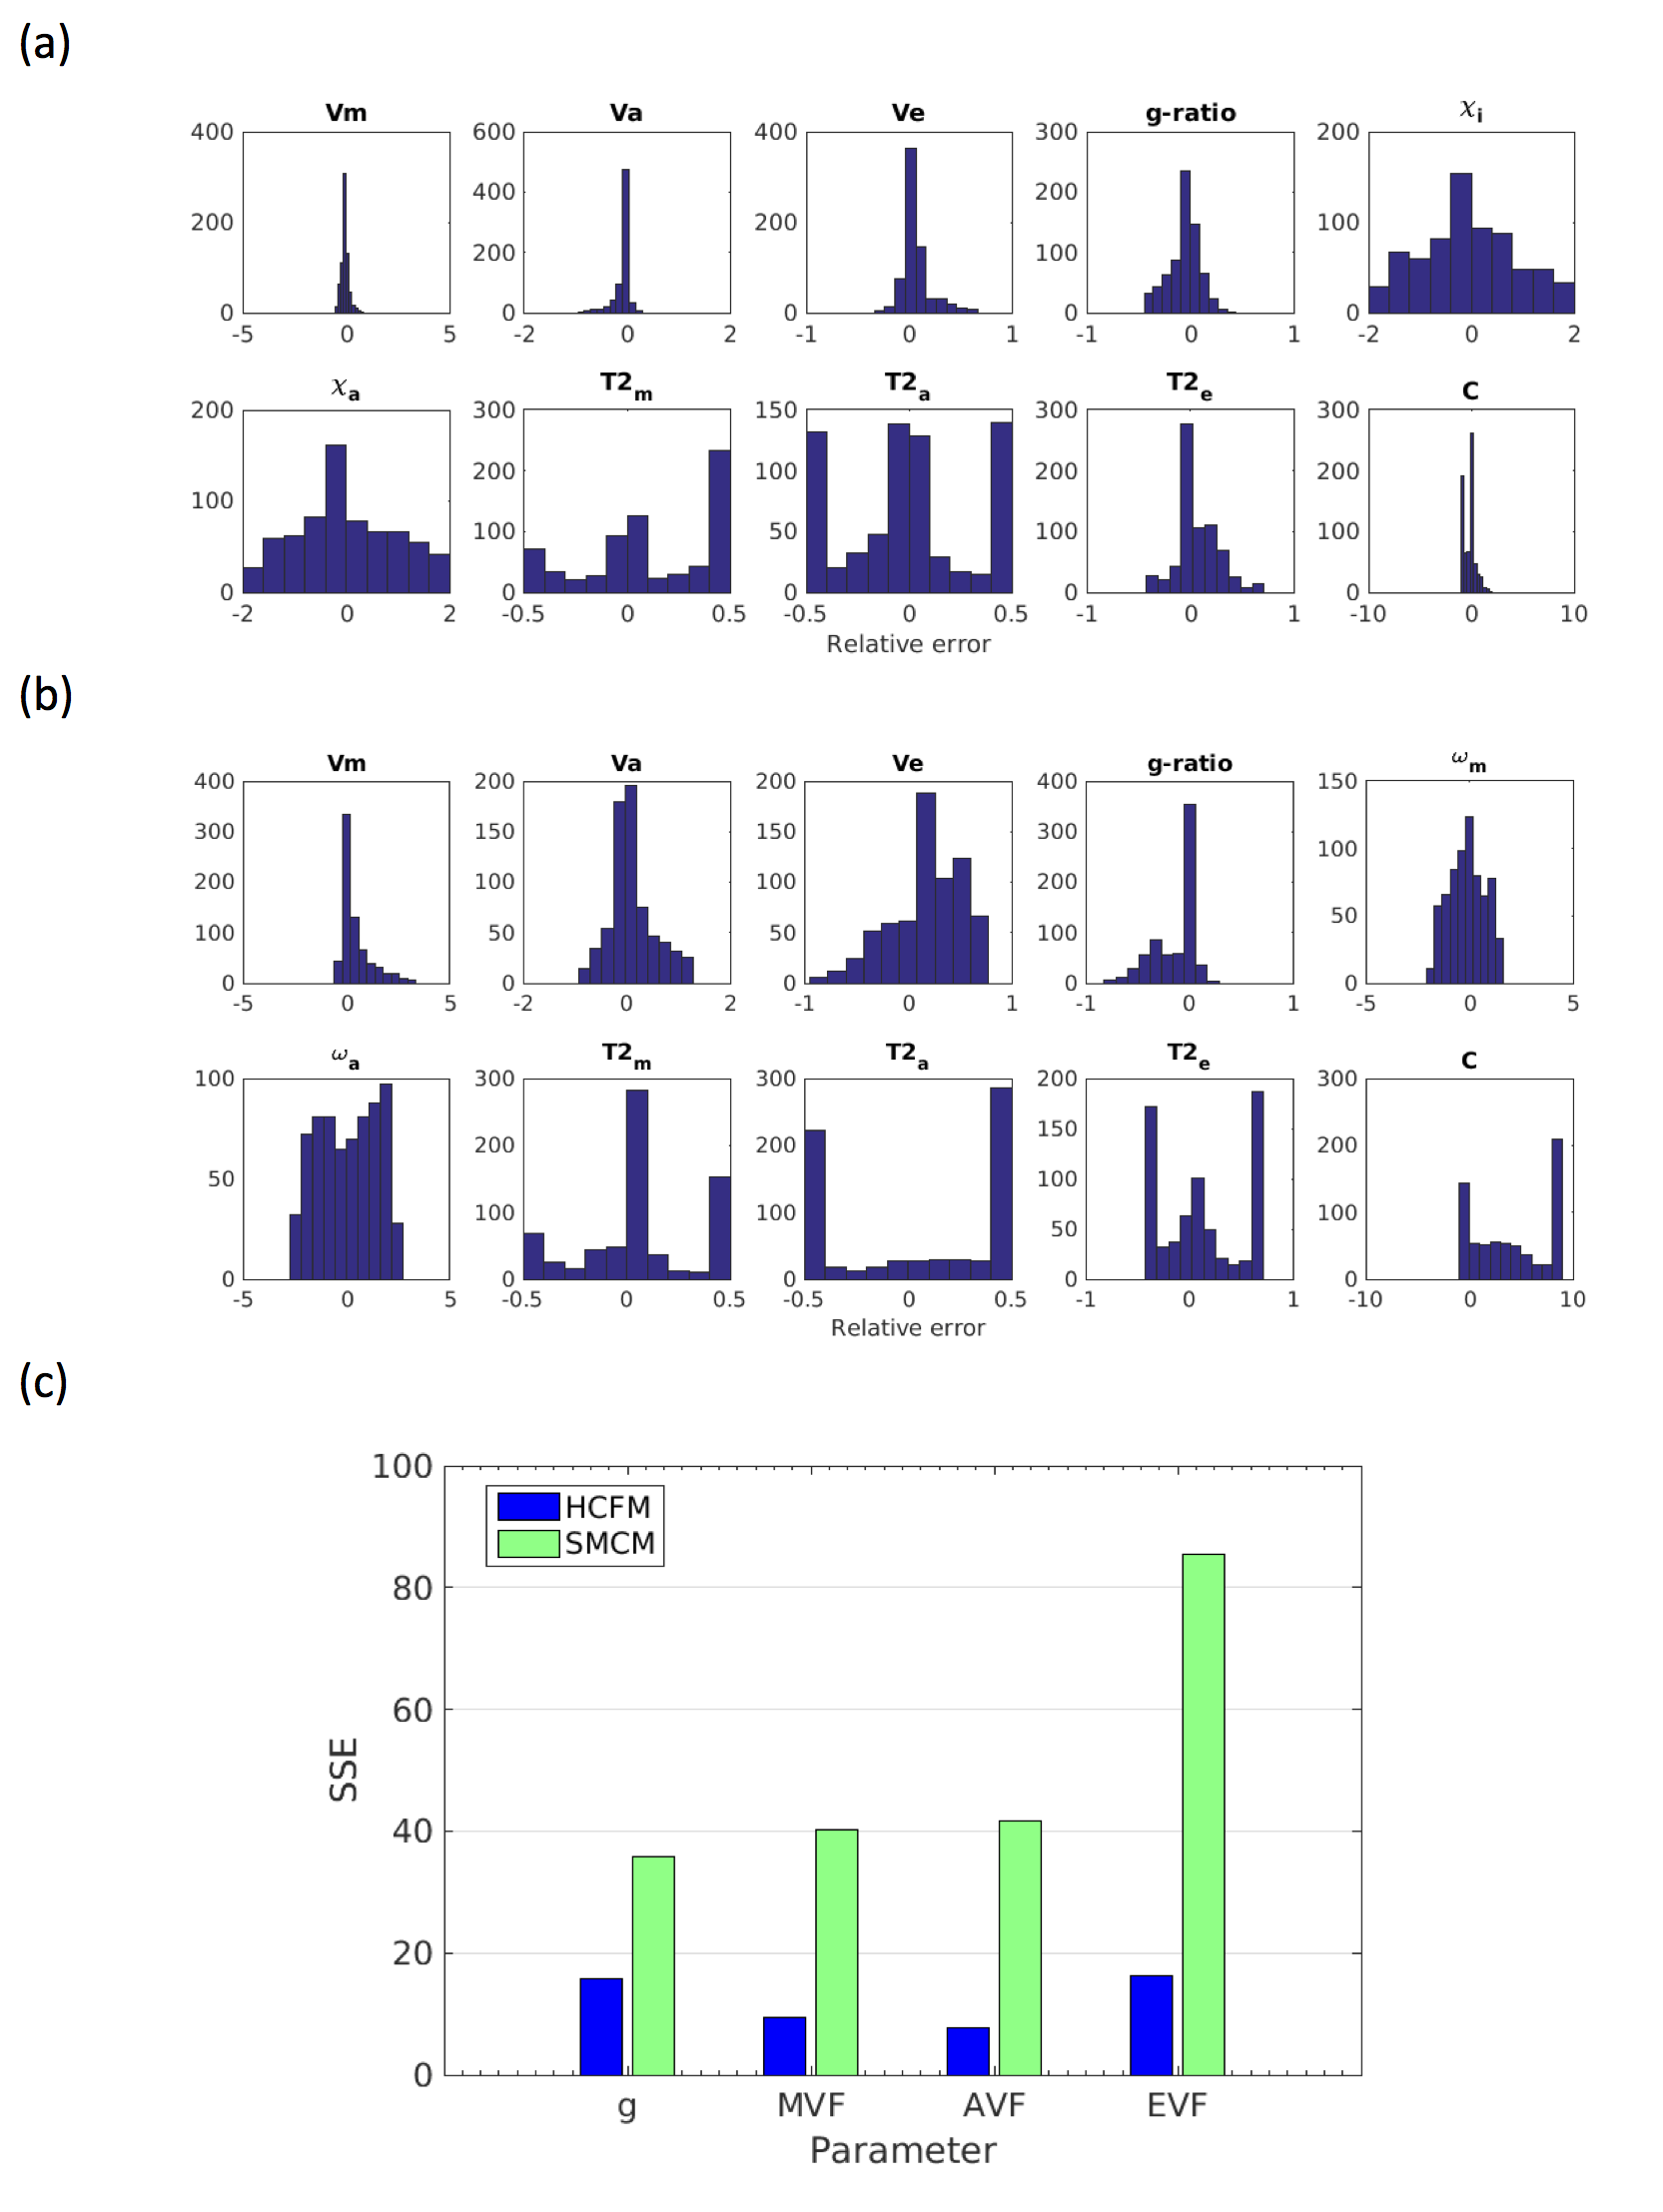
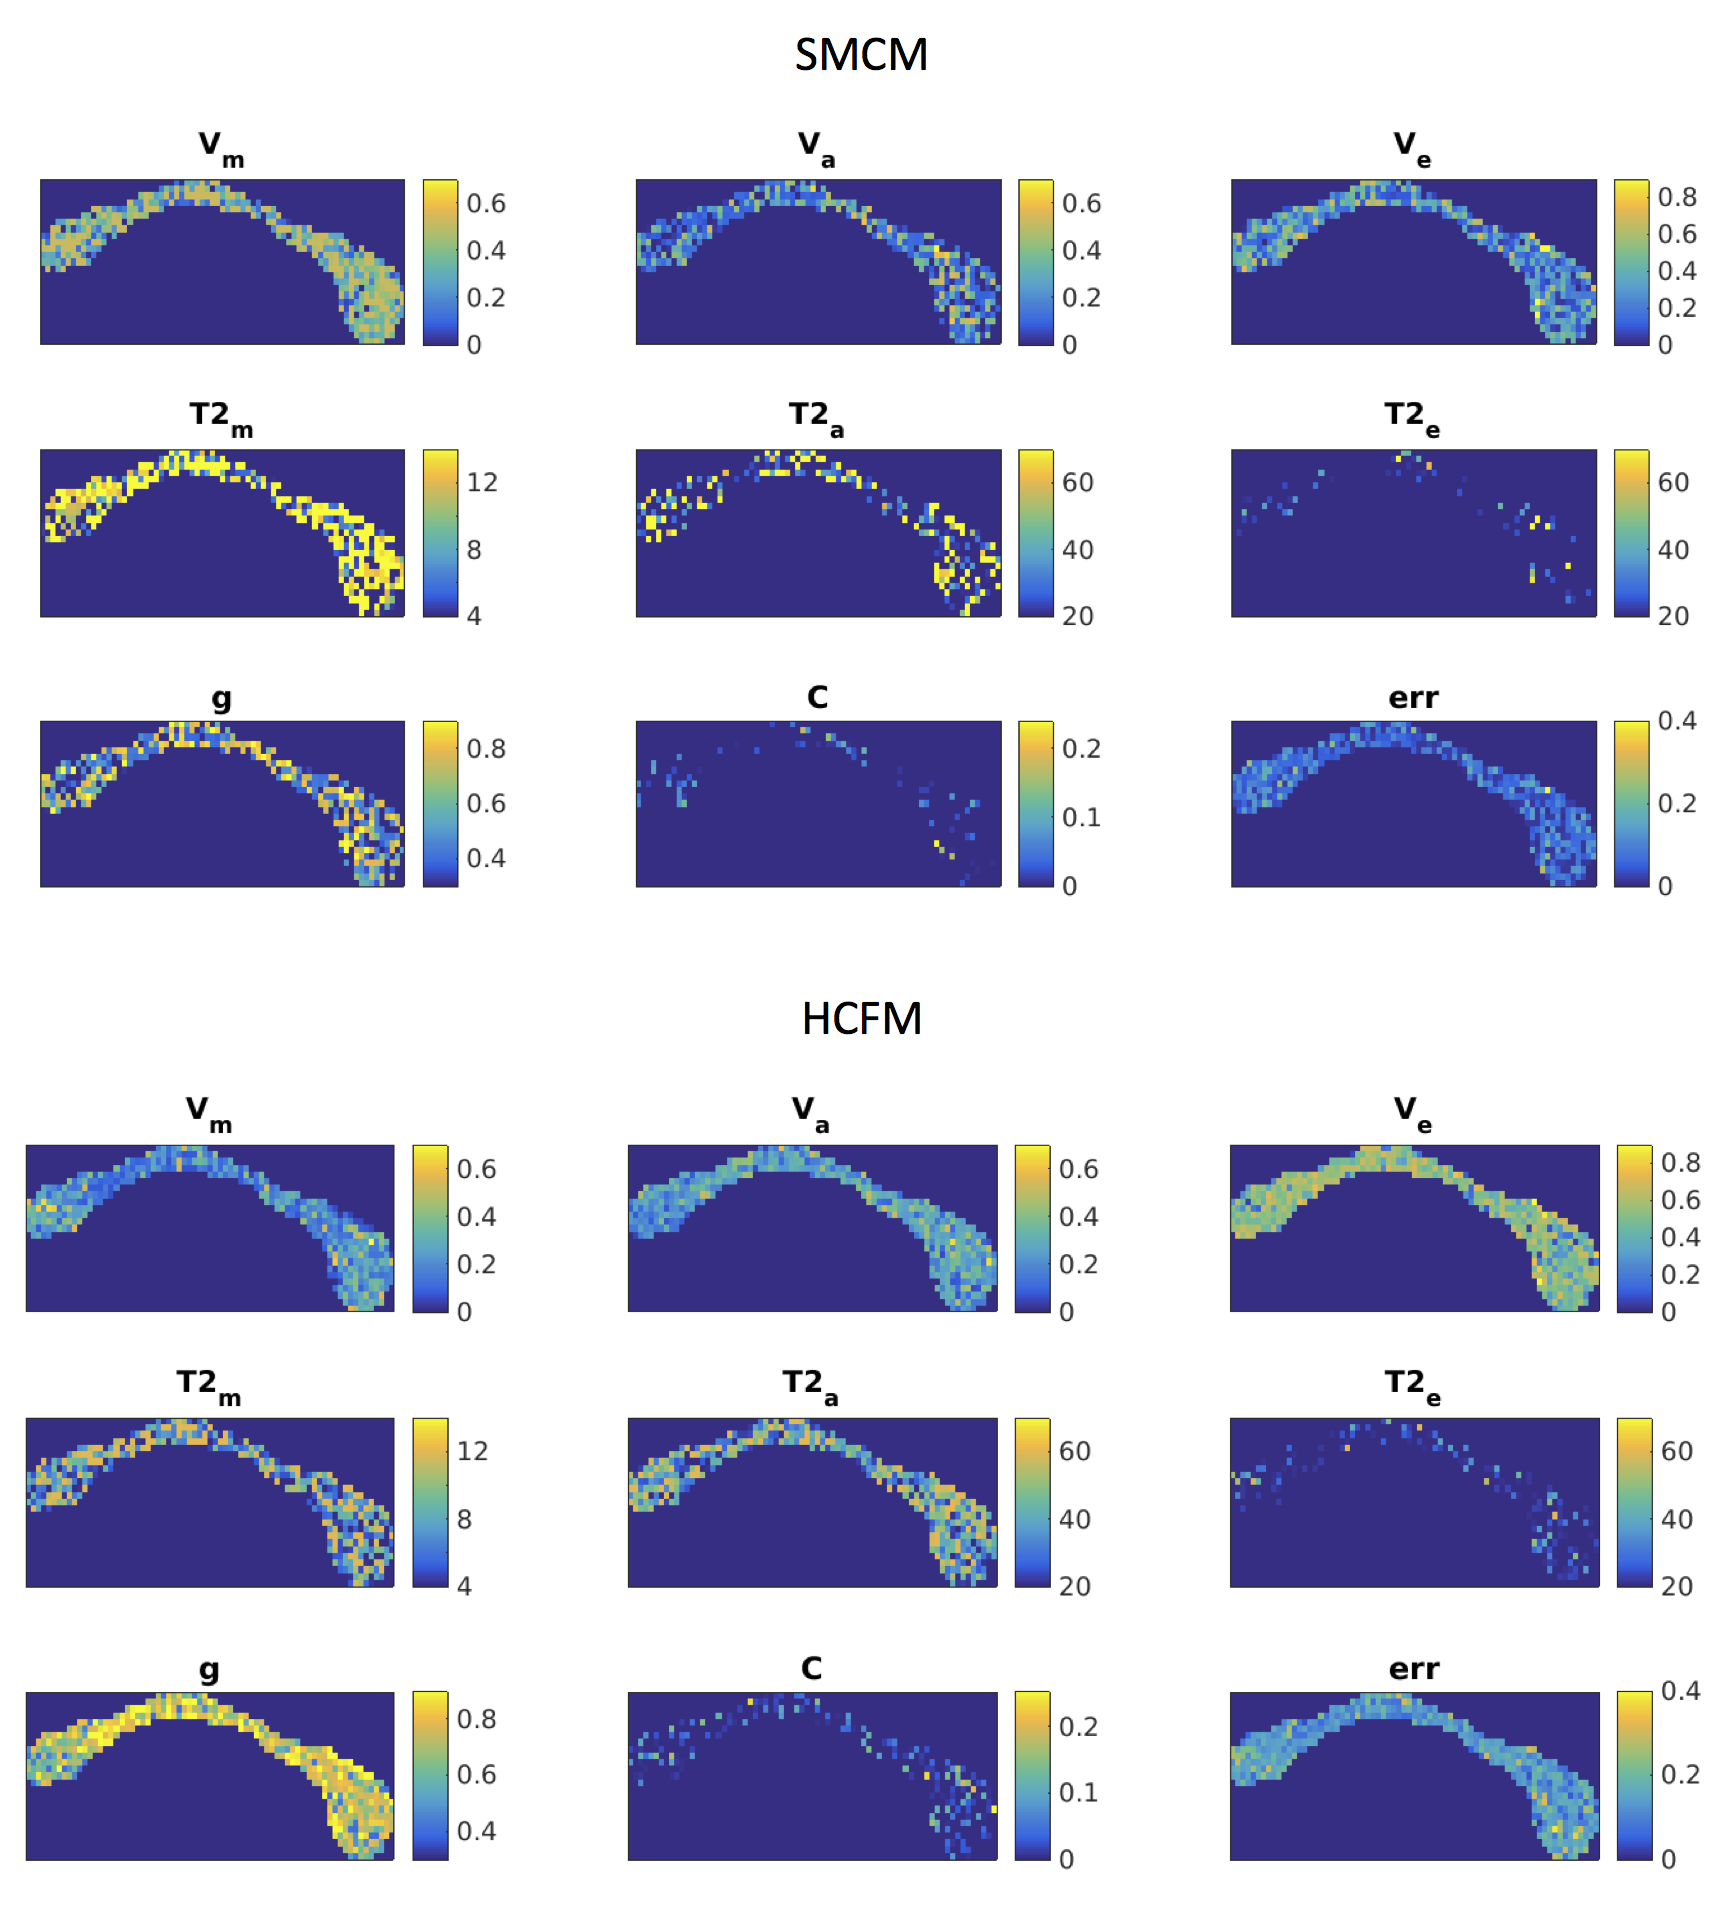
Relative errors of fitting for the two models are shown in Figure 1. SSE for g-ratio fits using the HCFM are noticeably lower than for SMCM (5.8 vs. 35.8). Volume fractions overall show less error with HCFM compared to SMCM, Errors in estimates of frequency offset, susceptibility and T2* are highly variable, often hitting the fitting bounds, although this is less apparent for HCFM compared to SMCM. Model fits to human GRE data are shown in Figures 2-3. The HCFM shows g-ratio fits in the range of 0.7-0.76, consistent with histological data.13 g-ratios also show lower values in the genu and splenium. Estimated volume fractions are also close to the values expected from histology, with lower values in the genu and splenium than the body. Estimates of g-ratio and volume fractions from SMCM are more variable and less consistent with histology.Conclusion
We show that in vivo human g-ratio maps estimated from the HCFM are in good agreement with values in the histological literature. Further improvements could be made by constraining the total susceptibility to values from an independent quantitative susceptibility map. Diffusion MRI could also provide independent orientation information so θ does not have to be assumed. Overall, the HCFM provides an improved estimation of g-ratios in both simulated an in vivo data.Acknowledgements
This work was funded by the Wellcome Trust (grant number WT104943). We thank Siemens for their contribution to implementing the GRE sequence used.References
1 N. Stikov, J. S. Campbell, T. Stroh, M. Lavel ́ee, S. Frey, J. Novek, S. Nuara, M.-K. K. Ho, B. J. Bedell, R. F. Dougherty, I. R. Leppert, M. Boudreau, S. Narayanan, T. Duval, J. Cohen-Adad, P.-A. A. Picard, A. Gasecka, D. Côté, and G. B. Pike, “In vivo histology of the myelin g-ratio with magnetic resonance imaging,” NeuroImage, vol. 118, pp. 397–405, sep 2015.
2 Y. Assaf and P. J. Basser, “Composite hindered and restricted model of diffusion (CHARMED) MR imaging of the human brain.,” NeuroImage, vol. 27, pp. 48–58, aug 2005.
3 H. Zhang, T. Schneider, C. a. Wheeler-Kingshott, and D. C. Alexander, “NODDI: practical in vivo neurite orientation dispersion and density imaging of the human brain.,” NeuroImage, vol. 61, pp. 1000–16, jul 2012.
4 S. C. L. Deoni, B. K. Rutt, T. Arun, C. Pierpaoli, and D. K. Jones, “Gleaning multicomponent T1 and T2 information from steady-state imaging data.,” Magnetic Resonance in Medicine, vol. 60, pp. 1372–87, dec 2008.
5 K. Thapaliya, V. Vegh, S. Bollmann, and M. Barth, “Assessment of microstructural signal compartments across the corpus callosum using multi- echo gradient recalled echo at 7 T,” NeuroImage, no. September, pp. 1–10, 2017.
6 Y. Nam, J. Lee, D. Hwang, and D. H. Kim, “Improved estimation of myelin water fraction using complex model fitting,” NeuroImage, vol. 116, pp. 214– 221, 2015.
7 S. Wharton and R. Bowtell, “Fiber orientation-dependent white matter contrast in gradient echo MRI,” Proceedings of the National Academy of Sciences, vol. 2012, no. 31, p. 2807, 2012.
8 S. Wharton and R. Bowtell, “Gradient echo based fiber orientation mapping using R2* and frequency difference measurements,” NeuroImage, vol. 83, pp. 1011–1023, 2013.
9 J. Kennedy and R. Eberhart, “Particle swarm optimization,” Neural Networks, 1995. Proceedings., IEEE International Conference on, 1995.
10 K. Eckstein, B. Dymerska, B. Bachrata, W. Bogner, K. Poljanc, S. Trattnig, and S. D. Robinson, “Computationally Efficient Combination of Multi- channel Phase Data From Multi-echo Acquisitions (ASPIRE),” Magnetic Resonance in Medicine, vol. 79, pp. 2996–3006, jun 2018.
11 B. Tendler and R. Bowtell, “Using frequency difference mapping to assess white matter microstructure in the human corpus callosum,” in Proceedings of the International Society for Magnetic Resonance in Medicine, (Singapore), p. 2985, 2016.
12 S. F. Witelson, “Hand and sex differences in the isthmus and genu of the human corpus callosum: A postmortem morphological study,” Brain, 1989.
13 N. Stikov, J. S. W. Campbell, T. Stroh, M. Lavelée, S. Frey, J. Novek, S. Nuara, M. K. Ho, B. J. Bedell, R. F. Dougherty, I. R. Leppert, M. Boudreau, S. Narayanan, T. Duval, J. Cohen-Adad, P. A. Picard, A. Gasecka, D. Côoée and G. B. Pike, “Quantitative analysis of the myelin g-ratio from electron microscopy images of the macaque corpus callosum,” Data in Brief, vol. 4, pp. 368–373, 2015.
Figures