4890
Proving b1000 DWI has performance advantage to classify low and high risk Gleason groups by using Neural Network classifier1Department of Radiology, Chinese PLA General Hospital, Beijing, China, 2Tsinghua University, Beijing, China, 3Xidian University, Xi'an, China
Synopsis
The Gleason grading of histological samples is recommended for the assessment of prostate cancer risk. Assessing Gleason grade correctly can improve patient prognosis and implement early diagnosis. The aim of this work was to prove that b1000 DWI has the best effect on Gleason high-risk and low-risk grading in T2WI and DWIs with b=1000,b=2000, and b=3000. We use NN (Neural Network) with Ensemble Method on each sequence. The AUC of b1000 DWI was 0.8734, which is significantly higher than those observed for other DWIs.
Introduction
Prostate cancer (PCa) is the most common malignancy and second leading cause for death for men of western countries. Magnetic resonance imaging (MRI) has been subsequently employed in clinical settings to diagnosis PCa non-invasively. Recently, growing evidence indicates that Computer-aided diagnosis (CAD) systems of PCa through MRI can provide valuable information for radiologists in making diagnostic decisions Radiologists have different opinions on T2 and DWIs’ diagnostic efficiency in grading prostate cancer [1]. Currently, CAD is mainly used to diagnose PCa’s existence [2], but PCa is a kind of slow-developing cancer, so the prediction of early prostate cancer risk is of greater importance. This study aims to use multiple machine learning methods to validate the PCa diagnostic performance of T2WIs and DWIs by comparing the diagnosis results with Gleason grades from the biopsy.Method
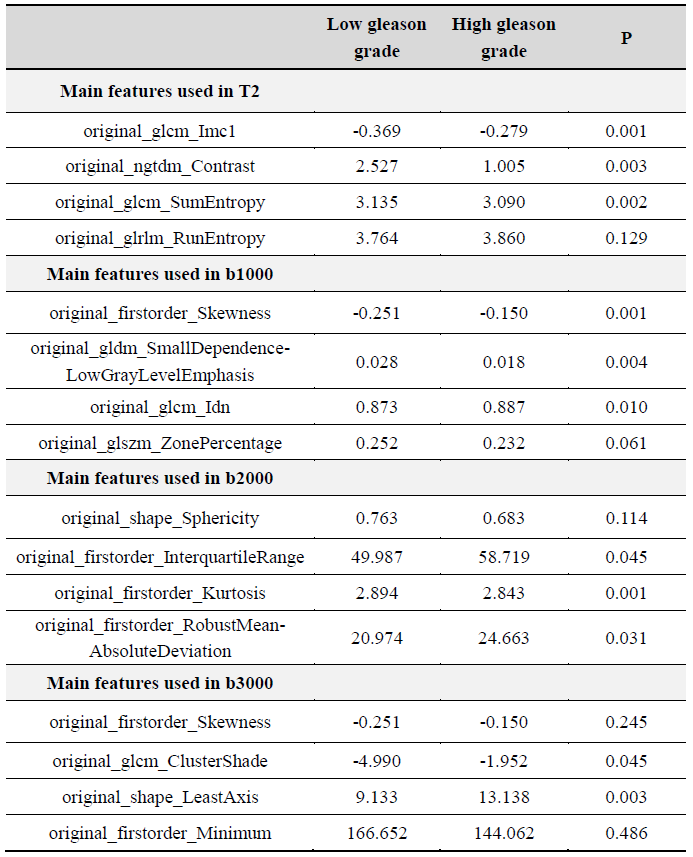
a. Dataset The study was approved by the Chinese PLA General Hospital review board. 316 patients underwent MP-MRI on a 3-T MRI system (Discovery 750, GE Healthcare, Milwaukee, WI, USA). MRI scan sequences included diffusion-weighted imaging (DWI) with three b-values(b=1000,2000,3000) and T2-weighted images (T2WI). The Patient characteristics is shown in Figure 1. 316 unique lesions were identified by performing biopsies. Whole-mount tissue samples were hematoxylin and eosin stained, digitized, and sent to a urological pathologist for annotation using the Gleason grades [3]. Tumor aggressiveness was dichotomized to distinguish between low and high aggressiveness as Figure 2. b. Algorithm Firstly, the outlines of the prostate were gained by manual segment and were saved as image masks. Secondly, DWIs and T2WI were registered with Single- vs Multi-modality transform. Then, the pixels inside the prostate was processed with intensity normalization by histogram equalization-based image enhancement. We use NN (Neural Network) with Bagging strategy on each sequence for classification. 250 PCa cases were separated from 316 cases as the train set, and the remaining 66 cases were used as the test set. 106 radiomic features were extracted respectively using Pyradiomics packages (http://pyradiomics.readthedocs.io) on different MRI modalities [4]. Then dimensions were reduced through the PCA algorithm, leaving the most important 27-dimensional features. Figure 3 shows the average values and p-values of the most important 5-dimensional features among 27. 101 classifiers were trained by iterating 1000 four-layer neural networks. Using the bagging strategy, 101 weak classifiers are integrated into one strong classifier, and 101 weak classifiers vote together. If there are more than 50 classifiers voting A value of 1, the final prediction is 1, otherwise the prediction is 0.Results
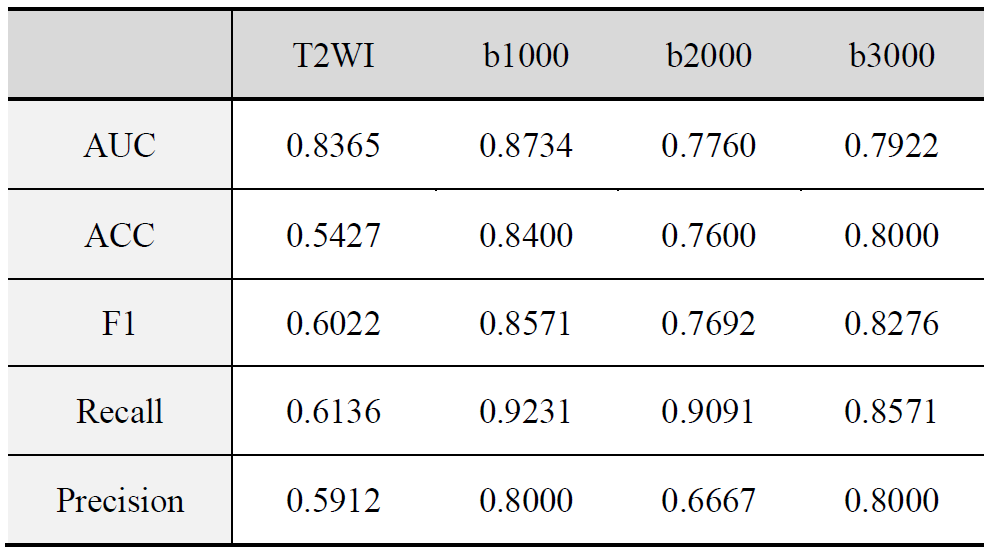
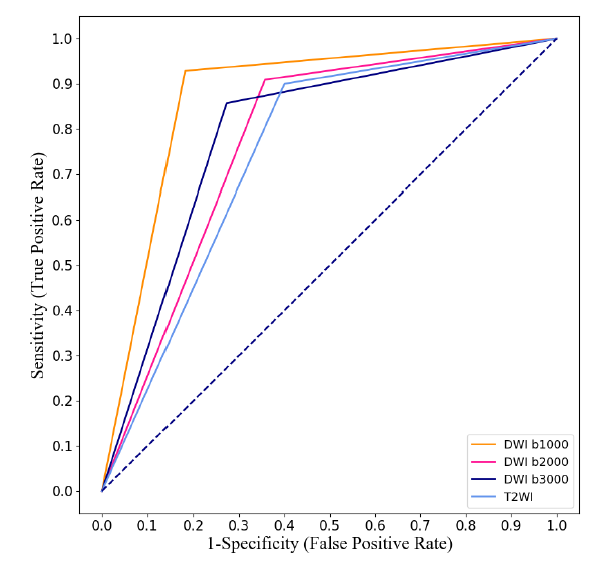
The Figure 4 summarizes the accuracy, recall, F1-score, precision for each DWI and T2WI respectfully. The ROC curves of each modality are displayed in Figure 5. The AUC for b1000 DWI was 0.8734. According to Figure 4 and 5, the diagnose performance of b1000 DWI was significantly higher than those observed for DWIs (AUC=0.7760 with b2000 DWI and AUC=0.7922 with b3000 DWI) and T2WI (AUC=0.8365). It can be concluded that b1000 DWI is the dominating and reliable MRI modality for PCa Gleason grading.Discussion
In this study, we proposed a method for the classification of high and low Gleason grade using a 4-layer neural network and integrated learning strategies. We compared the diagnose efficiency of T2WIs and multi b-value DWIs in diagnose the risk of PCa, in which indicates that CAD relies on b1000 can improve PCa patient outcomes potentially.Acknowledgements
No acknowledgement found.References
1. Peng, Yahui, et al. "Quantitative analysis of multiparametric prostate MR images: differentiation between prostate cancer and normal tissue and correlation with Gleason score—a computer-aided diagnosis development study." Radiology 267.3 (2013): 787-796.
2. Wang S, Burtt K, Turkbey B, et al. Computer aided-diagnosis of prostate cancer on multiparametric MRI: a technical review of current research[J]. BioMed research international, 2014, 2014.
3. Gleason, Donald F. "Histologic grading of prostate cancer: a perspective." Human pathology 23.3 (1992): 273-279.
4. Bonekamp, David, et al. "Radiomic machine learning for characterization of prostate lesions with MRI: comparison to ADC values." Radiology 289.1 (2018): 128-137.
Figures
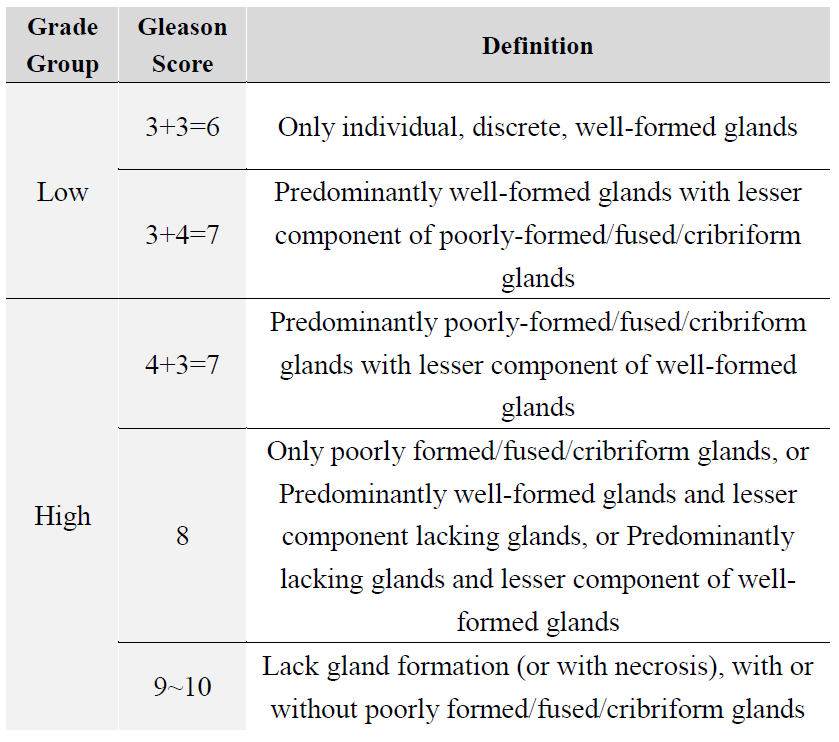
Figure 1: Evaluation of each patient’s prostate biopsy according to the Gleason grading system
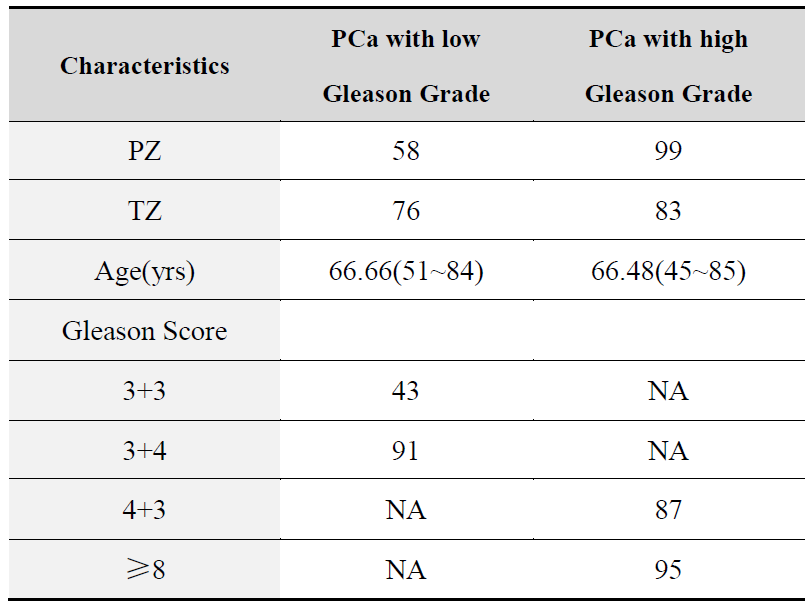
Figure 2: Patient characteristics
Key: NA-not applicable; PZ-peripheral zone; TZ-transition zone