4884
Structural- and Functional-Connectivity Convolution Neural Networks (SCFCnn) for Integrated Brain-Behavior Prediction in the HCP dataset1Center for Advanced Imaging Innovation and Research (CAI2R), NYU School of Medicine, New York, NY, United States, 2Center for Biomedical Imaging, Department of Radiology, NYU School of Medicine, New York, NY, United States
Synopsis
In this work, we investigate an efficient structural (SC)- and functional (FC)-connectivity convolution neural network (SCFCnn) architecture applied on both FC and SC to detect the links between individual non-imaging language traits and
Purpose
In recent years, neural networks and deep learning have become a game changer in many fields, especially so in medical imaging. In neuroscience, language is a central construct in cognitive function because it involves mechanisms of reading and speaking that underpin most complex cognitive behaviors. However, previous work only focuses on functional connectivity (FC) [1] and does not fully explore structural connectivity (SC) nor deep learning. In this work, we introduce an efficient structural- and functional-connectivity convolution neural network (SCFCnn) architecture, applied on SC and/or FC to detect the links between individual non-imaging language traits and invivo MRI measurements in the Human Connectome Project (HCP) s900 dataset. The identified structure-function relationships can be used to infer neurocognitive measures from neuroimaging.Methods
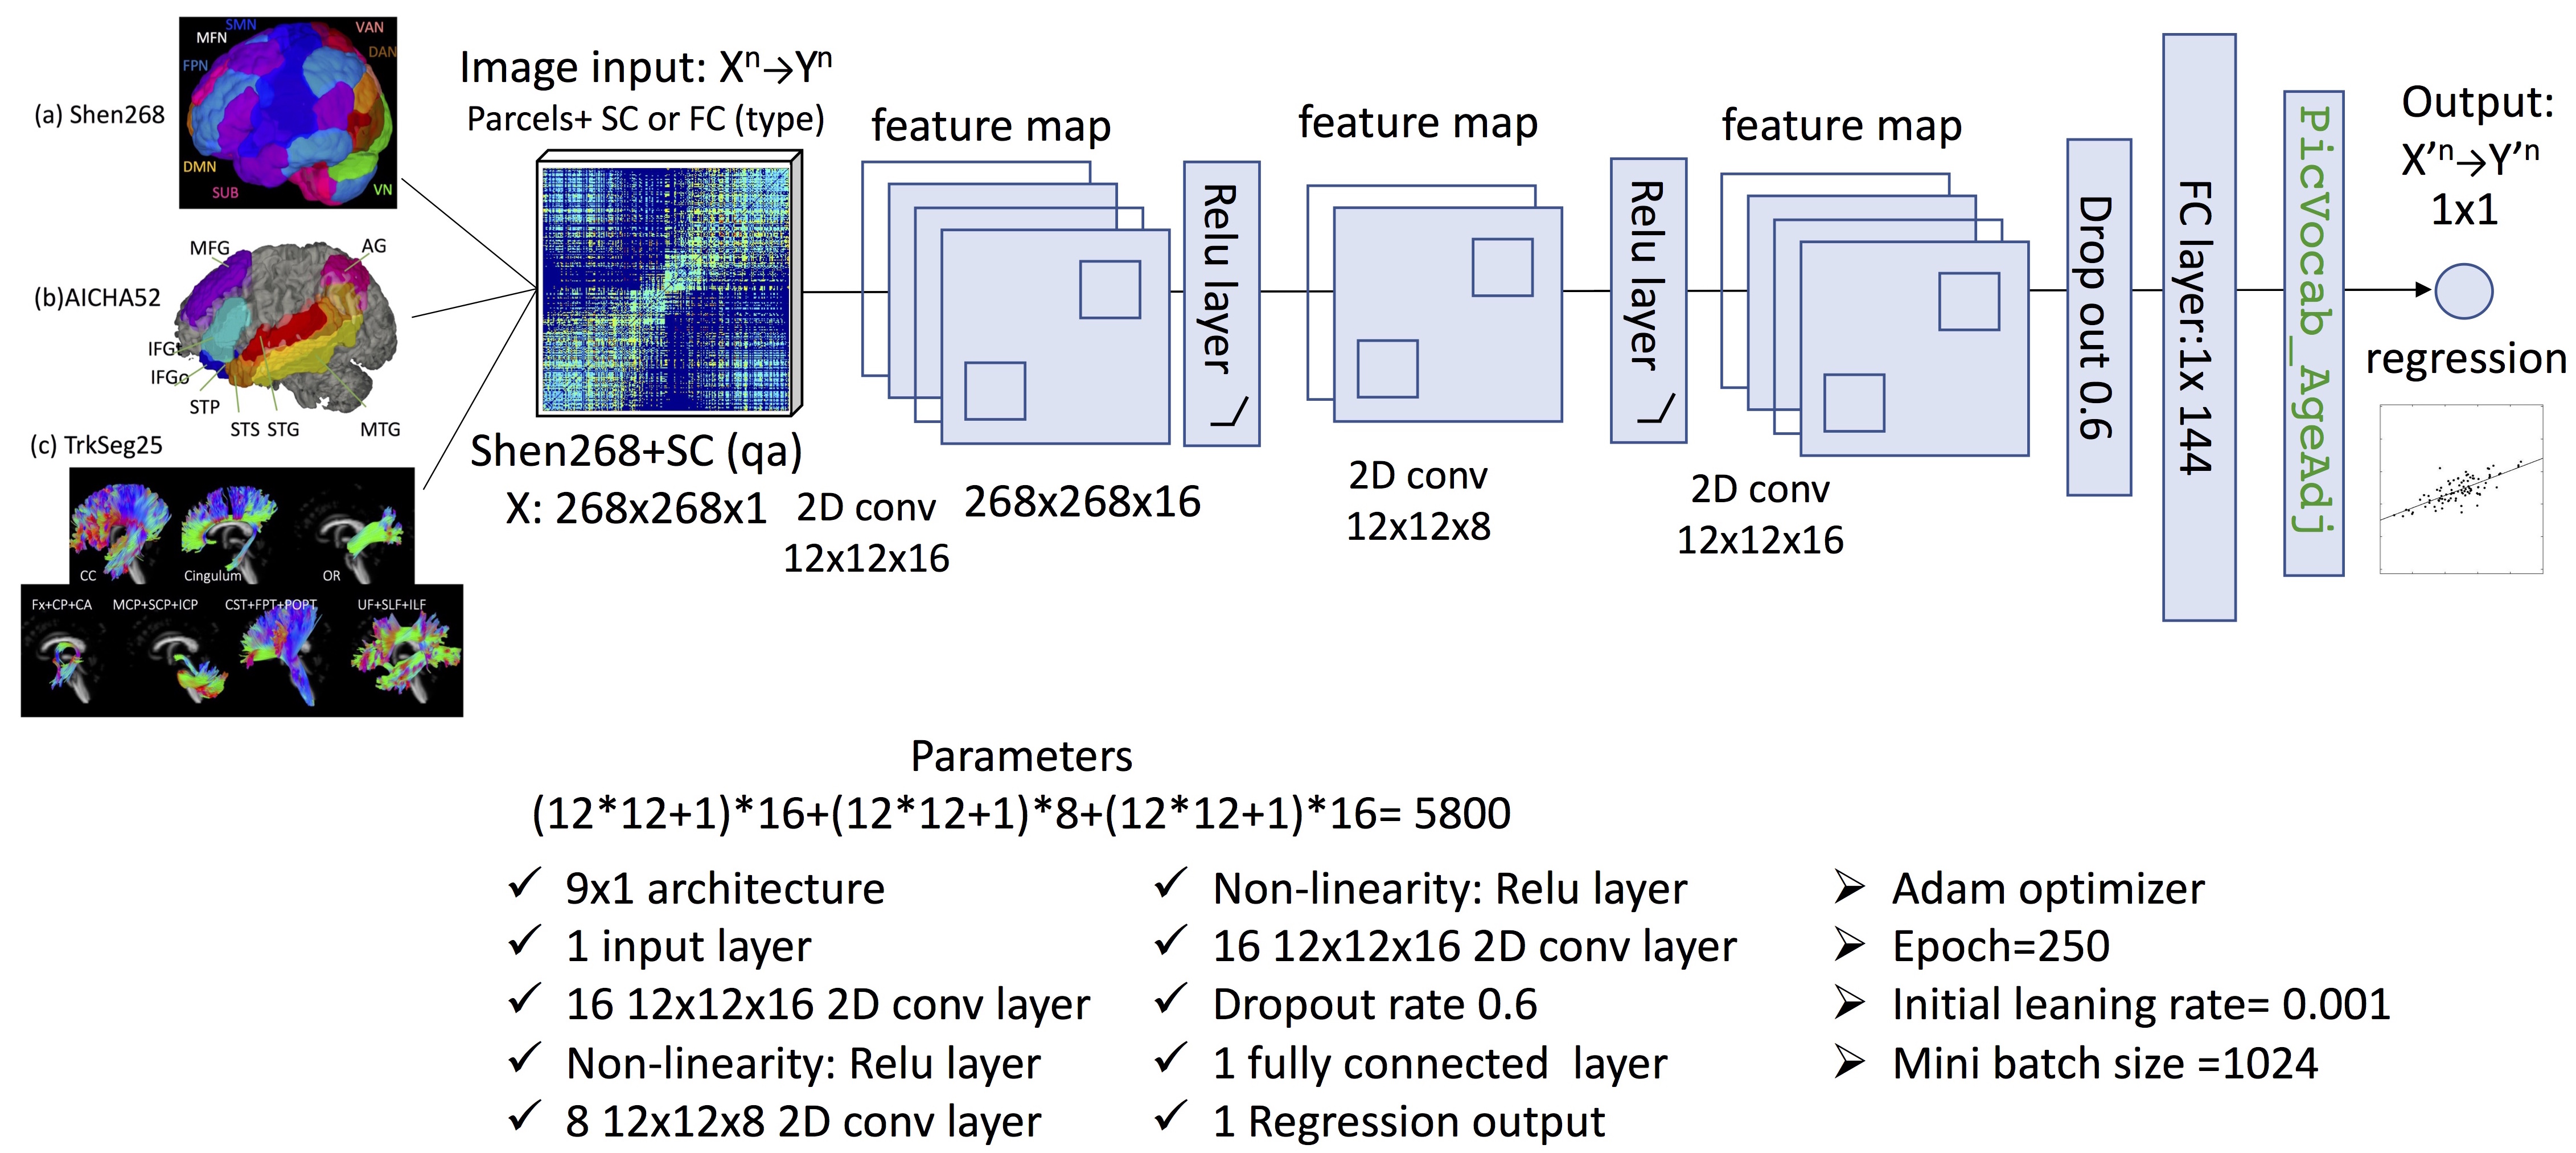
We included images from the HCP 900 subjects release (s900) dataset [2]. We focused on 144 unrelated subjects (64/80 male/female, age 28.5±4.0) for which both diffusion MRI and resting state fMRI scans are available (3T Connectome Skyra, 32-channel head coil). Resting state fMRI time series data (HCP filenames: rfMRI_REST1 (rest1) and rfMRI_REST2 (rest2)) were acquired with TR/TE=720/33.1ms, 2 mm$$$^3$$$ isotropic resolution. Diffusion MRI scan parameters were 6 b0-images, 270 diffusion weighting directions, b-max = 3000 s/mm$$$^2$$$, TR/TE=5520/89.5ms, 1.25 mm$$$^3$$$ resolution. Structural imaging (MPRAGE; 0.7mm$$$^3$$$ isotropic resolution) was used for registration. The preprocessing pipeline includes artifact removal, motion correction, and registration to the standard space. The parcellations were transformed to individual diffusion spaces using Elastix and tractography was performed with a deterministic streamline tracking algorithm [3] (turning angle threshold 450, fiber length between 20-500mm, one million tracts). We studied connectivity with three parcellation schemes: (a) Shen256 parcellation [4], (b) AICHA64 language networks [5] and (c) TrkSeg25 major fiber bundles optimization using tractography template [6] (Figure 1, left). We further calculated the SC based on quantitative anisotropy (qa), mean fiber length (mean length) and normalized number of streamlines (number counts) at the individual level. Non-image subject cognitive behavior measurements (including language score only) were extracted from the HCP data dictionary [7]. HCP data preparation for SCFCnn: we created training, testing, and validation groups from the HCP cohort using the golden 70-20-10 percentage rule. To improve the predictive performance of the neural network, a novel network architecture (SCFCnn, Figure 1) was introduced which reduces the fitting parameter complexity. To improve SCFCnn fitting performance, a deep convolution layer and a dropout layer (similar idea as the max-pooling) were added. Our purpose-built SCFC neural net implementation consists of a simple four-layer architecture with input layer, three 2D convolution 12-by-12 layers with 16, 8, 16 filters followed by a rectified linear united (Relu) filter layer and a dropout out layer with rate 0.6, one fully connected layer and regression output layer (total 8 layers). We used the root mean square error (RMSE) as loss function and Adam [8] as optimizer in order to train and test correlations of these measurements with functional or structural connectivity.Results and Discussion
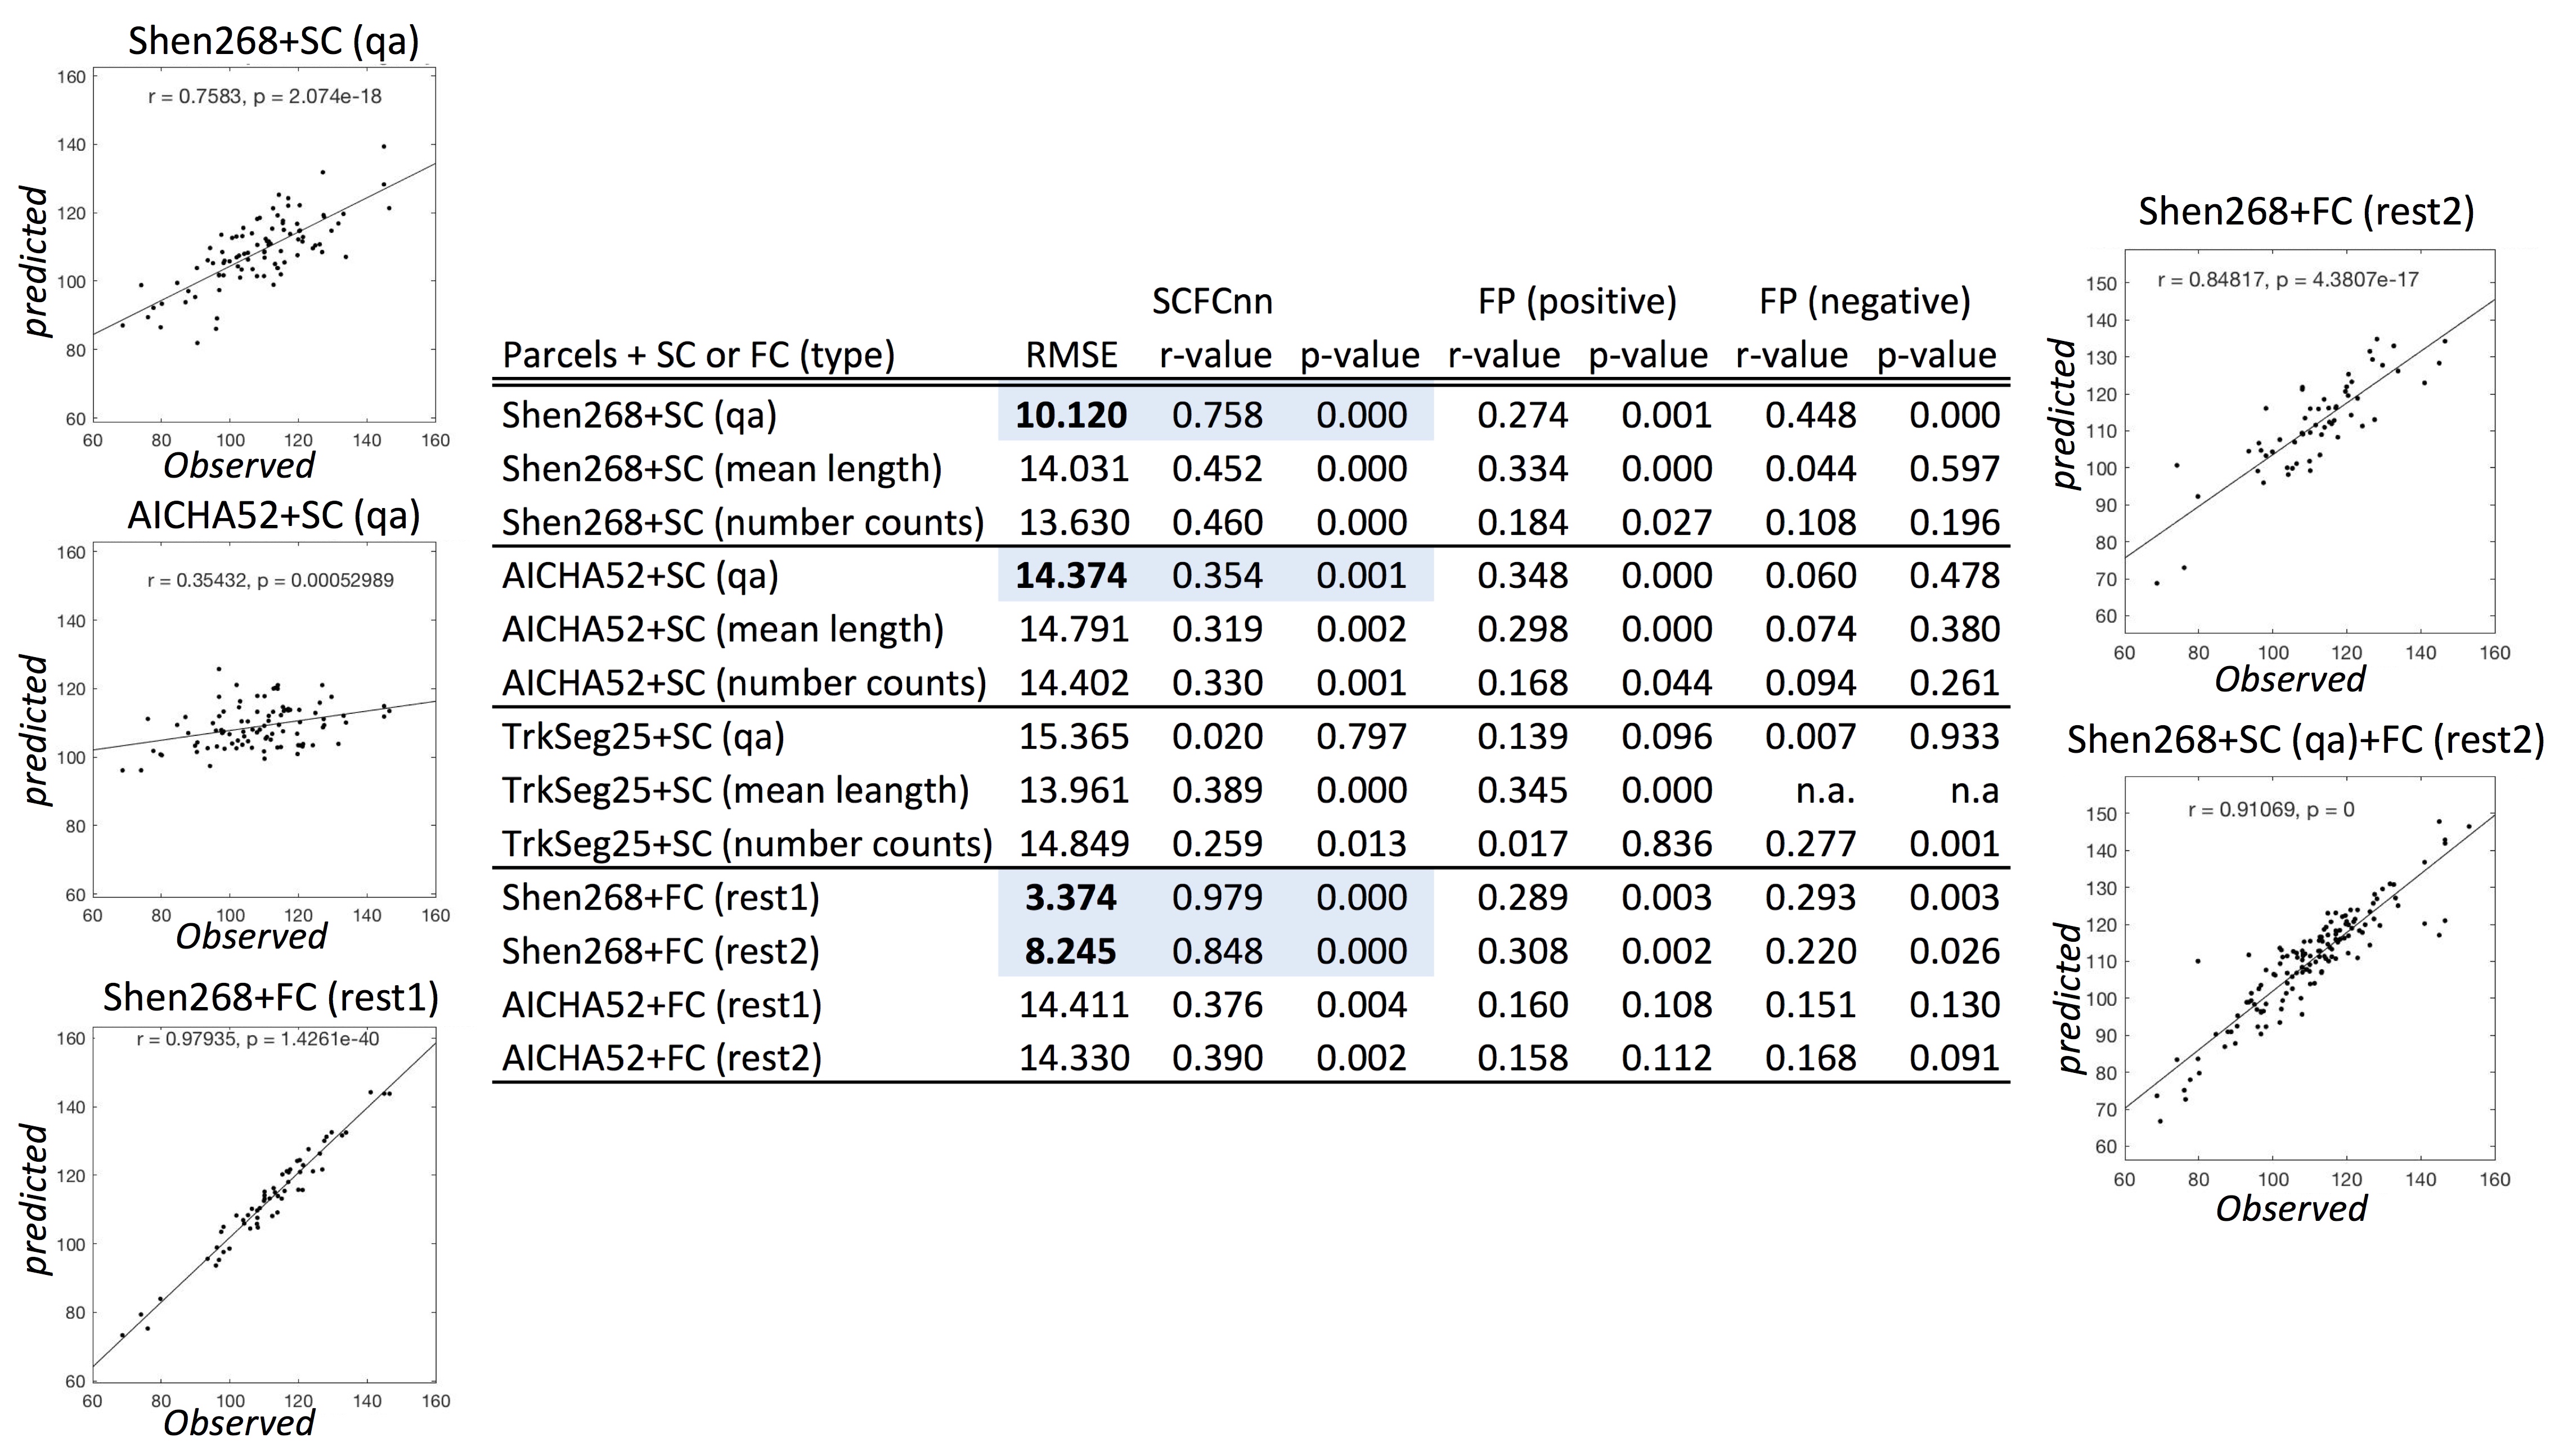
The architectural flow-chart of the simple four-layer SCFCnn pipeline is shown in Figure 1. The four layers are followed by two Relu layers and one dropout layer. The results of running SCFCnn in a training-testing-validation scheme (RMSE validation score) are listed in Figure 2. The efficient SCFCnn deep learning concept trained on SC/FC predicts language behavioral scores (PicVocab_AgeAdj). Indeed, language measurements show significant correlations to FC (rest2, RMSE = 8.245, r=0.8481, p<4.3E-17), SC (qa, RMSE=10.12, r=0.7583, p<2.07E-18) and SC+FC (qa, rest2, RMSE=6.705, r=0.9106, p<1E-40) in the shen268 parcellation. This shows that the SCFCnn pipeline has the ability to find causal links with SC. This efficient approach will allow SC, FC or other types of the connectivity measures to enhance prediction performance. These results confirm the importance of convolution neural networks applied to SC or FC connectivity matrices for better prediction performance than generalized linear models as used in the connectome fingerprinting [9] approach for the same neurocognitive measures (Figure 2).Conclusion
Our study focusses on the relationships between individual cognitive traits and functional and structural connectivity. The importance of convolution neural networks in SC or FC data is widely accepted. In this contribution, an SCFCnn neural network “fine-tuned” the model output to yield better language score correlations. As expected, the network performance was impacted by the depth of the network and size of the hyperparameter set. This behavior, however, can be regularized through further fine-tuning of the convolution filter sizes. The presented framework can, with minor modifications, be used to explore connections between MR imaging and cognitive behavior traits in public datasets such as the HCP dataset.Acknowledgements
This project is supported in part by PHS grants R01-CA111996, R01-NS082436 and R01- MH00380. Data were provided by the Human Connectome Project, WU-Minn Consortium (Principal Investigators: David Van Essen and Kamil Ugurbil; 1U54MH091657) funded by the 16 NIH Institutes and Centers that support the NIH Blueprint for Neuroscience Research; and by the McDonnell Center for Systems Neuroscience at Washington University.References
[1] He, T., Kong, R., Holmes, A.J., Sabuncu, M.R., Eickhoff, S.B., Bzdok, D., Feng, J., Yeo, B.T.T. (Is deep learning better than kernel regression for functional connectivity prediction of fluid intelligence?). In; 2018 12-14 June 2018. p 1-4.
[2] Van Essen, D.C., Ugurbil, K., Auerbach, E., Barch, D., Behrens, T.E.J., Bucholz, R., Chang, A., Chen, L., Corbetta, M., Curtiss, S.W., Della Penna, S., Feinberg, D., Glasser, M.F., Harel, N., Heath, A.C., Larson-Prior, L., Marcus, D., Michalareas, G., Moeller, S., Oostenveld, R., Petersen, S.E., Prior, F., Schlaggar, B.L., Smith, S.M., Snyder, A.Z., Xu, J., Yacoub, E., Consortium, W.U.-M.H. (2012) The Human Connectome Project: a data acquisition perspective. Neuroimage, 62:2222-2231.
[3] Yeh, F.-C., Verstynen, T.D., Wang, Y., Fernández-Miranda, J.C., Tseng, W.-Y.I. (2013) Deterministic Diffusion Fiber Tracking Improved by Quantitative Anisotropy. PLOS ONE, 8:e80713.
[4] Shen, X., Tokoglu, F., Papademetris, X., Constable, R.T. (2013) Groupwise whole-brain parcellation from resting-state fMRI data for network node identification. Neuroimage, 82:403-415.
[5] Del Gaizo, J., Fridriksson, J., Yourganov, G., Hillis, A.E., Hickok, G., Misic, B., Rorden, C., Bonilha, L. (2017) Mapping Language Networks Using the Structural and Dynamic Brain Connectomes. eneuro.
[6] Maier-Hein, K.H., Neher, P.F., Houde, J.-C., Côté, M.-A., Garyfallidis, E., Zhong, J., Chamberland, M., Yeh, F.-C., Lin, Y.-C., Ji, Q., Reddick, W.E., Glass, J.O., Chen, D.Q., Feng, Y., Gao, C., Wu, Y., Ma, J., Renjie, H., Li, Q., Westin, C.-F., Deslauriers-Gauthier, S., González, J.O.O., Paquette, M., St-Jean, S., Girard, G., Rheault, F., Sidhu, J., Tax, C.M.W., Guo, F., Mesri, H.Y., Dávid, S., Froeling, M., Heemskerk, A.M., Leemans, A., Boré, A., Pinsard, B., Bedetti, C., Desrosiers, M., Brambati, S., Doyon, J., Sarica, A., Vasta, R., Cerasa, A., Quattrone, A., Yeatman, J., Khan, A.R., Hodges, W., Alexander, S., Romascano, D., Barakovic, M., Auría, A., Esteban, O., Lemkaddem, A., Thiran, J.-P., Cetingul, H.E., Odry, B.L., Mailhe, B., Nadar, M.S., Pizzagalli, F., Prasad, G., Villalon-Reina, J.E., Galvis, J., Thompson, P.M., Requejo, F.D.S., Laguna, P.L., Lacerda, L.M., Barrett, R., Dell’Acqua, F., Catani, M., Petit, L., Caruyer, E., Daducci, A., Dyrby, T.B., Holland-Letz, T., Hilgetag, C.C., Stieltjes, B., Descoteaux, M. (2017) The challenge of mapping the human connectome based on diffusion tractography. Nature Communications, 8:1349.
[7] https://wiki.humanconnectome.org/display/PublicData/HCP+Data+Dictionary+Public-+500+Subject+Release
[8] Kingma, Diederik, and Jimmy Ba. "Adam: A method for stochastic optimization." arXiv preprint arXiv:1412.6980 (2014).
[9] Ying-Chia Lin, Steven H. Baete, Xiuyuan Wang, Fernando E. Boada , ”Functional- and Structural-Connectivity Connectome Fingerprints Correlate With Cognitive Behavior Traits in HCP Datasets”, In Proc. Intl. Soc. Mag. Reson. Med., 26, page 5218, Paris, France, 2018.
Figures